Mann recently told a realclimate reader that :
No researchers in this field have ever, to our knowledge, "grafted the thermometer record onto" any reconstruction. It is somewhat disappointing to find this specious claim (which we usually find originating from industry-funded climate disinformation websites) appearing in this forum.
Two archived versions of Crowley [2000] contain such splices – one spliced in 1870, one in 1965. Mann et al. [EOS 2003] used the 1870 splice in their spaghetti diagram. Jones and Mann [2004] used the 1965 splice, noting that this replaced an "incorrect version" used in the earlier study.


4 Comments
The document that the link at MORE points to appears to be presently located at
http://www.climateaudit.info/data/climate2003/blog/crowley_splices.htm
The picture within that webpage seems to be this one:
http://www.climateaudit.info/data/climate2003/images/draft14.gif
Thanks, Jacob!
The article actually predates ClimateAudit-blog (started on Jan 31, 2005), and was originally published on the website http://www.climate2003.com Steve had for awhile (see here).
This is very interesting! First, it is just amazing Steve was discussing Crowley’s splicing (and Mann’s comment) already in early 2005. I don’t recall reading the “MORE-part” before, so the end part is partly new to me:
The second interesting thing is that we see that Steve is only a human, he was mistaken! Mann et al. (2003) (more recent posts about that study, see, e.g., here and here) did not use “Version 2” as was later found out, but they actually used MBH99+0.5sigma!
I noticed another thing, which I leave to Steve to decide. I think Steve was mistaken on another point too: Jones & Mann (2004) did not use “version 1” (black in Steve’s figure) but “version 2” (red) (which is not from Crowley and Lowery (2000) as J&M claim but from Crowley (2000) !!) – the one with instrumental splice between 1870-1965!
But there is even more! While “researching” for this comment, I learned that Steve had observed already back in 2005 that Crowley (2000) and Crowley & Lowery (2000) had used, which is now known as, Phil’s combo (without Keith’s Science Trick) also in displaying MBH99! Not only that, the Crowley series splicing (with Keith’s style of cutting back the reconstruction) is explicitly stated in Crowley (2000)! This (along what they did in WMO graph) puts Mann’s infamous comment over RC in to very interesting light.
“Not only that, the Crowley series splicing (with Keith’s style of cutting back the reconstruction) is explicitly stated in Crowley (2000)! ”
But MBH99 splice not. Interesting. I need to update the timeline ( https://climateaudit.org/2010/02/26/the-trick-timeline/ ). Is this really concatenate the raw data and then smooth, or something different?
Re: UC (Nov 23 08:11),
No, neither there is any mentioning of a splice in Jones et al (1998), which I think also has a splice (1992-1998 before smoothing) in C & L (2000) Figure 2:
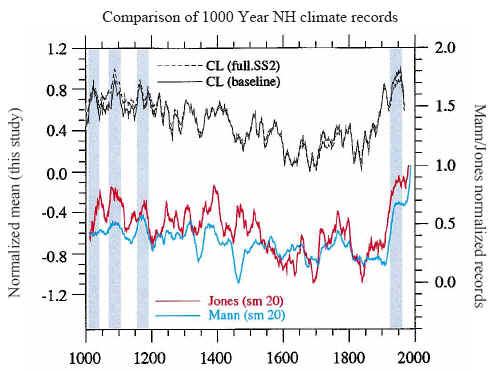
The final uptick does not appear in the original reconstruction.
I think you can perfectly replicate the MBH recon (red) in Crowley (2000) Figure 1 using the NOAA MBH99 archive by simply concatenating the raw instrumental (1981-1998) to the end of the recon and then taking 11-point running mean.