Continuing my industrious typing from old IPCC reports, here is an extended excerpt from IPCC 1995 (SAR) dealing with climate change and variability.
If you recall from IPCC 1990, it left an important oustanding question as to the impossibility of attributing the portion of present warming that it is due to human influences, when the attribution of past warmings of equal or greater size was not understood. IPCC 1990 also was reluctant to rely heavily on tree ring results. Here we see that the attribution is past warmings is not resolved; what they do instead is to re-define the issue to the Holocene after 10,000 BP and then argue that no temperature changes of 1 degree in a century have occurred in that period. This latter point is based on Wigley and Kelly [1990].
I’ll comment later on Wigley and Kelly [1990], but will observe here that Wigley and Kelly are both important advocates and I don’t think that either of them have published extensively on the Younger Dryas.
The Summary to Chapter 3 of SAR stated:
The general, but not global, tendency to reduced diurnal range over land…has been confirmed. The range has decreased in many areas because nights have warmed more than days. Cloud cover had increased in many of the areas with reduced diurnal range. Minimum temperature increases have been about twice those in maximum temperatures…
Northern Hemisphere summer temperatures in recent decades appear to be the warmest since at least about 1400 AD based on a variety of proxy records. The warming over the past century began during one of the coldest periods of the past 600 years…. Ice core data from several sites around the world suggest that 20th century temperatures are at least as warm as any century since about 1400 and at some sites the 20th century appears to have been warmer than any century for some thousands of years… Temperatures have been far less variable in the last 10,000 years (the Holocene) relative to the previous 100,000 years. Based on the incomplete observations and paleoclimatic evidence available, it seems unlikely that global mean temperatures have increased by 1 deg C or more in a century at any time during the last 10,000 years.[my italic]
This last line is the important carryforward line, which I’ll trace here to Wigley and Kelly 1990. Temperature data from Jones [1994] is shown. There is a discussion of urban heat island effect, relying on Jones et al [1990], but also citing studies by Portman contrasting cooling of 0.05 deg C from rural stations in China versus 0.22 deg C from urban stations, and Christy and Goodridge. I once tried to get Jones’ data for this study, but he said that he didn’t know where the diskette was. The Jones et al [1990] study on urban heat island effect was also relied upon in TAR.
Section 3.6 discusses whether 20th Century Warming is unusual and is about 8 pages long. They state that:
IPCC (1990) provided a broad overview of the climates of the past 5,000,000 years and a more detailed presentation of three periods suggested as possible analogues of a greenhouse-enhanced world. IPCC (1992) concentrated on the climate of the past 1000 years, a topic which this chapter also examines, because of the recent increase in data for this period and because of its relevance to the current climate. The data from the last 1000 years are the most useful for determining the scales of natural climate variability.
I’m not sure that I would characterize IPCC (1992) as “concentrating” on the climate of the past 1000 years. The treatment of the topic in IPCC (1992) on either scale was cursory. It seems to me that the claim “the data from the last 1000 years are the most useful for determining the scales of natural climate variability” is something that needs to be demonstrated rather than simply asserted. It may or may not be true.
They then discuss an interesting and important paleoclimate controversy: tropical sea surface temperatures in the last glacial maximum. The implication was that, if there were large disputes on calibrating “proxies”, there were still important limitations in the ability to confidently use proxies to estimate past temperatures. Their words were as follows:
The difficulty of determining past climates can be illustrated by the case of tropical sea surface temperatures (SSTs) around the time of the last glacial maximum (around 22,000-18,000 years ago) The lack of consensus on this topic provides an indication of the problems of using proxy data. …Terrestrial surface temperatures estimates from snow line and pollen data, …SSTs from coral, … and from ice cores in the Andes do not concur with estimates from other sources such as oxygen isotope, planktonic foraminiferal and pollen records and the temperature dependent saturation of long-chain alkenones…The land-based data (and some estimates from coral) suggest that ice age SSTs were about 5 deg C lower than present, while the other sources suggest about 1-2 deg C. These inconsistencies cause problems in the use of paleoclimatic data to validate climate models and needs to be resolved.
IPCC 1995 starts using tree ring reconstructions without discussing why the caveats of IPCC 1990 towards tree ring reconstructions were no longer applicable. They state:
For example, a significant number of annually resolved, precisely dated temperature histories from tree rings are available. However these records are still too sparse to provide a complete global analysis and must, in general be interpreted in a regional context. In addition, they usually only reflect changes in warm-season (growing season) temperatures. Tree-ring records frequently represent interannual and decadal climate variability with good fidelity, as indicated by comparison with recent instrumental records. However the extent to which multidecadal, century and longer time-scale variability is expressed can vary, depending on the length of individual ring-width or ring-density series that make yup the chronologies and the way in which these series have been processed to remove non-climatic trends. In addition, the possible confounding effects of carbon dioxide fertilization needs to be taken into account when calibrating tree ring data against climate variations. [my italic and bold]
It will be interesting to follow the caveat about carbon dioxide fertilization into IPCC TAR, since we now know that the MBH98 recosntruction is dependent upon the presence of the tree ring sites most identified with carbon dioxide fertilization. They make short comments about coral and ice core. Then follow comments on the Medieval Warm Period and Little Ice Age:
There are two periods which have received special attention, the Medieval Warm Period and the Little Ice Age. These have been interpreted, at times, as periods of global warmth and coolness, respectively. Recent studies have re-evaluated the interval commonly known as the Medieval Warm Period to assess the magnitude and geographical extent of any prolonged warm interval between the 9th and 14th centuries (Hughes and Diaz, 1995), The available evidence is limited (geographically) and is equivocal… This rather incoherent picture may be due to an inadequate number of records or a bias in the geographical and seasonal. However at this point it is not yet possible to say whether on a hemispheric scale, temperatures declined from the 11-12th to the 16-17th century. Nor therefore is it possible to conclude that global temperatures in the Medieval Warm Period were comparable to the warm decades of the late 20th century.
"Recent studies" here appears to be merely Hughes and Diaz [1994]. This study does not withstand any sort of close scrutiny. Hughes is the H co-author of MBH. They then state the following about the Little Ice Age:
The term Little Ice Age is often used to describe a 400-500 year long globally synchronous cold interval, but studies now show that the climate of the last dew centuries was more spatially and temporally complex than this simple concept implies (Jones and Bradley 1992). It was a period of both warm and cold climatic anomalies that varied in importance geographically. For the Northern Hemisphere as a whole, the coldest intervals of summer temperature were from 1570 to 1730 (especially 1600 to 1609) and during most of the 19th century, though individual records show variations in this basic pattern. Warmer conditions were more common in the early 16th century and in most of the 18th century, though for the entire hemisphere, conditions comparable to the decades from 1920 onward (the time when instrumental records become more reliable and widely available) have not been experienced for at least several hundred years. Temperatures from boreholes (Section 3.2.5.2.) also suggest that the present temperatures in parts of North America and perhaps elsewhere may be warmer than the last few hundred years. Regional temperatures do not all, of course, conform to this pattern. For example, spring temperatures during the period 1820 to 1770 appear to be warmer than the 20th century in parts of China (Hameed and Gong, 1994). However despite the spatial and temporal complexity it does appear that much of the world was cooler in the few centuries prior to the present century.
This presentation is drawn from Jones and Bradley [1992] and Bradley and Jones [1993,1995]. Bradley is the B of MBH. Jones is the Jones of Mann and Jones [2003], Jones and Mann [2004]. They then present the post-1400 reconstruction of Bradley and Jones from 16 paleoclimatic records [1993, 1995] in their Figure 3.20, which ironically still shows the effect of SST estimates in the 19th century before Folland’s re-adjustment of wooden buckets.
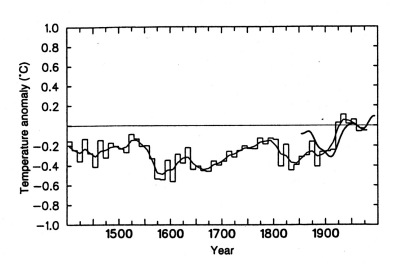
IPCC SAR Figure 3.20
The following is stated in respect to individual tree ring series:
Regionally however the recent warming is not always exceptional. For instance, in the Swedish Tornetrask tree-ring series, the 20th century appears as a relatively minor event (Briffa et al, 1990, 1992). In this region, in both the 1400s and especially the 900-1100 interval, summer conditions appear to have been warmer than today. Tree-ring width series from the northern Urals (Graybill and Shiyatov, 1992) indicate that in this area 20th century summers have been somewhat warmer than average. A recent analysis, using tree-ring density has attempted to reproduce more of the century time-scale variability in this region (Briffa et al., 1995). This shows that the 20th century was clearly the warmest in the last 1000 years in this region, though shorter warmer periods occurred, for example, in the 13th and 14th centuries. The California Cirque Peak ring-width cool-season temperature history (Graybill and Funkhouser, 1994) indicates unusual warmth during most of the 20th century, but with recent cooling (contrary to instrumental observations in this area). The nearby Campito Mountain ring-width warm-season temperature history (Lamarche 1974) agrees well with the Cirque Peak record e.g. the 20th century appears to have been unusually warm, while the 17th century was generally cool. North-west Alaska has been unusually warm during the 20th century (Jacoby et al, 1996).
The Tornetrask study of Briffa et al [1992] has also been discussed on this site, showing some unacceptable statistical practices. The IPCC does not indicate any awareness of the "adjustment" by Briffa and Jones of the Tornetrask record. The Polar Urals study of Briffa et al. [1995] has also been discussed at length on this site, showing that the early portion of this record do not meet quality control standards. It’s pretty clear to me that Briffa and Jones were reaching to get an 11th century portion to this record. Briffa and Jones are both key Hockey Team authors at CRU – so the very selection of individual proxies for highlighting (out of all the possible proxy series in the world) seems biased towards promoting work by associates of the lead chapter authors. The other two series – Campito Mountain and Cirque Peak – are bristlecone/foxtail pine series. Campito Mountain is cited in Graybill and Idso [1993] as a key example of 20th century carbon dioxide fertilization. Campito Mountain is also discussed in Cook and Peters [1997] as one of two examples of problematic standardization (Gaspé is the other). The issues involved with these series are familiar to readers of this blog. Although the IPCC issued a caveat about carbon dioxide fertilization, this is not explicitly noted in connection with these two "proxies". I haven’t re-examined the specific Jacoby article for this note, but I’ve posted lots on Jacoby and on Alaska specifically.
Next is a short comment on the Southern Hemisphere tree rings and ice core:
In the Southern Hemisphere, the records from Australasia show evidence of recent unusual warmth, especially since 1960, but some from South America do not. Thus the Northern Patagonia and Rio Alerce ring-width records from Argentina (Villalba, 1990; Boninsegna, 1992) and the Chilean Lenca ring-width temperature history (Lara and Villalba, 1993) show no clear indication of 20th century warming in accord with local instrumental records (Villalba, 1990). Recently analyzed ice cores from the north-central Andes (Thompson et al 1995) indicate that temperatures were cool in the 200-500 years before the present. Strong warming has dominated the last two centuries in this region. Temperatures in the last two centuries appear higher than for some thousands of years in this area. New Zealand tree rings reproduce the warming observed instrumentally since about 1950 although there is also a suggestion of warmer periods early in the 18th and 19th centuries (Salinger et al. 1994) near a time of maximum mountain glacier ice volumes in the Southern Alps of the country. The Tasmanian Lake Johnston history (Cook et al 1991) shows recent anomalous warming especially since 1960 (Cook et al 1992).
In IPCC 1992, when Antarctic isotopes seemed to go against their expectations, IPCC 1992 quoted concerns from Peel about potential lack of correlation between isotopes and temperature, but no such caveats are applied to Thompson’s results (although there is much specialist concern about the "amount effect" as a contributing factor to tropical dO18 values). I’ve looked at the Lake Johnston site in some detail and there is considerable evidence of higher growth rates in the past. In fact, the Lake Johnston huon pine site is out of range of its present ecological niche (like some other very old sites) and there is much to suggest warmer past periods from this site.
On to a discussion of corals:
Temperature records derived from coral supplement the records from tree rings. A Galapagos Islands coral temperature record from 1607 to 1982 has been derived by Dunbar et al [1994] who found a very high correlation with directly measured local annual SST for 1961 to 1982. Coral-estimated SSTs have fallen significantly throughout the 20th century in this location and may now be at their lowest since 1650. This is in broad agreement with the lack of recent warming in the South American tree-ring studies. However there has not been a general cooling in the eastern tropical Pacific this century (Bottomley et al, 1990) so the Galapagos cooling may be a local phenomenon. Australian Great Barrier Reef temperature histories since 1583 have been derived from corals distributed along the reef from 10-30 deg S (Lough et al, 1996). These coral-based SSTs have been relatively warm for most of the 20th century. This warm period was preceded by below-average SSTs in the 1850-1900 period. An earlier warm period is indicated around 1830 to 1840 but with less certainty. The pre-1800 period was probably a time of conspicuously below-average SSTs. Similar results were obtained from the Abraham Reef record (Druffel and Griffin, 1993) on the southwestern tip of the Great Barrier Reef.
The comment about Galapagos corals is pretty interesting. MBH98 uses the Galapagos corals. I haven’t examined this proxy in particular, but have some of the underlying articles. If this series shows "cooling", MBH98 methods, which are just data mining, will simply flip over the series, so that a series, construed here as showing cooling, will have a negative coefficient in MBH98 regressions and not result in a cooling influence. This happens with some of the instrumental temperature series in MBH98. Instrumental temperature series which do not go up in the 20th century are construed as having a negative relationship to the "climate field"; thus high values of these series in the 18th century result in lower values of the MBH98 northern hemisphere total – strange but true.
This is followed by a discussion of African hydrology noting a much wetter climate over Africa in the 10-13th centuries, followed by drier regimes in the 14th and 15th centuries which resembled 20th century climate, then relatively wet in the 16th to 18th centuries, with extreme droughts in the Sahel in the 1680s and 1740s-1750s, continental-scale dryness beginning in the 1790s climaxing in the 1820s-1830s. I find the topic of African aridity to be very interesting, especially since we know for certain that the Sahara was a grassland during historical (Old Kingdom ancient Egypt) times.
This is followed by a discussion of detection (I’m not getting into the Santer issue for now; that’s a different section of SAR) as follows:
The climate of the past 1000 years provides opportunities to determine the spatial and temporal scales of natural climate variability required for detection of climate change and the causes of the natural climate variations. A relatively small number of records from key regions could help discriminate the relative importance of different phenomena (Crowley and Kim, 1993) in the creation of decadal-century time-scale variability.
Note the change in nuance between the first sentence here and the summary, which inflated the first sentence into:
The data from the last 1000 years are the most useful for determining the scales of natural climate variability.
Then they say:
…Some of the paleoclimatic records already exist. Figure 3.21 (after Thompson et al, 1993) shows temperature estimates from ice cores in several widespread locations. These show warming this century but the warming appears to be more significant in some locations than others. As noted above, geographical differences also exist in the warming estimated from tree-ring chronologies. The development and combination of more high-quality recodes such as those in Figure 3.21 (8 ice core àŽàⳏ18 records from 1200-2000) are needed if a more complete understanding of natural climate variability is to be gained. Overall however it appears that the 20th century has been at least as warm as any century since at least 1400 AD. In at least some areas, the recent period appears to be warmer than has been the case for a thousand or more years (Briffa et al., 1995; Thompson et al 1995). Alpine glacier advance and retreat chronologies (Wigley and Kelly, 1990) suggest that in at least alpine areas, global 20th century temperatures may be warmer than any century since 1000 AD and perhaps as warm as any extended period (of several centuries) in the past 10,000 years. Crowley and Kim (1995) estimate the variability of global mean temperature on century time scales over the past millennium as less than +- 0.5 deg C. [my italic]
These last two lines are the ones that jettison the issue of attribution of past climate change. I’ll try to get to comments on the two sources quoted here. It would be nice if they were relying on sources that were not so closely associated with the campaign. I wonder how strong Wigley and Kelly, 1990 and Crowley and Kim, 1995 really are, especially relative to some of the recent work from Joerin and Nicolussi noted up recently on this site.
Section 3.6.3 discusses Rapid Climate Changes in the Last 150,000 Years, opening with:
The warming of the late 20th century appears to be rapid, when viewed in the context of the last millennium (See above, and Figures 3.20 and 3.21). But have similar rapid changes occurred in the past? That is, are such changes a part of the natural climate variability? Large and rapid climatic changes did occur during the last ice age and during the transition towards the present Holocene period which started about 10,000 years ago (figure 3.22). These changes may have occurred on the time-scale of a human life or less, at least in the North Atlantic where they are best documented…. The observed rapid changes are often large in magnitude and thus there is considerable confidence in their reality.
There is evidence from these records of rapid warming ~11,500 calendar years ago. Central Greenland temperatures increased by ~7 deg C in a few decades (Dansgaard et al; 1989; Johnsen et al 1992; Grootes et al 1993). There are indications of an even more rapid change in the precipitation pattern (Alley et al 1993) and of rapid reorganizations in the atmospheric circulation (Taylor et al 1993a,Majewski et al 1993). Changes in SST, associated with sudden changes in oceanic circulation, also occurred in a few decades, at least in the Norwegian Sea (~5 deg C in fewer than 40 years: Lehman and Keigwin 1992). …
There is also firm evidence of rapid warm,-cold oscillations during the last glacial (Dansgaard-Oeschger events) in the central Greenland records (Johnsen et al 1992). Rapid warming of ~5-7 deg C in a few decades were followed by periods of slower cooling and then a generally rapid return to glacial conditions. About 20 such intervals (interstadials) lasting between 500 and 2000 years occurred during the last glacial period (Dansgaard et al 1993). The most prominent of these interstadials may be associated with the sedimentary Heinrich layers interpreted as reflecting massive iceberg discharge from Northern Hemisphere ice sheets (Bond et al 1993; Majewski et al 1994; Bond and Lotti 1995) see Figure 3.22. These discharges occurred at the end of the cooling cycles and were followed by abrupt shifts to warmer SSTs.
During the last glacial period, rapid changes were also felt over at least parts of continents as suggested by recently obtained records for Western Europe, North America and China…This suggests that the interstadials were at least hemispheric in their extent. Moreover, Greenland interstadials lasting more than 2000 years have weaker and smoother counterparts in Antarctica (Bender et al 1994…)), Keigwin et al (1994) also report evidence from terrestrial paleoclimate data suggesting that the short duration event since about 100,000 years ago were at least hemispheric, possibly global in extent.
Then there is a discussion of possible climate instability in the last interglacial (Eemian), which is inconclusive. Then:
Abrupt regional events also occurred in the past 10,000 years (e.g. Berger and Labeyrie, 1987). These changes however have been smaller and smoother than those during the previous interglacial period. Such events are perhaps more relevant to the estimation of the possible speed of the natural climate variations in the current climate because of the closer similarity of boundary conditions (e.g., continental positions and ice sheets) to the current situation. It seems unlikely, given the smaller regional changes, that global mean temperatures have varied by 1 degree C or more in a century at any time during the last 10.000 years (Wigley and Kelly, 1990). [my italic again – here is Wigley and Kelly 1990 again]
Their summary states the following:
Two views of the temperature record of the last century are possible if this record is viewed with the longer perspective provided by the paleoclimatic data (Figure 3.20). On the one hand, the long-term change of temperature could be interpreted as showing a gradual increase from the late 16th century interrupted by cooler conditions in the 19th century. Alternatively, one could argue that temperatures fluctuated around a mean somewhat lower than the 1860 to 1959 average (punctuated by cooler intervals in the lat 16th, 17th and 19th centuries) and then underwent pronounced and unprecedented (since 1400) warming in the early 20th century. Whichever view is considered, mid-late 20th century surface temperatures appear to have been warmer than any similar period of at least the last 600 years (Figures 3.20, 3.21). In at least some regions, 20th century temperatures have been warmer than any other century for some thousands of years. [my italic one more time]
This last sentence was pretty important to IPCC SAR. It will be interesting to see if Wigley and Kelly, 1990 and Crowley and Kim, 1995 live up to the weight of the conclusions which they are being asked to bear. Again, for an important conclusion like this, one would like to see broader support than a couple of studies by people prominently associated with the campaign. Perhaps this is a precursor to TAR’s similar reliance on MBH.


7 Comments
Check this:
“There is evidence from these records of rapid warming ~11,500 calendar years ago. Central Greenland temperatures increased by ~7 deg C in a few decades (Dansgaard et al; 1989; Johnsen et al 1992; Grootes et al 1993). There are indications of an even more rapid change in the precipitation pattern (Alley et al 1993) and of rapid reorganizations in the atmospheric circulation (Taylor et al 1993a,Majewski et al 1993). Changes in SST, associated with sudden changes in oceanic circulation, also occurred in a few decades, at least in the Norwegian Sea (~5 deg C in fewer than 40 years: Lehman and Keigwin 1992). …”
and compare it with this:
“…..Paleo-bottom water temperatures show a relatively fast increase at approximately 12.5–10 ka (calendar years) following the Younger Dryas while stable warm water conditions have prevailed since then….
Despite sea level rise, this warm-water inflow caused a major reduction in the thickness of the gas hydrate stability zone along the upper slope of the mid-Norwegian margin….
Although the major phase of hydrate melting predates the Storegga slide event, dated at 8.2 ka (calendar years), reduced hydrate stability conditions could have facilitated or contributed to sub-marine slope failure”
JàÆà⻲gen Mienert et al (2005) Ocean warming and gas hydrate stability on the mid-Norwegian margin at the Storegga Slide Marine and Petroleum Geology Volume 22, Issues 1-2 , January-February 2005, Pages 233-244
Then it might be clear that clathrate decomposition events may have a far greater impact on climate than expected. But, there is neither clathrate in the IPCC climate assessment, nor mammoths, who went extinct as a direct result of the Storegga clathrate event.
Dear Steve, I suppose the comment about the advocates is a joke. That would be more impressive for advocates to write an influential paper than for a patent clerk or a mining consultant! 😉 Thomas Wigley is a climate scientist from Boulder, Colorado, who has contributed significantly to IPCC working group I second report. It seems that PM Kelly is also a climate expert.
Lubos, you’ve misconstrued my meaning here. I didn’t mean “advocate” in the sense of being a “lawyer”, although, as I recall, Charles Lyell was a lawyer. I meant it to denote that they were strongly associated with a certain point of view on climate. There are hundreds of geologists studying paleoclimate; I realize that Wigley and Kelly are prominent climate scientists, although I haven’t seen evidence that they are Younger Dryas specialists. I’d be happier seeing some of these views being derived from more technical specialists. The issue is somewhat moot as I can’t see that Wigley and Kelly 1990 supports the views attributed to them, as I’m about to post up. Steve
Comment to #1
I checked the very interesting volume of Marine and Petroleum Geology (Volume 22) about Storegga slide, comprising 27 articles.
I didn’t find direct comment about the extinctions mammoths, but I doubt a connection with Storegga slide 8200 years ago.
Decline of mammoth populations started earlier, probably immediately after Younger Dryas, although they occurred still on Wrangel Island north of Siberian coast 2700-3500 years ago.
There is, however, a controversial theory about the mass extinctions of large mammals after the ice age. Some studies say that man himself caused the extinction by means of efficient hunting. The problem with this theory is that exact dating of extinctions of mammoth populations does not help, because we cannot reconstruct in a proper way the possibilties of man impact.
The warming some times after Younger Dryas is as such a much better alternative which explain large scale changes in the vegetation zones.
Larry Huldén
Reply to #4.
Did you also check the 250-500 other publications pertaining to the Bolling Allerod – Younger Dryas – Preboreal sequence? Like the dozen palynological studies that clearly indicate that those sequences had very little to do with temperature changes, but a lot with precipitation changes? for instance Bjàƒk et al http://www.geol.lu.se/personal/seb/Geology.pdf.pdf
Moreover, The d13C signature, the snow accumulation rates, the CH4 concentration all reacting in concert? Have you seen how the not recognised difference between the 14C age method and the calendar age counting (1000-2000 years in that period) has caused a major screw up.
There is a little hypothesis of mine that the direct physical effect of a massive clathrate destabiisation event with the size of a small country, lasting for centuries, if not millenia, has a major impact on world climate by injecting incredible amounts of water vapor in the air. Finding Mienert concluded it instead of starting it.
But it would take a few decennia I guess to convince the esthabliment that such an event explains about exactly what we see today as evidence.
Nr#1 comment was not a casual exclamation but the end of a 7 years old quest.
#5 No, I didn’t check all these publications. I expressed myself badly. I was thinking of timing rather than the temperature.
To me Storegga slide is too late to be the cause of mammoth or other large mammal extinctions, unless there are new information on the topic.
The Finnish mammoth remains have recently been redated and it appeared that they mostly were about 30.000-40.000 years old. Previously they were thought to be from after the last maximum glaciation. This was a proof that there have been warmer periods with extensive vegetation in Finland during the glaciation about 90.000-10.000 years ago.
I agree with you that precipitation is certainly a much more important factor than temperature impacting vegetation and fauna.
I do have seen a general study on vegetation history of Europe based on palynological series. The result was that species composition have varied a lot through times. No vegetation zones in the past could be compared with the corresponding zones of present times. People obviously have been too fixed to temperatures as a dominating factor and neglected variations in precipitation.
This year spruce has grown more than ever in Finland (max. about 70 cm in height) because of doubling of precipitation in the spring.
Now I think I have jumped off the current topic.
Larry Huldén
Re 6
The problem with Storegga indeed was the timing, that’s why I discarted it initially. but then
Mienert et al came up with: “Paleo-bottom water temperatures show a relatively fast increase at approximately 12.5–10 ka (calendar years)”
This is making it clear that the clathrate decomposition started happening well before the land-slide, ultimately causing it. If we can ever measure the dating more accurately I predict that it started at 11,650 calender years BP.
The mammoth last dates in Eurasia (except Wrangel Island) are around 9750 BP 14C years. That converts to ~11,100-11,300 Cal BP years. One of the more accurate varve proxies, Meerfelder Maar (Brauer 2002-2004) puts the precipitation increase at 11,650 Cal BP.
Indeed when you start reading all those palynological studies with the idea precipitation + d13C drop due to the low clathrate signature things start to fit exactly.
The 30,000 – 40,000 year dating in Finland is consistent with datings in the rest of Eurasia included more glaciated area’s, showing indeed that the ice ages were completely different than the general scholar view. It’s time indeed to expose that isotopes in ice cores are not related primarely to temperature but to precipitation like it is now, it has always been that way. And ultimately it were those isotopes that triggered the 10-degrees-temperature-change-within-a-decade misconception and that ultimately caused the global warming due to greenhouse gas hype.