I tested some cells which were outliers under the ARMA(1,1) model. Here’s the result of the first cell that I looked at: the top panel shows the ACF – which has an unusual structure to say the least. The temperature anomaly plot is shown in the second panel and is also unusual to say the least.
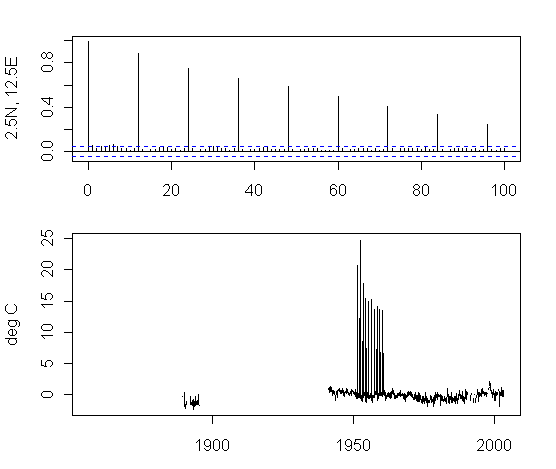
I started by selecting cells for which the AR1-MA1 coefficients >1.9, looking at the cell with the maximum value first – which was gridcell 2.5N, 12.5E, which seems to represent a location in Congo (not Zaire), plotting the autocorrelation function and then the temperature plot.. Obviously some gridcell values are wrong. Here is an excerpt from the data set, indicating that 10 values are completely wrong. This is a 2003 vintage of the data set and I will update to 2005. It’s possible that this has been picked up in later updates, but, even if it has, these datasets have obviously been extensively used in each edition.
| 1949 | 90 | -14 | 42 | 85 | 76 | 50 | 74 | 46 | 48 | 44 | 58 | 29 |
| 1950 | 60 | 9 | 29 | 23 | 12 | 81 | -8 | -23 | -6 | -20 | -7 | 37 |
| 1951 | 25 | -53 | -60 | 2078 | 2 | 35 | 15 | -38 | 10 | 23 | 12 | 37 |
| 1952 | 27 | -40 | -26 | 2476 | -46 | 4 | -30 | -90 | -28 | -8 | -52 | -18 |
| 1953 | -30 | -110 | -79 | 1786 | -30 | -20 | -3 | -50 | -11 | 14 | 29 | 33 |
| 1954 | 24 | -105 | -14 | 1539 | -38 | -35 | -118 | -113 | -1 | 0 | -4 | 39 |
| 1955 | 4 | -64 | -49 | 1501 | -15 | -15 | -50 | -63 | -54 | -13 | 16 | -4 |
| 1956 | -36 | -54 | -86 | 1529 | -21 | -40 | -116 | -108 | -14 | -6 | -18 | -4 |
| 1957 | -44 | -41 | -44 | 1370 | 52 | 19 | 34 | 11 | 2 | 4 | 47 | 20 |
| 1958 | 78 | 4 | 30 | 1410 | 33 | -54 | -98 | -39 | 13 | 17 | 16 | 26 |
| 1959 | 26 | -10 | 14 | 1360 | 13 | 3 | -8 | 1 | -14 | 18 | 11 | 34 |
| 1960 | 50 | -24 | -3 | 1356 | 12 | 6 | 26 | 47 | 18 | 31 | 40 | 34 |
| 1961 | 70 | -93 | 16 | -3 | 33 | -38 | -53 | -48 | -18 | -22 | -30 | 5 |
| 1962 | -15 | 17 | -22 | 8 | 34 | -33 | -5 | 5 | -36 | 0 | 42 | 45 |
| 1963 | -16 | -53 | -47 | -10 | 34 | 47 | 54 | 17 | 94 | 80 | 47 | 0 |
It seems pretty sloppy in a dataset that has supposedly been intensively scrutinized and peer reviewed by stadiums of scientists. It’s not like it took me a very long time to see this defect. I was under the impression that CRU was supposed to have quality control systems in place to pick up egregious outliers like this. It would be a good idea for some one to scrutinize the procedures and see what happened in this case.
Does this sort of error "matter"? I don’t know. The first problems that I noticed with the Mann data set were little things.
Another curiosity in this data set which may indivate a more serious type of problem: notice the episode of values in the 19th century. How on earth could the editors of this dataset purport to guarantee "homogeneity" from that data to the 20th century data with over 50 years gap in the data?


24 Comments
You’re probably aware of it, but the late John Daly was quite scathing in his comments about the quality of the ground based temperature measurements because of issues like this. Warwick Hughes has also looked into the same issue and has pointed out that a great deal of the “warming” is due to just a few stations in Siberia, again something you probably already know. Go to http://www.warwickhughes.com/climate/index.htm and scroll down. It’s remarkable how much energy has gone into criticising the satellite and radiosonde data but so little into the ground based measurements which are full of gaps and have a total lack of quality control, not to mention that the network was never designed to make a coherent global measurement over a span of one hunred years. And of course there’s the dreaded urban heat island effect that has been carefully “corrected.”
Paul,
MSU and Jones are agreeing over US and Europe. The real problem is inhomogeneity, not UHI.
What are the numbers in the table supposed to be measuring? The second plot has degrees C on the vertical axis. How does that correspond to the numbers in the table? The bolded numbers are obviously “different” from the rest, but even if they were in the same ballpark, what does a number like +90 or -118 correspond to? Are these percentage deviations from an average? If so, how do we interpret a number less than -100 for a tropical location?
Hans, I think UHI is still a problem in the US and Europe, although perhaps less of a one there than in some other places. One can look at places like Austin and Lamapassas Texas and see that the supposed correction for the Austin UHI is not sufficient. I have also seen analyses (including one by Ross McKitrick I believe) showing that the ground temperatures supposedly corrected for UHI are significantly related to socioeconomic variables. I also recall seeing a study showing that the trend termperature increase in California counties as recorded in the GISS data set is significantly positively related to county population. This again suggests that the UHi has not been adequately accounted for. Inhomogeneity is a big (perhaps bigger problem) but the UHI remains a big problem too.
With reference to my earlier comment (#3), I guess the numbers in the table are deviations from average in hundreths of a degree C? That would at least make the graph consistent with the table.
Hans,
With all due respect, how exactly does one make a correction for the UHI? No one calls the weather bureau when they put up a new building or widen a road. Even if they did, just how can the effect be modeled realistically? What do you compare to as a reference that isn’t contaminated? Large urban areas grow in all directions. How far away do you have to go?
There’s also the entire physics issue of using temperature to measure warming. 95 F with 90% humidity is very different from 95 F with 15% humidity.
Posted today on RealClimate (not yet published):
“Steve [Sherwood],
May I disagree with the conclusion? There are and were problems with all kinds of temperature records, as good as for satellite data as for radiosonde and surface data. Thus even if the satellite data now are corrected and are more in line with the expectations of the models, one need to see if the discrepancy which is left over is not based on problems with the surface data.
To give you an idea, just look at any GISS surface data series around the equator (where the largest discrepancy was found):
Look e.g. at the data for Salvador, a town of 1.5 million inhabitants. That should be compared with rural stations to correct for urban heat island effect. But the nearest rural stations are 458-542 km away from Salvador (Caetite, Caravela, Remanso). And their data are so spurious, that it is impossible to deduct any trend from them. Quixeramobin is the nearest rural station with more or less reliable data over a longer time span, and shows very different trends than Salvador. Or look at Kinshasha (what a mess!) with 1.3 million inhabitants, or Brazzaville (opposite the Congo stream), and something rural in the neighbourhood (Mouyondzi – 173 km, M’Pouya – 215 km, Djambala – 219 km,…). East Africa is not better: compare the “trends” of Nairobi with these of Narok, Makindu, Kisumu, Garissa,…
Rural data trends with some reliability on a longer time span are very rare in the whole tropics. Only fast expanding towns have (sometimes) longer data sets which are hardly correctable. The unreliability of the data in the tropic range is thus obvious, that one can wonder how a global surface temperature trend can be calculated to any accuracy…”
re# 5
I did my best in Europe by comparing Metropolitan area Brussels with more rural De Bilt and forest hilltop Fichtelberg, using real census data.
http://home.casema.nl/errenwijlens/co2/homogen.htm
The result was compared with Hohenpeissenberg and yields a coherent temperature in central Europe matching with Jones’ gridcell.
http://home.casema.nl/errenwijlens/co2/europe.htm
Hence my conclusion that UHI is not a main cause of temperature rise in Europe between 1856 and 2002.
See the Berlin and Paris stations for inhomogeniety problems on short distance.


Peter,
Estimated 0.01 C variances from 1961-1990 estimated means.
Steve,
Which CRU file are you using? (They have several.)
In the current CRUTEM2, I find 405 numbers ranging from 1000 through 1950, and 780 numbers ranging from -1000 through -3310.
A 10 C (or greater) variance of a monthly mean from a 30 year mean for that month would seem to earn the label “anomaly”, but I cannot offhand say that it is probably an error.
Steve,
I will bet you a “well I’ll be darned” that when you get a current version of the CRU file that you have been checking, those anomalous “anomalies” will still be there.
Let me add that while I do not know whether a 10 C diference of a monthly mean from a thirty year mean for that month is probably an error, I would be inclinded to guess that it would be.
When such large numbers occur in successive Aprils, while the adjacent March and May numbers are rather ordinary, I would say they probably are errors.
BTW, I will try to remember not to use the word variance as a synonym of the word difference when statisticians are in the room.
Steve, can you give the elevator speech, the executive implications, the “so what”, the ‘insert buzzword’. I know some of your posts are just things you are playing around with, but obviously this is going somewhere. Can’t you explain the concept of what you are going after or the initial implications of the findings? For instance: this study, shows how to find poor weather stations OR this is tending to show a UHI effect…or whatever. Come on.
You could even give the initial hypothesis BEFORE you test. Something like, I think there is something fishy in this aspect of that, so I’m going to check it out. But right now, I have no idea why you wouldn’t even play at what you’re playing at.
I’m not sure if I’m going oanywhere with this. The satellite data was in the news so I looked at it. The series looked like an ARMA process, so I tried an ARMA model on it. I’ve been reading an econometric paper about ARMA (1,1) processes so I tried this rather than the usual ARMA (1,0) process and the results were pretty interesting. So I tried it on the global dataset just see to what I looked like. Again the results were pretty interesting. I like to look at maximums and minimums of sets like this, so I looked at the gridcell with biggest AR1-MA1 and it turned out that the big AR1-MA1 was undoubtedly due to a quality control defect – but this sort of quality control defect isn’t supposed to occur in this dataset. Why didn’t it? I looked at other examples and I guess that I was strong by the amount of non-homogeneous data, and by the apparent presence of land-based series in ocean gridcells. The graphic pointed two ways: 1) as a quality control instrument to identify potentially flawed gridcell series that needed examination; 2) to differences in the tropical ocean ARMA(1,1) coefficients and continental coefficients. Not surprising, but what happens when you average them? It might not be obvious. I am very struck by how many zero-crossings the tropospheric series has. I’m struck by how many gridcell series that I’ve browsed through do not have the distinct Jones uptick: what’s driving the Jones data?? It’s a big job to start on. I haven’t finished writing up proxies so I’ll probably have to put gridcell temperatures on hold.
FWIW, I looked for monthly anomalies of 10 C or greater in a non-CRU gridded data set (also 5 lat by 5 lon) at:
ftp://ftp.ncdc.noaa.gov/pub/data/ghcn/v2/grid/
and found 584 ranging from 10.0 C through 20.47 C, and 925 ranging from -10.0 C through -23.87 C.
Hmmm, I’ll have to add a GHCN station monthly "anomaly" program to my to do list.
Steve: Jerry, what language do you use to process GISS data? If you don’t use R, I’d encourage you to do so. I could probably adapt my R script for CRU data to input GISS data. I have a script for satellite data from 2 years ago, which I could update and publish if there’s any demand. These scripts make a matrix in which rows are months, columns are gridcells. I organize the data big hand N to S, little hand E to W. I use the CRU table a lot (and really should update it.) Another advantage of R is that you could parameterize the station id and then use a script to download the station data and produce your own plot.This type of thing tends to be semi-automatic since station id’s are idiosyncratic, but still well worth doing. I just wrote a little script to download GISS Honolulu data, used by Benestad, and produce the autocorrelation and monthly plots.
Steve,
For the simple counts of 4 digit numbers in the two gridded data files (put down your coffee cup), I used a text editor named Kedit.
BTW, the non-CRU gridded data set seems to be by someone at NCDC, rather then GISS.
For several things I use a language called Rexx, or a variant called Kexx, in Kedit, for other things I use fortran.
For the GHCN station monthly anomaly stuff, I was thinking of using R, but decided to do it first in fortran, and then see if I could do the equivalent in R as a learning exercise.
Steve,
In which CRU file did you find the numbers in the above table?
hadcru2 (July 2003 edition). I’ll check in the update as well.
I take hadcru2 to be a typo of hadcrut2.
I downloaded that, checked for such numbers as 2476, and 1786, and they’re gone.
Better use GHCN directly, Giss truncates at 1880.
OTOH GHCN is not updated….
link:
http://cdiac.ornl.gov/ftp/ndp041/
precipitation: precip.data.Z
temperature: temp.data.Z
station list: temp.statinv
Hans,
GHCN V2 is at:
ftp://ftp.ncdc.noaa.gov/pub/data/ghcn/v2/zipd/
or
ftp://ftp.ncdc.noaa.gov/pub/data/ghcn/v2/
GISS is convenient for one station at a time, but not for large numbers of stations. There are also other considerations.
So far it seems that there are more large anomalies than I would have guessed, but not near the equator.
RE #18: In principle, there’s nothing wrong with correcting errors such as this,as the originators become aware of them. But in the mean time, there’s been usage of the CRU data set. You’d think that they’d have an audit trail with comments about the updates that they are making and errors that they’ve corrected.
One of the curiosities in the temperature data set used by Mann (an older version now archived) is that 4 gridcells with over 50% observations in the older dataset had 0 observations in the new dataset – not a word of explanation from anyone.
Using simplifying assumptions to deal with the gaps, and conflicts, in GHCN “raw” mean monthly surface station temperature data from the year 1800 through the year 2004, a program calculated 1,803 monthly anomalies of 10 C (18 F), or more, relative to estimated 1961-1990 monthly means.
1450 ranged from -10 C through -21.147 C, and 353 ranged from 10 C through 19.47 C, in data from 568 stations in 34 “countries” (GHCN lists, for example, Antarctica as a country), none of the stations being within 28 degrees latitude of the equator.
Over half, 938 instances, occurred among 358 USA stations including 16 stations in Alaska. About half of the remainder, 438 instances, occurred in 50 stations in what GHCN calls the Russian Federation Asian sector. Only six Southern Hemisphere stations made the cut with a total of 12 instances. (Of the 7280 GHCN stations, 1079 are in the Southern Hemisphere.)
The monthly distribution of the 1,803 instances is: Jan 615 Feb 604 Mar 117 Apr 20 May 3 Jun 6 Jul 8 Aug 2 Sep 2 Oct 2 Nov 117 Dec 307.
Various distributions will be skewed by the relatively large number of weather stations in the “lower 48” states of the USA that are included in GHCN.
For additional details, including caveats, see readme.txt, and other files at: http://www.john-daly.com/bigdif/
As an indication of conflicting information in historical temperature data, a tabulation of 1,922 conflicting monthly means, which differ by 4 C or more, has been added to the bigdif location mentioned above.
Here are the top 10:
Station Year Mo Meana Meanb Difference
42570231000 1950 2 -27.8 -7.8 20.0
42570231000 1979 2 -28.9 -10.9 18.0
42570261000 1956 12 -33.5 -16.6 16.9
22229263000 1939 12 -28.1 -12.1 16.0
70089664000 1982 5 -24.9 -9.4 15.5
20840706000 1972 1 -7.5 7.7 15.2
22229263000 1938 12 -28.5 -13.4 15.1
22224944000 1909 1 -41.4 -27.0 14.4
20553068000 1985 12 -21.9 -8.0 13.9
22229263000 1935 2 -27.4 -13.6 13.8
P.S. While doing this tabulation, I fixed a bug in the bigdif program which then found 1,809 monthly anomalies of 10 C or more.
Is anywhere in places such as Western Europe, the Eastern US, Japan, South Korea or within 100 miles of any of the 3rd world megacities not affected by UHI? As I see it, you’d pretty much have to be out in the middle of Nevada, in the middle of the Gobi or up in the NWT, and at least a few miles away from any small towns, in order to escape it. You’d also have to be away from the houses / outbuildings of any major dairy farms, ranches or other major rural businesses. In a place as dense as Europe, which so dramatically increased the use of central heating, electricity and other heat disipating things, since 100 years ago, there must be few places not impacted by it. So,how can one correct for it – against what basis would one correct, an also rising “rural” baseline?”. Consider also the impact of the vast expansion of pavement, in all but the most sparsely populated places. To be quite frank, I think the term UHI should be dumped, in favor of HILHD (Human Induced Local Heat Dissipation).