Many of you read Moberg. Some of you probably saw the following diagram showing the re-combination from wavelets to yield the final reconstruction. It looks like an even more complicated method than MBH98 – "science moves on".
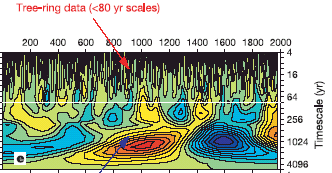
Moberg Figure 2.
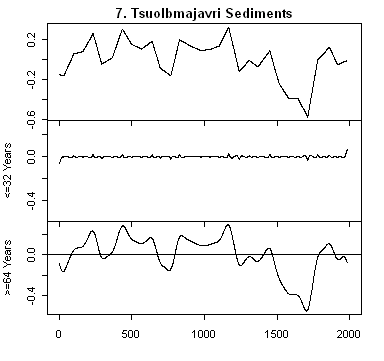
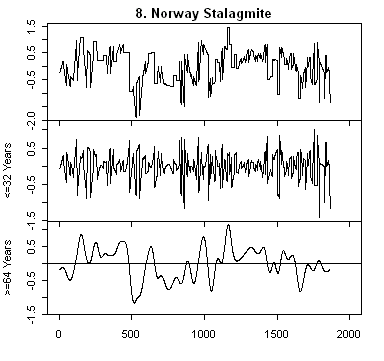
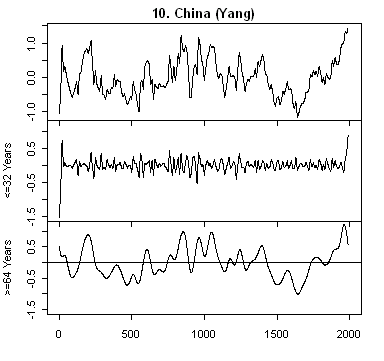
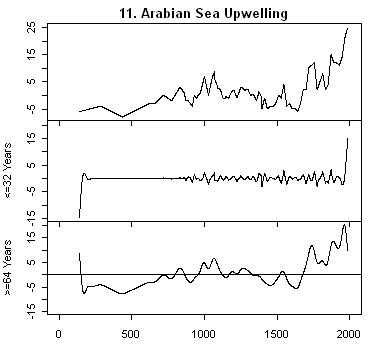
So if I offered to show you plots of the wavelet decompositions of all 11 low-frequency series used in Moberg, none of you would probably think that it would be very helpful to you to see a whole lot of diagrams looking Moberg’s Figure 2. However, I’ve plotted out the 11 series using a discrete wavelet transform, instead of a continuous wavelet transform and you’ll find the results accessible and interesting.
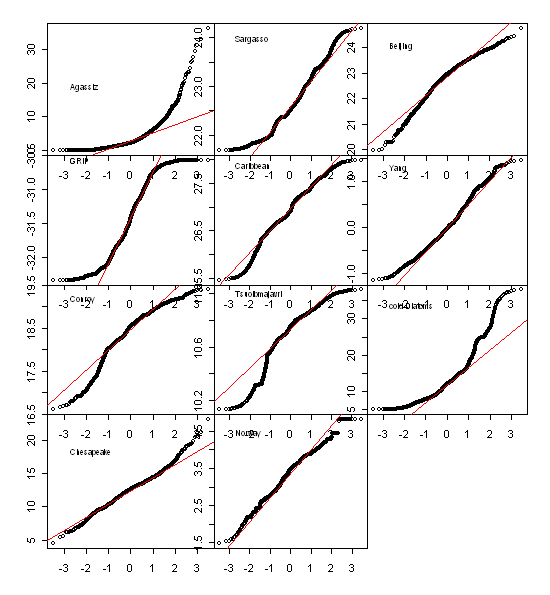
UPDATE: qqnorm plot added for the 11 low-frequency proxies.
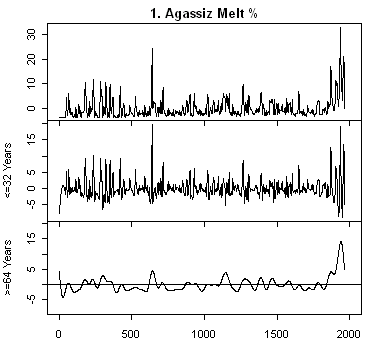
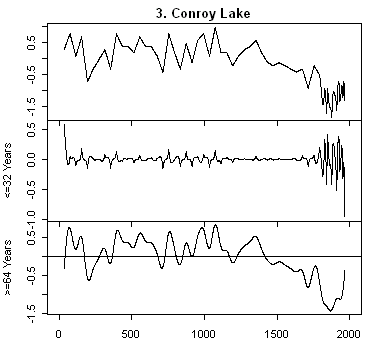
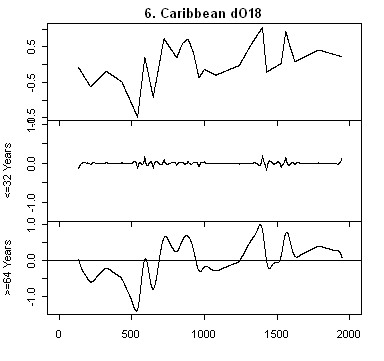
All of these series are annual series and so a discrete wavelet transform is much more in keeping with the data. Wavelet transforms represent the data on scales of 2,4,8,16,… I’ve grouped the representations into scales <=32 years and >= 64 years and plotted each representation on a common scale (intra-series not inter-series). The third panel for each series is the low-frequency scales and the one of interest here. It’s obvious, as I’ve mentioned before, that 20th century hockey-stick-ness is strongest in series #11 – Arabian Sea Upwelling see here; and secondarily by #10 Yang (which is driven by the ever-present Thompson Dunde and Guliya series) and #1 – Agassiz. As I noted before, #11 and #1 are non-linear and in % terms and need to be normalized prior to entering into a global calculation.
 |
 |
 |
 |
 |
 |
 |
 |
 |
 |
 |
UPDATE: Here is a qqnorm plot for these 11 series. Is Moberg normal? I guess not.


60 Comments
aaargh. More “so what”. take away at front and supports after. NOT story mode. Even if you’re not “done”, tell us where you’re heading, what you’re trying to examine. Is the basic point that only one of 11 series is hockeystickish, but averaging all together (or whatever amalgamation, trend extraction was done) showed a hockey stick. ANd because only one of 11 shows this feature, you doubt that it is really a fair representation of all the data?
If that’s what you mean or at least the hypothesis you are examining, well…see how easy that was to say it like I did?
Oh….and I have no idea even at a conceptual level what the discrete versus continuous or the 64 versus 32 is about or if it is valid.
Adding together scales like this you basically get a high-pass filtering (=64) filtering of the data. The exact corresponding filter is determined by the wavelet used. Note that one has to be careful about end effects since this is non-periodic data.
Apparently posting text with less-than and greater-than symbols is not good (some text also dissapeared).
My above post should have read
If that was a response to me, I don’t understand it. If a comment to Steve, ok.
Mats, Moberg doesn’t say what assumptions he used to deal with end effects. I’m feeling my way through this: do you have recommendations on an appropriate method of handling end effects given the look of the data? I used a la8 wavelet decomposition under modwt. Thanks, Steve
TCO, the usual thing that I check for in Hockey Team work is non-robustness: 10% of the salesmen make 90% of the sales. Typically, there are a couple of series in a Hockey Team reconstruction with a strong hockey stick shape and the rest are white/low red noise and cancel out, leaving a hockey stick reconstruction. But there’s lots of arm-waving and magic in between so you have to watch the pea in the thimble carefully.
The impression that I’m getting here is that series 1,10 and 11 are driving this bus. If you replaced them with (say) 3 low-frequency treeline change series – I’ve got 2 (Polar Urals, foxtails) and need a 3rd, then my guess is that you get a completely different looking series.
So then the question becomes: which is a better representation of NH low-frequency temperature: treelines at Polar Urals and foxtails or (say) % of cold-water diatoms upwelling offshore Oman and Thompson’s Dunde data (embedded in Yang), which occurs everywhere?
He padded the data at both ends.
End effects = boundry effects
As Mats pointed out, all that was done was low pass filtering of the data. Where are you getting “continuous wavelet transform”? I searched the paper and didn’t find that. It’s not even possible!
Since you now have data for all the low frequency proxies you should be able process it and compare it to the low frequency reconstruction in the supplemental. Working backwards, you should be able to subtract from the reconstruction the proxies your know are good to resolve discrepancy in the Lauritzen stalagmite series.
Thanks, Greg. I missed that. On the continuous versus discrete, I asked Brandon Whitcher about it about 6 months ago. My recollection is that the particular wavelet used in Moberg was not used in discrete wavelet transforms, but I don’t guarantee this. I can manouevre around in discrete wavelets and, as mentioned before, any robust reslts should exist in discrete wavelets. So i don’t think that anything significant turns on whether I’ve characterized his method correctly as continuous, although I think that my characterization is correct.
I’m most of the way through the reconstruction. I’ll have to re-trace my steps a bit to implement the padding.
I don’t think that the Lauritzen issue will by itself have a huge impact. I’m going to do a couple of other things, in stages. The uncalibrated series #1 and #11 need to be calibrated to temperature. I’ll see what gridcell temperatur relationships are. They are also hugely non-linear; I suspect that a plot of the histograms will be very non-normal. I’ll see what tidying these series does. Then I’ll do a substitution of a treeline series for the Oman coldwater diatoms and see what happens.
Greg, here’s what Brandon Whitcher, the author of the waveslim package and a wavelet expert, said:
Stephen, The Moeberg article uses the continuous wavelet transform (CWT), a clue is the term “Mexican Hat” in the Methods section and the term “voices” in the text. The CWT provides a highly redundant set of wavelet scales so that a contour plot makes sense. Software that people use for this purpose in atmospheric sciences is usually the “Torrence and Compo” package… probably in Matlab. You can do the same thing with the R package “Rwave” that I ported over from S-Plus. S(R)wave is from the book Carmona, Huang and Torresani (order?) about the CWT. waveslim does not provide any CWT functions, only DWT functions.
cheers…
Brandon
TCO, you see – I do actually have some ordinary correspondence. I’m quite reliant on Whitcher’s software and he’s been very cordial and helpful.
Moberg used the Mexican Hat which I haven’t seen used in signal processing. Perhaps this is what Brandon Whitcher was saying? I am just thinking out loud here. You would use a continuous function to generate the coefficients for a wavelet, but the processing of real data would still have to be discrete. I think your approaching it the same way Moberg did, I think there is just some confusion with the terminology.
POI, a wavelet is a band-pass filter.
Gee Steve! I was writing a response and you already had another one up. LOL
bleh. I still think more higher level prefaces would be useful. Although I figure you are generally trying to find faults with the papers, it is not always explicitly stated as an aim.
On topic: If they have 3 of 11 species driving the bus, then the overall effect (if fairly represented) ought to be 3/11 of the total. what you would get with an average for instance. Yeah…I know there’s geography involved as well. IF they are doing some fancy shmancy that basically makes the 3 of 11 look like 11/11, then that seems like dirty pool. (Also of course, there is the issue of whether the 3 they picked are good studies, if they excluded others that went the other way, etc. But useful to disaggregate the two types of sin.)
My main testing point for Hockey Team studies is a different nuance: I don’t think that most of the proxies are proxies for temperature; so they function as noise and there is no signal. Then if you cherrypick a couple of nonclimatic hockeysticks, you get a hockey stick shaped aggregate. I’m not saying they do this intentionally, but it’s what I think happens and it’s what I look for.
Steve,
There are some other things I noticed about the Moberg reconstruction which may be of interest to you.
He uses linear interpolation to get the data points equidistant in time. That will create aliasing and alter the frequency spectra. He could not have picked a worse method to interpolate with. It would be interesting to see how the final results would compare with different interpolation methods.
The Cronin (Chesapeake Bay) data set is really 3 data sets. Did Moberg use them as one data set or did he split them up? He should have split them up. When treated as one data set there is one glaring impossibility. There are 2 data points for 1842.88. This is a physical impossibility as the rise time between the two points would be 0 and the frequency spectra would extend to infinity.
Greg, it looks like he treated them as one data set. The Oman coldwater diatoms are 3 different series as well. I averaged the available proxies.
His continuous wavelet transform seems like a very complicated way of doing a low-pass filter; the long padding at the ends concerns me a little; the non-normality of a couple of the series is severe (especially the hockey stick shaped series). I”ve plotted up qqnorm diagrams and they’re awful. I’ll bet that the results would be different using a robust method (median)instead of a mean.
Any volunteers on finding Science in China D?
I disagree. I think they are two seperate sins (not agreeing at moment that they are guilty of either, just disaggregating the issues). One sin is to pick non-representative studies (either unrelated to climate, or in a prejudiced (CENSORED) manner to “help our case” (this can also happen unconciously)). The other possible sin is to overemphasize the relevance of hockey sticks. For instance, if I really have 3 hockey sticks and 8 others that average out to null, then (assuming they are all valid and equally wieghted) ought to be a hockey stick with 3/11 amplitude. If they use some other mumbo that overcounts the hockey stick ones and deemphasizes the nonhockey sticks, that is not fair.
So sayeth the conceptual thinker/Bizness weenie.
Steve,
A wavelet is a band-pass filter. I can’t think of a valid reason to choose a wavelet over a simple band-pass, I will have to think about it a bit. Mobergs lowest frequency wavelet is so low in frequency that, when it is fully immersed in the data, it is in effect a low-pass filter. (I doubt there is anything of any significance below it’s cutoff frequency). Padding is, in electrical engineering terms, just DC. It doesn’t have any frequency spectra. The difference between using the median and the mean should be quite small as both are effectively DC. The only difference in the frequency spectra will be due to transition point where the data ends and the padding begins.
Padding is almost never a good idea. I think the best way to illustrate this is to run the wavelet only between the points where it is fully immersed in the data. Using the same data, replace the ends with padding that equals the length of the wavelet. Do the wavelet transform again and note the difference between the padded and non-padded results as the wavelet transitions out of and into the padded data.
Steve, the Lou & Chen paper is at : http://www.earth.sinica.edu.tw/~wpes/Vol2/No2/V2n2p149.pdf and the other is, I think, at : tao.cgu.org.tw/pdf/v43p321.pdf
Google is my friend when used correctly !
Hope that helps, Ed
Ed, thanks for looking but those are in different journals. I’m looking for the ones in the journal Science in China Series D referenced in the post.
TCO, last sentence: the Mann PCA method obviously overweights hockeysticks as we’ve discussed. But the Jacoby cherrypicking method is just as effective: he picked the 10 “most temperature sensitive sites” of 36 and then didn’t archive the other 26. I’ve done red noise experiments to replicate picking 10 of 36 red noise series – what happens is that if you pick based on hockey-stick-ness, you reinforce the hockey stick and then the noise cancels in the shaft. The Jacoby hockey stick is absolutley median relative to red noise cherrypicking.
You get cherrypicking by Briffa too just not articulated. It’s been reported that there’s a downturn in ring width after 1960 across hunderds of sites. But the Yamal site has a big upturn: guess which one gets into the newer multiproxy studies.
Greg, It’s not as though Moberg uses he different scales. He could have just put a spline or lowess and smoothed without padding as well.
I’ve added qqnorm plots for these 11 series.
Greg,
what wavelets provide compared to band pass filtering is localization, i.e. in a scalogram as the one on top of this page you can easily localize features at different times on different scales (such as a max in the 2048 scale around year 1000). An alternative could be to use a windowed Fourier transform. But if the purpose is only to separate high- and low- frequencies I see no reason to use a wavelet transform instead of a pair of high/low-pass filters (other than producing a pretty picture).
Steve,
regarding end effects: This is a problem for wavelet transforms as it also is when doing traditional Fourier analysis of non-periodic data. The effects of the boundaries, and how they are treated, will spread into the scalogram a length that corresponds to the length of the wavelet at a certain scale. A short distance in the high frequency part and longer as one goes to lower frequency scales, so all of the lowest frequency scales (bottom part in the scalogram above) will be affected by how the boundaries are handled.
As in the Fourier case, there are many ways to handle this, one can use padding by a constant (or higer order polynomial extrapolation), or one can simply mirror the time serie to make it periodic (append a time reversed copy to the end of the serie). I would say that none of these remedies are good. There also are wavelet transforms that are constructed to be used on intervals, but I do not think that there is any perfect way to handle boundaries. It is simply an inherent problem of trying to determine frequency content close to the ends of a signal, a bit like extrapolating data.
For your task at hand, maybe it does not matter what was done in detail in the original paper. If you separate the signal into a high and a low frequency component with a 32 or 64 year cutoff you should get similar results as in the paper, otherwise the result is not robust.
Greg,
regarding #15. Interpolation is not needed. If one is using a CWT (Mexican hat in this case) there is no need to have equispaced data points. Each point in the scalogram is an integral of the signal times the wavelet, and one can evaluate the wavelet at the data points. Then one needs to compute the integral of a function (wavelet times data value) on a set of irregularly spaced points and one way to do this is to make a linear interpolation to approximate the integral. Maybe that is what was done? I don’t have access to the paper right now to check.
Steve (or anyone)
How is it decided that any proxy is a temperature proxy? Is it done using modern temperature data and proxy characterisitics? If so, why is there a doubt about their validity (other than the problem with tree rings and CO2 fertilisation)?
Re #15
Mats,
The linear interpolation, from my reading, was done prior to the wavelet transform. Linear interpolation is mentioned twice (both in the methods section) in the paper:
Correct me if I am wrong. By the method you propose, one would calculate the wavelet coefficient for each data point from the continuous wavelet function. Sounds good to me.
Re #25: Paul, in my opinion, there’s a lot of arm-waving through showing that various series are proxies for temperature (rather than precipitation or something else.) For tree rings, it’s not just CO2 that’s at issue. In the Mann AD1400 network of 70 tree ring sites,I checked the correlation to gridcell temperature and found that the average correlation was minus 0.08!, with a positive average correlatino to precipitation of 0.29(from memory) and a bimodal distribution in correlation to CO2 levels with the bristlecones having correlation >0.4.
Or dO18 anomalies from tropical ice cores. On a global basis, higher dO18 values in precipitation are associated with precipitation in warmer regions. This is attribute to a “rain-out” effect. There is a really big problem with tropical ice cores which took the promoters (Thompson) initially by surprise. The most negative values of dO18 occur in the warmest (summer) period because the precipitation comes from monsoon rainout originating in the China Sea (Himalayas) or Atlantic – not Pacific(Andes). Winter precipitation appears to have more local sources and a much higher dO18 values. Thus seasonally, the signature is the reverse of what it is “supposed” to be. If you had an increase in summer precipitation, it would appear as a decrease in dO18 levels and decreased “temperature” in Thompson’s world. There is a slight trend in Dunde dO18 levels in the 20th century. My impression is that Thompson’s calculations of statistical significance are beyond horrendous – it was on my mind before, but I forgot to do a note on it. Remind me if I don’t do it in a few weeks. So there’s a lot of hair on these tropical ice cores.
A huge problem with tree rings, additional to CO2 and precipitation, is that trees are nonlinear in response. The real problem is not just nonlinearity but nonmonotonic – see my note on TTHH.
Sometimes the multiproxy people just seem to drop series out of the blue – for example Mann uses a dC13 coral series from Aqaba.
The other problem is cherrypicking. For example, the majority of conifer sites show a late 20th century decline in ring width, whereas it is believed that there has been an increase in tempreature. (Kullman in Sweden, confronted with this paradox, wonders whether the 20th century ring widths aren’s suggesting that maybe the temperature increases aren’t as big as people think.) So Briffa and his ilk sift through hundreds of series and find some with 20th century increases e.g. Yamal, Sol Dav (Mongolia) and state that these sites are temperature responsive, whereas sites not showing an increase are “not temperature responsive” and so they adopt certain sites, which then become stereotyped in the multiproxy literature.
I think that the stereoptyping is a big big issue: the multiproxy guys say that they can get hockeysticks using different methods and different series. But what if it is the very few stereotyped series that are “doing the work” in yielding the hockey-stick-ness of the 20th century vs the MWP? For example, if bristlecones, Polar Urals and Dunde are flawed, (and now Oman coldwater diatoms) then there’s a very narrow and vulnerable foundation for the Hockey Team multiproxy edifice.
Re #23, Mats, thanks for the thought. I’m pretty much ready to do some sensitivity analysis work e.g. simply doing a low-pass/high-pass filter along the suggested lines (which was on my mind as well). I wrote Brandon Whitcher and he said that one of the assumptions of wavelet (and Fourier analysis) is that the underlying phenomena are periodic and there is a program option to reflect at the boundary. It would be interesting to see if this “matters”. I won’t be able to do this for a couple of days, as I’ve got to do some other stuff today.
Re #26
Greg,
yes that is what I meant. By doing an interpolation before computing the wavelet transform one is introducing an unnecessary error.
RE 27: This is a serious, important to look at in detail, issue. To really address this, you need to do a comprehensive review of the literature, get an overarching view of the field, think about how to (legitimately) select or deselect component series of the meta-analysis. In other words, an expansive review. Not more kvetching at individual series included or not included (when you do that, I have no means to tell if you are cherry-picking in your sniping). This would be a very meaningful contribution to the field for three reasons:
1. maybe produce a best reconstruction.
2. better show the limits of a reconstruction (how much CAN we know?)
3. improve the methods of people working in the field.
Note that if you do such work and it supports the AGW shtick, you need to publish it anyway. This should not be about winning some liberal/conservative fight. It should be about learning.
It could be as simple as:
1. There are 300 conceiveable series that could be included.
2. Mann picked only 150.
3. Including all 300 gives you a different answer.
You should do the examination of different cases of series selection using a standard (not accentric PC) method of data compilation. Disaggregate the damn issues. Also, examination of cherrypicking (in essences subtle fraud) within studies needs to be kept as a seperate issue.
I would think that some of the statistical methods and the philosophy of meta-analysis from the social science would be useful in this overall review.
TCO, I don’t really care about liberal/conservative stuff, despite what people think. My own personal politics are certainly not conservative in American terms. I don’t personally worry very much about policy issues on this – I figure that there are lots of people who do, so I don’t need to bother. I am interested in the science of this. I’m also interested in what you might call the sociology of promotions and market fevers. I liked reading about Bre-X and Enron and why things go out of equilibrium.
It’s obvious that I have a certain amount of determination, but it’s not from a political commitment. It’s more from being a squash player. We play the points out. While some people here think that MBH is a dead issue, lots of people think that Mann’s won the point with his realclimate responses. It baffles me.
I’m wary of big picture stuff, especially given my limited history in this field.
I also believe in details. Some of the picking at individual series may seem like picking at scabs, but there’s often an interesting abstract issue in why an individual series doesn’t work. Plus if I were to appraise my own set of skills objectively, my best skill probably lies in finding odd things in large datasets. It’s not a particularly highbrow skill, but not everyone has it either.
1. You fluffy liberal! 😉
2. Well publish the damn Tasmanian hair/bimodalism stuff then. Even without an understanding of the implications, it is an interesting result and will prompt thinking in the field. And show that you are interested in science/discovery (not just winning the battle of pinning Mann’s wings back).
3. Understand your comments on detail digging in. And that is fine, I guess if it’s what you enjoy. Very sound reason. However, for an outsider, it still leaves the issue of how do I know that he’s not just finding faults in the studies preferentially (maybe they all are “somewhat” crappy). I think here you verge into the philosophy (examaniation of quality fo series and decisions on inclusion) as well as the statistics of compiling meta-analysis. My impression has always been that the meta-analysis combines a bunch of studies (which may have some assorted crappiness) to get an overall answer that is (hopefully) closer to the truth than a single survey. If you think the “stickers” are cherry-picking, how can you really go after this without having some global view of the field as well as some view on prpper methodology of meta-analysis. Just finding fault selectively with individual series is unlikely to prove/disprove your hypothesis.
4. I like thinking about philosophy of science and pushing for truth vice tendentiousness (comes from Rickover training). The Enron thing killed me as I worked for the firm that did a lot of touting of them and advised them on the asset-lite stuff. And I actually had told people (before the crash) that there were things that I didn’t understand about the business model. Places where people were using long words, but not communicating real insights or not thinking through value-creation versus risk reduction versus risk movement.
TCO, Have you read Kurt Eichenwald’s book on Enron. It’s a terrific read. The Barton Committee gets mentioned. I’m always suspicious of people who use inflated language to describe simple stuff – that wsa one thing that bothered me about Mann from the outset. Also the arm-waving through the details e.g. how the proxies were selected.
I’m really trying to understand issues of how to study relationships between autocorrelated processes in a fundamental statistical sense – something that no one in climate science even bothers with as far as I can tell. However the literature is hard and I’m learning material from scratch so it’s slow going for me. As soon as I scratch the surface in this, there are hard issues in stochastic processes that I think are important, but are even harder mathematically.
I’m working on an abstract for a presentation at the 2005 AGU meeting, where I’ll expand the scope of this stuff a little.
No…but like I said…the whole thing kills me, since I worked with some of the smoke and mirrors developers (and I think they actually didn’t think through the smoke and mirrors…lot of these same guys spun dotcom stories too…it’s a mindset thing.)
A couple of points in the Enron story intrigued me – the fantastic belligerence of Andrew Fastow, a late 30s hotshot, when people started to question him. Remind you of anyone?
Also that no one understood what they actually did. Nobody understood how MBH98 worked either.
Also the incredible lack of due diligence of the senior management of Enron for new projects. Money was rolling in. So someone presented a project in India – Lay wanted a project in India, it felt good so into it they went. One terrible investment after another. I don;t think it was the crooked limited partnerships per se that did them in; it was borrowing money for lousy investments. The link to the crooked partnerships was that, if they showed a loss, they wouldn’t be able to raise more money and the wheels would fall off. So they dumped assets into fictitious limited partnerships to avoid writeoffs. But if all the limited partnerships were made good, they still only would have lasted a few weeks longer.
Yup. Actually that sort of response is very common. I think Skilling got a bit of grilling from one of the analysts at a conf call, months before the crash, about their debt (or something) and he got all huffy and called the guy an idiot. Who was the real idiot? You even saw this with LTCM where some master’s degree student at a road show confronted a Nobel-prizing winning LTCM booster about the validity of the business model, about whether there was enough market innefficiency to make LTCM’s plans work. The Nobel prize winner said ‘yes, there is inefficiency because of people like you’. Well…we all know how that turned out: Score 1 for the market-efficiency-believing masters degree student. Score 0 for the huffy Nobel prize winner.
Off topic here, though the Enron discussion is interesting, I do not want to go nuclear or anything, but another possible explanation for the unusual growth of bristlecone pines and other species at locations other than White Mountains is: atmospheric nuclear tests. It’s pretty amazing to see that between 1945 and 1963 the US alone detonated 215 nuclear devices in the atmosphere (not all these were in Nevada). The cloud formed by these explosions often had a diameter of 100 miles or more. So here’s more dust etc. I have read a suggestion that the global cooling trend from the 40s to the 70s could have been partly due to these clouds. Also, the Soviet Union detonated 219 nuclear weapons in the atmosphere between 1949 and 1962. I don’t know whether any tree ring growth could have been affected by these clouds (polar urals?) Here is a table of the data. There were also 21 UK atmospheric tests and 50 by the French.
http://www.nrdc.org/nuclear/nudb/datab15.asp
Mats,
Since you don’t have access to the paper here is the boiled down version of the method.
1) Linear interpolation to annual resolution (for proxies where needed)2) Determine the mean for each proxy set3) Subtract mean from each sample4) Divide each sample by standard deviation5) Wavelet transform of each proxy series into 22 voices6) Average the wavelet voices from different the proxy seriesa. Tree rings provide voices 1-9(greater then 80 yr)b. Low resolution proxies provide voices 10-22 (lesser then 80 yr)7) Combine the averaged 22 voices to create a new frequency - time series8) Inverse wavelet transform to generate temperature vs. time history9) Rescale (adjusting its variance and mean value to be the same as in the instrumental data in the overlapping period AD 1856--1979)What is the justification for all the data fiddling? For all the musical terms. Why not just do a linear regression?
Re #39
Greg,
I now have a copy of the paper, but thanks for the good summary. It looks like the same thing could be done using ordinary Fourier transforms and a low/hig-pass filter.
Aaargh. Translate the damn filter crap talk. Step not one step back, but 2. What are we doing that is different from (and justified to be different from) just doing a multiple correlation analysis?
And also please explain what the darn colored graph does in the text. It looks cool, but I have no idea what it means, what features to look at, the axes, etc.
I don’t think that colored wavelet graphs are very helpful. Essentially it is a series of medium-pass filters – blue is cool and red is warm. Since they are only interested in low-freq and high-freq, the various scales or voices don’t appear to me to have been used to do anything. A low-pass filter is just a smooth and high-pass is the delta from the smooth/
The horizontal scale is chronologicial time and the vertical one is the filter? And is the filter just a running average (like on stock price charts)? And if so, how can the 4000 years on y axis show such good features (not average everything)?
Frequency.
nonresponsive
What is nonresponsive TCO?
I’ve posted up pdfs for some multiproxy studies in right sidebar and will add urls.
TCO (re#42) There is an online wavelet plotting page at:
http://paos.colorado.edu/research/wavelets/
-Choose “Interactive wavelet plot”
Then click on one of the Icons at the bottom of the page that appears, to get a dataset plotted.
Try the different pre-loaded datasets and hopefully the plot (above) will become easier to look at.
Thanks Chas…that actually helps a little.
Greg, your response was. Even within the quoted remark of mine that was included with yours, I refer to two axes. You have a one word response. Not clear if it is a correction or which axis it refers to. BACK UP!
Hi
May we now more about the method of Moberg. As well, what kind of discrete wavelet did you use. I mean, which mother wavelet did you use ? I do not tkink it will change drastically the results, but however…
regards
rodrigo
GregF, wavelets are not necessarily bandpass filters. The wavelets I studied for my MS thesis were actually akin to quadrature mirror filters, i.e. high/lowpass pairs. Each stage of a decomposition took the lowpass side and filtered with another pair. The result was a bank of successive high pass outputs and a final high/lowpass pair.
Either way, I’m unsure how one would go about implementing a true CWT using discrete data.
Mark
Re #51: Rodrigo, sorry I missed your inquiry. I did these charts with an LA8 wavelet. I just did them to see what they looked like. There are some obvious end effects that would need to be dealt with and if I return to the topic in a more complete way, I’ll look at this.
Re #52: Rasmus at realclimate misquoted and slagged me in respect to my use of discrete wavelets here. He said that I claimed that discrete wavelets “should” be used because the data is annual, a claim which he said made no sense. I obviously didn’t say that there was any obligation to use discrete wavelets; on the other hand, I find the information about the proxies in the discrete graphs above to be more helpful than the CWT wavelet diagram illustrated in Moberg. I don’t see anything wrong with that.
Those guys are so frigging touchy, that they are gunning for you even when you are just trying out analyses. Don’t pay any attention to that and keep trying things.
My guess is that a CWT requires some sort of curve fitting to the original data to generate an equation describing the set. Then a CWT can be performed… but wouldn’t that introduce some large errors in the first place?
Mark
This is what Rasmus reacted to.
#56. I think that there’s a distinction to be drawn between my phrasing that it’s "much more in keeping with the data" than saying that a discrete wavelet transform "should" be used. The basis for that opinion is just that the plots here are more informative (to me anyway) than the continuous wavelet. I dislike methods that appear to produce thousands of data points as implied by each color of a CWT diagram when you’re starting with a series with a few hundred data points only. But this is hardly a central point for me. I didn’t articulate that in this post, since I was more interested in showing what Moberg series looked like under a DWT. I don’t believe that any rational person would argue that these graphs are not more informative than anything that you’ve seen elsewhere on this data set. But the context in which this arose is even more illuminating. Look at how Rasmus presents this over at realclimate: A poster pointed out that I’d said of VZ shown with Rasmus reply):
Rasmus does not rebut the actual point. Instead of dealing with whether VZ had analyzed the impact on MBH, Rasmus picks at a tangential point buried halfway down in one of over 300 posts here. Then he brings up a paper that I had nothing to do with. All too typical.
Yes Rasmus’s remark is an aside. I have had to correct you for some asides and such as well, Steve.
Anyway, at least you understand where he got the grist for the remark from now. I will spare you from a contracts lawyer discussion of should, must, may, shall, will and the like. 😉
My comment was an “aside” in the sense that I was making a substantive point and said something in passing. Rasmus’ point was not an “aside”, but a diversion and about 2 other logical fallacies.
1. Yes. He’s worse then you. What do you want? A prize?
2. You divert occasionally.
One Trackback
[…] Update: Here are qqnorm plots for Moberg previously posted up here […]