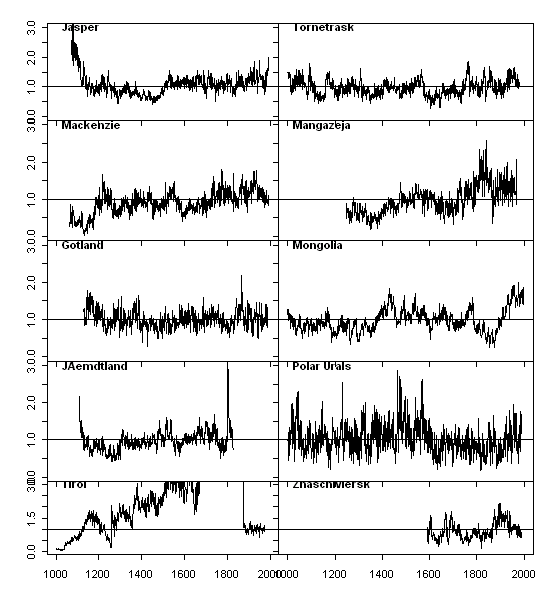
I’m inching along with Esper. Here I plot up 10 of 14 sites – I’m pretty sure that most will correspond fairly closely to Esper versions (up to the undefined distinction between “linear” and “nonlinear” cores). For 20th century levels to exceed 11th century levels, the “active ingredients” in Esper seem to be the 2 foxtail (~bristlecone) sites and Jacoby’s Mongolia series.
I think that (and it’s only an assumption) that I’ve correctly identified WDCP locations for 10of 14 sites. I cannot locate WDCP archives for two Graumlich foxtail sites, Payette’s Quebec site and Taymir, but have seen plots of all 4. Only the two foxtail sites contribute to the 11th-20th difference.
Esper does not explain why these 14 sites were chosen out of the hundreds of sites. Not all of them are long and not all of them even go into the 20th century. It’s a very odd selection. Speaking of which: why two foxtail sites? These sites come from a few miles of one another.
The figure below shows my ring width RCS chronologies calculations for these 10 sites. (RCS chronologies are a very simple calculation and I’ve benchmarked my methodology against some of the limited information – see my Gotland posts.)

The only series here which have values in both the 11th century and the 20th century are: Polar Urals, Tornetrask, Jasper (2nd half 11th), Sol Dav (Mongolia), and Tirol. Unavailable are the two Graumlich foxtail sites – Boreal Plateau and Upper Wright. Based on the illustration in Bunn et al [2005], these two foxtail sites have hockey stick shapes (surprise, surprise). So, for the purposes of a comparison between the 11th and 20th centuries, we are dealing with very similar information to MBH99, Jones et al [1998] and Mann and Jones [2003].
Esper only uses a portion of the Tirol data. If he’s used swit177w (a very large dataset with >100,000 ring width measurements) then it’s been edited.
Tornetrask and Polar Urals are both RW here, while the Briffa reconstructions generally used are based on MXD (with the Tornetrask version being “adjusted”).Using this RCS version, the early 11th century at the Polar Urals is warmer than the 20th century (which may be one reason why Briffa used the MXD version) – although I don’t think that there are any valid first half Polar Urals chronologies from this data set.
The early low part of the Mackenzie (Campbell Dolomite) site consists of one tree; Esper does not use this series until the 13th century.
The new Jasper reconstruction of Luckman and Wilson [2005] has measurements not in this dataset; their reconstruction is based on MXD with a partial contribution from RW; however, they use RCS only on the MXD dataset and use a “conventional” method for their RW chronology.
Again, on a preliminary basis, it looks like the “active ingredients” for Esper are Jacoby’s Mongolia series and the foxtails (~bristlecones). Obviously the bristlecones are in an arid environment as well as a cold environment, which certainly adds to the difficulties in extracting a temperature “signal” from them. I haven’t seen very much on the ecology of the Mongolia series (this is Jacoby after all) – but last time I looked, the Gobi Desert was in Mongolia and I suspect that both cold and dry might be issues in the Mongolia highlands, just as they are in the bristlecones.
I’ll update or amend this as more Esper information dribbles in. I’ll try again with Science and see how they are coming along.


4 Comments
1. To what extent does moisture change and are the changes correlated with temp or not? (I know that this is a huge question, but just was wondering, how to start thinking about it.) Is there a “moisture version” of the CRU dataset for instance? Wondering if magnitudes of changes are typically smaller/larger on a centenial climate scale if they typically counteract or enhance temp effects.
2. What about variation of temp itself? Is it pretty autocorrelated? Are the centenial scale changes the result of luck (i.e. buncha bad years) or an effect showing a change in the system? (And how does one properly describe and evaluate the concept that I’m manhandling here)?
There are gridcell precipitation series. I don’t know anything about these datasets. Precipitation is much more irregular than temperature.
Ocean temperatures look like they are more autocorrelated than NH continental temperatures; look at my ARMA postings for some coefficients using ARMA(1,1).
Some of Mandelbrot’s fractal work was influenced by climate series – he talked about the Joseph Effect and the Noah Effect. Mandelbrot thought that the persistence was much greater than ARMA and on all scales with peculiar properties.
MAndelbrot actually studied some tree ring series and some varved sediments.
Re 1. See:
http://www.lse.co.uk/ShowStory.asp?story=EC2117823W&news_headline=2003_heatwave_may_have_sped_up_global_warming
It seems like tree ring correlation with btemperature gets very prolematic, or maybe trees behave differently in the 21st century. Murray
I think we know that there are potential nonlinearities and confounding factors. Next issue is to characterize them.