I’ve talked recently about the phenomenon of cherry picking tree ring chronologies with upticks in the small-subset (10-20) compilations used in typical Hockey Team multiproxy studies (e.g. Jones et al 1998; Crowley and Lowery 2000, etc., most recently Osborn and Briffa, 2006; and to a slight lesser extent D’Arrigo et al, 2006 (where there was a discipline resulting from the need to report their own extensive fieldwork.) I’ve referred in passing to evidence that there has been a large-scale decline in density and ring width over hundreds of sites and it might be useful to do a quick survey of this evidence – which comes ironically mainly from Briffa himself. Given that there has been an overall decline in both measures for a population of over 300 sites supposedly chosen for temperature sensitivity, what are the chances of picking (by chance) the Yamal, Mongolia, bristlecone and foxtail series – all with strong growth. None.
Also see posts 529, 570 and 586.
First, here is an important figure from Briffa et al. [Proc Roy Soc 1998] showing the relative decline of MXD and RW relative to temperatures since 1960. (Briffa has published much more on MXD (density) series than on RW (ring width) series – so watch below for the difference. )

Briffa et al. 1998 Original Caption. Figure 6. Twenty-year smoothed plots of averaged ring-width (dashed) and tree-ring density (thin solid line), averaged across all sites in Figure 1, and shown as standardized anomalies from a common base (1881-1940), and compared with equivalent-area averages of mean April-September temperature anomalies (thick line). [SM – it looks to me like the labels in the caption are reversed between desnity and temperature]
In the same year, Briffa et al [Nature 391, 1998] reported that the phenomenon was regional, showing two graphics to illustrate the effect for 314 sites. Here is an interesting graphic showing the geographical distribution of the effect – and that the declines in both MXD and RW were in northerly sites, with increased growth characteristic of more southerly sites (which would presumably be more affected by precipitaiton although this is not discussed in the article.)
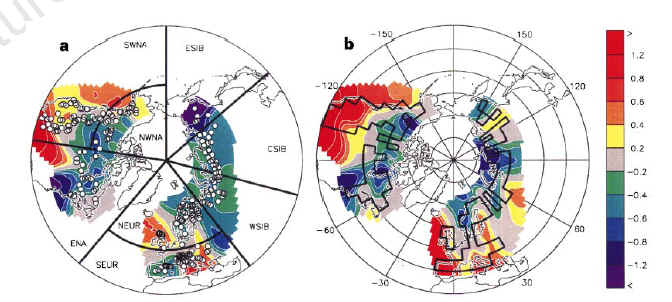
Briffa et al 1998 Caption: Figure 1 Spatial patterns of relative tree-growth decline. a, The location (circles) of tree-ring chronologies and the division (black lines) into regional averages. b, The locations (black lines) of the grid-box temperatures used for comparison with the tree growth series. The coloured contours show where the ring density (a) and ring width (b) are enhanced (positive) or suppressed (negative) relative to summer temperature during the period 1975-85 compared to the period 1935-45. Values are dimensionless, being the change in the difference of two normalized time series in each grid box. Definition of regions and number of sites: southwestern (SWNA, 53 sites), northwestern (NWNA, 30) and eastern (ENA, 34) North America; northern (NEUR, 46) and southern (SEUR, 72) Europe; western (WSIB, 42), central (CSIB, 31) and eastern (ESIB, 6) Siberia; all 125 sites in SWNA and SEUR form the composite region SOUTH, and all 189 sites in the six northern regions form the NORTH region; ALL is an average of all 314 sites.
Briffa et al [Nature 391 1998] summarized the situation as follows, showing a figure with a comparison by region:
During the second half of the twentieth century, the decadal-scale trends in wood density and summer temperatures have increasingly diverged as wood density has progressively fallen. The cause of this increasing insensitivity of wood density to temperature changes is not known, but if it is not taken into account in dendroclimatic reconstructions, past temperatures could be overestimated… In the areas where the growth data extend through to the warm late 1980s and early 1990s (NEUR, WSIB, CSIB, ESIB), the divergence is at a maximum in the most recent years. Over the hemisphere, the divergence between tree growth and mean summer temperatures began perhaps as early as the 1930s; became clearly recognisable, particularly in the north, after 1960; and has continued to increase up until the end of the common record at around 1990.
After these 1998 articles, you don’t see much further discussion by Briffa of the RW decline; but the MXD decline is illustrated a few more times and discussed up to the present. Briffa [QSR 2000] shows on an annual basis, the decline in average MXD up to the 1990s.
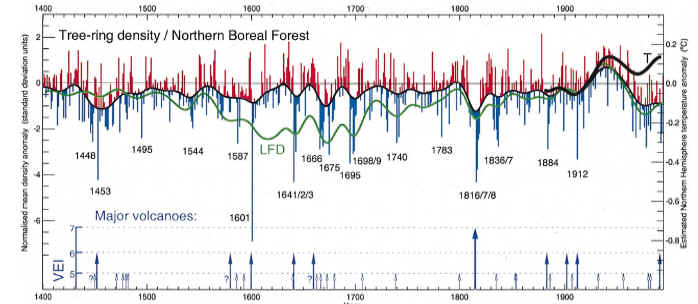
Briffa [2000[ Original Caption. Fig. 5. An indication of growing season temperature changes across the whole of the northern boreal forest. The histogram indicates yearly averages of maximum ring density at nearly 400 sites around the globe, with the upper curve highlighting multidecadal temperature changes. Extreme low density values frequently coincide with the occurrence of large explosive volcanic eruptions, i.e. large values of the Volcanic Explosivity Index (VEI) shown here as arrows (see Briffa et al., 1998a). The LFD curve indicates low-frequency density changes produced by processing the original data in a manner designed to preserve long-timescale temperature signals (Briffa et al., 1998c). Note the recent disparity in density and measured temperatures (¹) discussed in Briffa et al., 1998a, 1999b). Note that the right hand axis scale refers only to the high-frequency density data.
If you’re worried that the Hockey Team might have “moved on”, here’s a graphic from the more recent Briffa et al. [2004] showing the relative MXD decline (but not this time, the RW decline).
The Briffa et al MXD reconstruction is canonical in Hockey Team spaghetti graphs and was used in IPCC TAR. I’ve pointed out that IPCC TAR used a version which was truncated in 1960, rather than showing the post-1960 decline. I posted on this in May here and here showing how the IPCC truncation was imperceptible without a blow-up.

Shortly after I posted on this, the matter was discussed at Wikipedia here, where they seemed to think that Briffa had adequately justified the truncation. However, IPCC cited Briffa [QSR] where there is no truncation. The first occurrence of the truncation was in Briffa et al [JGR 2001] (not cited by IPCC), where the truncation is done in Plate 3 (as can be prroven in the subsequently archived digital version). HOwever, I have been unable to find ANY mention or justification of the truncation in Briffa et al [2001] itself.
THEORIES
Needless to say, Briffa has attempted to explain this widespread decline – a seemingly difficult project given the Hockey Team commitment to the existence of a linear relationship between tree ring indexes and temperature. The first articles in 1998 merely noted the problem and didn’t make a serious attempt to explain the problem, observing [Prox Roy Soc 1998] only:
It is salient to note that relative tree-ring width, and basal area increment, also show a relative decline and divergence from the temperature curve(s), arguing against the decline in density being a compensation reaction to increasing ring growth (as is seen in forestry soil fertilizing experiments). I would imagine that higher temperatures, and possibly some increasing sensitivity to lower summer soil moisture are involved, but some additional growth-limiting factor must also be implicated. Higher CO2 would be expected to increase basal area growth, so I consider it unlikely that this is the factor.
Briffa’s big worry was that the decline could cause prior reconstructions to have high values, arguing that the late decline should be excluded in calibration. They seemingly ignoring the elephant in the room: whether these proxies can pick up warm climates at all. Briffa[ et al 1998:
in the context of long-term (multicentury and above) dendroclimatic reconstruction, this partial non-climatic enhancement of twentieth-century tree growth, particularly if it acts in tandem with temperature forcing, will bias the coefficients in any regression-based equation estimating tree growth as a function of recent measured temperatures. Hence, the magnitude of modern warming might be overestimated in the context of earlier reconstructed variability.
Again in 1998 [Nature]:
The reason for this increasingly apparent and widespread phenomenon is not known but any one, or a combination, of several factors might be involved.The common use of least-squares regression for developing dendroclimatic transfer function equations to estimate past climates, imposes an equality of means in both the predictand and predictor time series over the fitting or “‘œcalibration’ period10. Any bias in mean tree growth will, therefore, be “‘corrected’ during calibration, with the consequence that the derived regression coefficients will be biased. Our results imply that this might increasingly result in systematic overestimation of past temperatures, particularly in regions where the loss of low-frequency temperature sensitivity in tree growth is greatest (eastern Siberia and eastern North America: see Fig. 1),
In JGR 2001, although there is no mention of the post-1960 truncation, once you realize that this was done, you can see a faint allusion here (although that wouldn’t by itself give you any clue as to the truncation):
Calibration of all reconstructions against the same target series and over the same calibration period (1881-1960) reduces the potential differences due to calibraiton issues, though we acknowledge that the selected region and season may not be optimal for all reconstructions.
Briffa et al [2002] report as follows on the problem and give what, in my opinion, is one of the most bizarre explanations – even by Hockey Team standards. In fact, I’m pretty sure that it was after reading this, that I wrote to Mann in April 2003 asking for his data:
Briffa et al. (1998b) discuss various causes for this decline in tree growth parameters, and Vaganov et al. (1999) suggest a role for increasing winter snowfall. We have considered the latter mechanism in the earlier section on chronology climate signals, but it appears likely to be limited to a small part of northern Siberia. In the absence of a substantiated explanation for the decline, we make the assumption that it is likely to be a response to some kind of recent anthropogenic forcing. On the basis of this assumption, the pre-twentieth century part of the reconstructions can be considered to be free from similar events and thus accurately represent past temperature variability.
Talk about the ultimate deus ex machina. Again, have they moved on? Briffa et al 2004 reuminate that the recent decline might be caused by ozone, but far well short of providing any proof. They say:
The network was built over many years from trees selected to maximise their sensitivity to changing temperature…. However, in many tree-ring chronologies, we do not observe the expected rate of ring density increases that would be compatible with observed late 20th century warming. This changing climate sensitivity may be the result of other environmental factors that have, since the 1950s, increasingly acted to reduce tree-ring density below the level expected on the basis of summer temperature changes. This prevents us from claiming unprecedented hemispheric warming during recent decades on the basis of these tree-ring density data alone. Here we show very preliminary results of an investigation of the links between recent changes in MXD and ozone (the latter assumed to be associated with the incidence of UV radiation at the ground). For the time being, we circumvent this problem by restricting the calibration of the density data to the period before 1960.
This ostrich-in-the-sand policy continues right through to Osborn et al [submitted 2005] (available on the internet) which says:
A number of factors were taken into account when selecting the most appropriate periods for calibration and verification of the gridded density data against observed temperatures. The most important factor is the identification by Briffa et al. (1998a) of a recent downward trend in the high latitude tree-ring density data, relative to (and apparently unrelated to) warm-season temperature. This density decline becomes large enough to impair the calibration after about 1960. For this reason, both Briffa et al. (2001) and Briffa et al. (2002a) used only pre-1961 data for calibration of their subcontinental, regional temperature reconstructions. This is a reasonable choice, provided that it is explicitly stated that this approach assumes the apparent recent density decline is due to some anthropogenic factor and that similar behaviour is assumed, therefore, not to have occurred earlier in the reconstruction period – which would otherwise introduce bias in the reconstructed temperatures. At present, no satisfactory explanation of the relative MXD decline has been identified, and further work must dictate whether this assumption will be supported or rejected (Briffa et al., 1998a, 2003, and Vaganov et al., 1999, discuss and investigate possible causes).
Again in their summary, Osborn et al say:
The second key issue that arose during the calibration procedure is more specific to the treering density data set used here, because it relates to the decline (relative to that expected on the basis of observed summer temperatures) in density over recent decades at the high latitudes (Briffa et al., 1998). It is extremely important to try to identify the cause of this decline, though investigations are currently hampered by the early sampling of many of the sites and thus the lack of widespread data since the mid-1980s (Briffa et al., 2003). Without a satisfactory explanation, we make the untested assumption that the decline is due to an anthropogenic factor that did not occur earlier in the reconstruction period. Nevertheless, additional uncertainty must surely be associated with the reconstructions because of this assumption, particularly for earlier warm periods. The decline also complicates the reconstruction method. To prevent it from unduly influencing the calibration, the grid-box calibration was first undertaken using high-pass filtered data (the decline was removed by the filtering). The tree-ring density data were also adjusted, in an artificial way, to temporarily remove the decline; this made only a small difference in comparison with the filtered calibration, although it reduced the sensitivity of the reconstruction’s mean level to the choice of calibration period and thus proved a useful, if ad hoc, way of dealing with the decline during calibration.
Cherry-picking
While Hockey Team ruminations are always amusing, the statistical issue is different. The big population of Northern Hemisphere temperature-sensitive sites (well over 300) shows declining ring widths in the latter part of the 20th century. Osborn and Briffa, 2006 have nonetheless selected some sites with remarkable late-century growth pulses: Sheep Mountain bristlecone, foxtails, Yamal (as re-processed by Briffa), Mongolia and a couple with modest pulses (Grudd’s Tornetrask). Osborn and Briffa purport to justify their selection of sites because they are relying on prior selections by Mann and Jones [2003]; Esper, Cook and Schweingruber [2002] etc. But this simply exemplifies the problems of lack of independence of authors and lack of independence of proxies. If the population as a whole showed dramatic increases in ring width, then you could perhaps accept the selectivity. But when the selections have such different behavior than the population of temperature-sensitive sites selected by the same author, you have to wonder.
References:
Briffa, K.R., Schweingruber, F.H., Jones, P.D., Osborn, T.J., Shiyatov, S.G. and Vaganov, E.A. 1998b: Reduced sensitivity of recent tree-growth to temperature at high northern latitudes. Nature 391, 678-82.
K. R. Briffa, F. H. Schweingruber, P. D. Jones, T. J. Osborn, I. C. Harris, S. G. Shiyatov, E. A. Vaganov and H. Grudd, 1998. Phil.Trans. R. Soc. Lond. B (1998) 353, 65-73
K.R. Briffa, 2000. Quaternary Science Reviews 19 (2000) 87-105
Briffa, K.R., Osborn, T.J., Schweingruber, F.H., Harris, I.C., Jones, P.D., Shiyatov, S.G., Vaganov, E.A., 2001. Low-frequency temperature variations from a northern tree ring density network. Journal of Geophysical Research 106, 2929- 2941.
Briffa, K.R., Osborn, T.J., Schweingruber, F.H., Jones, P.D., Shiyatov, S.G., Vaganov, E.A., 2002a. Tree-ring width and density around the Northern Hemisphere: Part 1. Local and regional climate signals. Holocene 12, 737-757.
K.R. Briffa,, T.J. Osborn, F.H. Schweingruber, 2004, Large-scale temperature inferences from tree rings: a review, Global and Planetary Change 40 (2004) 11 -26
Osborn., T.J., K. R. Briffa et al. , 2005, submitted to GPC http://www.cru.uea.ac.uk/~timo/papepages/osborn_summertemppatt_submit2gpc.pdf
Pstscript on Briffa [2000] and Briffa [1998]


56 Comments
Steve,
What do you mean when you say in parenthesis; “where there was a discipline resulting from the need to report their own extensive fieldwork”?
D’Arrigo et al have a lot of Alaskan sites where Jacoby et al have been working for many years. They had to mention these sites. Their analysis comes up to 1995 – much more recent than the other studies – compare Moberg proxies only to 1980. I’m going to post on this as it’s interesting.
One of the Table 1 citations is Wiles et al [2005] Tree ring evidence of a medieval warm period along the southern coast of Alaska, in prep.
Wow. If density and ring widths are decreasing, maybe the Earth is actually cooling, not warming! Wouldn’t that be a shocker to the Hockey Team! Interestingly, Idsos in their CO2 Science forum publishes a temperature record each week for a different location, and they all show decreasing temperatures, some rather dramatic. Of course, these are only samples, and they might be “cherry-picked,” but there are sure a lot of them (I think they try to avoid any big cities and heat island effects).
Lower densities could also have something to do with the amount of light the trees are seeing. Aerosols?
There is always the possibility that the rural tree rings are still measuring temperature correctly and the temperature measurements have become wrong due to more urban influences near each remaining thermometer site and the closing of rural sites.
Cloudiness could have an impact as well. When you add in positive and negative responders at each site – and Doug, I agree that the stability would need to be demonstrated – you really wonder what meaning can be unambiguously extracted from this data in a way that is not subject to criticisms of cherrypicking.
Or maybe trees just don’t respond to temperature in anything like a linear fashion. Perhaps their growth is simply non-linear, the result of many different causes.
As far as I can see, to choose which tree records to use and which records to ignore without any good explanation is as clear a demonstration of scientific malpractice as its possible to get. Medical researchers who behaved like this would be fired and sued for malpractice.
Choosing particular proxies with a large 20th Century growth pulse and others with no apparent trend, or truncating them if they go the opposite direction must be the climate science version of “salting the assay”
I suppose that “global dimming” is another factor here. The strong response to volcanic eruptions gives already some clue to that, as more sunlight is reflected to space. A reduction of (clear sky) insolation is measured in several regions. While (human made) aerosols were blamed, the reduction seems more related to increased water vapour. This may explain the decrease in growth with higher temperatures…
As I mentioned on another thread, the Alaskan Pacific Coast would seem ideal for a proxy area. It has, and has had for recorded history, the soggiest mid latitude climate essentially anywhere on earth.All things being equal, cold temperatures ought to be the sole limitation in the long term sense. Times when the climate shifted from Marine West Coast to Marine Subarctic would show up as limited growth. Of course the Hockey Team use bristlecones, which reside at the southern extremities of Mid latitude Climates (e.g. borderline subtropical arid) where the trees’ growth is almost entirely a function of the amount of moisture and has little to do with temperature, which in deserts and semi deserts varies from fire to ice – sometimes in a single day!
Re # 6
John A,
When radio carbon testing became useful for archaeology, one paper stated (paraphrasing it) “if the date confirms the chronology we use it in the main text, if it is slightly out, we put it in a footnote and if it is way out, we ignore it”.
Essentially the radiocarbon dates were used to confirm the apriori assumptions, not to test them.
Seems the same is occurring here.
Re #4 by Duoglas Hoyt
This explanation I have been expecting for many years.
There is another possibility which specialists can kick down. The surface temps represent only a very thin fraction of the atmosphere (smaller than thought) and do not give the proper trend. May be lower troposphere is closer to the general trend. In this case there is still a moderate warming trend but surface temps display a chaotic behaviour. Northern summer temps have been definitely lower than the general temps indicate in recent times. In this case declining tree ring signals would be just random variation.
The Idso’s in an editorial from July 15, 2000 have an interesting take on this issue. They claim (on the basis of experimental evidence) that CO2 fertilization enhances tree ring width by an amount that is ten times greater than its effect on tree ring density. They therefore suggest that the density measurements are accurate and, in line with what Douglas Hoyt suggests, conclude rather that the tree density measurements raise questions about the accuracy of the ground temperature measurements — particularly for the remote (from urban influences) sites where the trees typically are found. As a test of this hypothesis, has anyone used the estimated pre-1960 relationship between tree wood density and temperature to forecast the post-1960 temperatures and compare these with the satellite and/or balloon measurements for the same locales? The Idso’s, in the above linked editorial, suggest that the tree density record is consistent with the balloon and satellite records.
RE #4 — as you point out, one glaring characteristic of the pictured tree-ring sites is that they are, w/maybe a few exceptions, extremely “rural” compared to thermometer sites. Also, regarding #8’s comments, most are high-latitude/mountainous sites that are most likely cold-limited.
Perhaps there is hope for dendrology…
Re:#11
Briffa’s 1998 comment (under Theories above) argues against CO2 (or other) fertilization being the culprit:
freudian slip? 🙂
See: http://www.wdc.rl.ac.uk/wdcc1/papers/grl.html I’m certainly no expert on the sun, but it sure looks to me like the solar flux has been increasing since the 1800s. Now, if I’m reading this stuff correctly, we don’t need CO2 to explain global warming.
To continue a second: Some of the wavelengths associated with the increased solar irradiance could possibly have a retarding effect on tree growth. UV?
If memory serves, a graph of radiation from a hot body, with frequency on the horizontal and amount of radiation on the vertical, is a sort of bell shape. As the body gets hotter, the bell shifts right; as the body gets cooler, the bell shifts left.
Courtesy of the joys of evolution, the peak of the sun’s bell curve is around what we call the visible spectrum.
Chlorophyll and the other light-absorbing pigments absorb light at very specific frequencies.
So there is one particular shape of the bell curve that maximises the amount of radiation a plant can use, which will fall off as the sun gets slightly hotter or slightly cooler.
Is this a possible mechanism for an inverse quadratic relationship with insolation, and hence temperature ?
The doomsdayers are having a heyday over at Realclimate. I tried to post a reference to Lomborgs (sp?) book, “The Skeptical Environmentalist,” but they won’t post it. Hell, Lomborg even buys into AGW! This is the second time they have ignored my post quoting this book. I guess they just want to continue believing that we are destroying the planet. It’s great that this type of biased editing doesn’t go on here.
RE: Realclimate doomsayers. When a faction comes to believe that those who critique it are some sort of “inquisition” then their minds draw closed. Who are the real Inqusition? How can those who have funding and media support claim to be anything but an Inquisition themselves? And how can they claim that we, who are outside the Establishment, are some sort of “inquisition?” I know this analogy may not be 100% effective, but this reminds me of the way that the Establishment labeled Malcolm X a “dangerous revolutionary” when meanwhile, actual Communists and bona fide dangerous underminers still resided within the Establishment and faced zero scrutiny. To me, anyone who uses a pine tree that for all intents and purposes has adapted itself to live like a cactus, and lives at the southerly edge of the midlatitude climates, as a proxy, has zero credibility. They are circling the wagons, we must be doing something right!
Jae
RC defines “dialog” in a different way than most English speakers. What can you expect from folks who believe that it is acceptable practice to withhold data? Or from people like William who believes that the Vikings colonized a glacier in Greenland? Since he believes that the MWP never occurred, he must believe that Greenland was never, as the name suggests, “Green.” I suppose that he believes that the name was simply clever marketing by Vikings who wanted to colonize a glacier.
What I find most amazing about the Hockey Team is that they seem to believe that obfuscation will prevent people from discovering their odd statistics, data mining programs, cherry picked proxies, trancated data, and instrument records which are becoming more urban every year.
There are two different ways of looking at the recent widespread decline in tree ring density and widths.
1. The rural tree rings are still measuring temperature correctly and the temperature measurements have become wrong due to more urban influences near each remaining thermometer site and the closing of rural sites.
Consequence: It implies that climate is still within natural ranges and no warming from greenhouse gases has shown up.
2. The tree rings are spurious and don’t measure temperature.
Consequence: All the climate reconstructions using tree rings can no longer be considered valid. Climate reconstructions using boreholes, the Sargasso Sea proxies, or other methods have more validity and all these methods indicate a Medieval Warm Period and Little Ice Age. Again, it implies that climate is still within natural ranges.
Given all the variables that determine plant growth rates, I think that the default position should be that tree rings cannot be expected to serve as “thermometers.” Has anyone really demonstrated, conclusively, that any single tree, let alone thousands of them can serve as a temperature proxy? A simple greenhouse study could answer this question in 5 years or so…
Re #22: “A simple greenhouse study could answer this question in 5 years or so…”
Really? Lets think about that. In a greenhouse we can manage temperature, moisture, soils, fertilisation, light, plant density, CO2 concentration in the air, and probably some other factors (such as music! Isn’t there some work that shows that plants grow faster if exposed to Mozart?). All of these can impact on growth rates and tree ring thickness. So just how are we going to manage the study. Are we going to hold all other factors than temperature constant (if we can).
The problem clearly is that growth rates (and therefore tree ring thickness) are a resultant of many inputs. It is probably the case that maximum growth occurs when an optimal combination of ideal settings is in place, and minimum growth when the least optimal set of setting are in place.
I suppose that we could design an experiment that would be meaningful, but wouldn’t we need, say, 100 greenhouses that each have different combinations of the key inputs? And then, after 5 years, we can take all of the trees out of their greenhouses, and then invite the dendrochronologists to take their cores, and tell us what temperature prevailed in each greenhouse over the 5 year period.
#23 Well, you may be right. But I can visualize some experiments where you could vary only temperature and keep all (virtually) other variables constant. For example, why couldn’t you build two identical greenhouses, mix up some soil and distribute it between the two greenhouses, plant the trees. One greenhouse would be cooled by five or so degrees during the day with an air conditioner. The other would receive the same amount of ambient air (same sdcf).
Re: #23: Actually, I would appreciate input from a qualified dendrochronologist on this issue. I am no dendrochronologist, so there are probably major flaws in my characterisation. BTW, I forgot to include amongst my variables species variables – the runts of the litter v the vigourous, powerful survivors.
As a layman though, it seems a bit of a challenge for a dendrochronologist to figure out the temperature control as a factor in tree ring width under the circumstance postulated. But if we can’t do it in a controlled experiment, how can we hope to do it in the natural world???
Come to think of it, the forestry folks grow millions of trees in greenhouses every year. I wonder if they have observed temperature effects, other than the obvious effects of using a greenhouse.
More info on the White Mountains. Does this seem like a good site to rely on tree growth as a reputed temperature proxy?
http://www.sonic.net/bristlecone/WhiteMts.html
“As Pacific storms move eastward, the Sierra simply takes the majority of moisture, leaving the White Mountains with strong dry winds. Annual precipitation is less than 12 inches (30cm), most of which arrives as snow in winter. On a summer’s day the amount of precipital moisture in the air is about half a millimeter, the lowest ever recorded anywhere on earth. ”
“The dry climate and high altitude make this region a rare environment. The rapid changes in elevation create abrupt habitat and species changes. The soil quality is poor, and at its poorest in the alpine zone. This factor combined with a short growing season, results in sparse and delicate flora. Recovery from disturbance is slow, said to take more than 100 years!”
“The geologic makeup of the White Mountains is of quartzitic sandstone and granite bedrock. A large part of the soils on these slopes have been swept away by the extreme conditions.”
http://395.com/white.htm
“Boundary Peak’s popularity is due to its status as the highest point in the state of Nevada (13,140 feet) it is located at the northern end of the White Mountains near the California border. Neighboring Montgomery named for the 19th century mine on its northwest slopes, stands at 13,441 feet and is an additional 2 hour round-trip scramble west of Boundary Peak.”
“The Owens Valley was formed by down faulting about 10 million years ago between the rising Sierra Nevada and Inyo-White Mountains. Despite their simultaneous formation, the ranges look dramatically different. The Sierra Nevada is generally composed of heavily glaciated young granite while the Inyo-White Mountain’s batholith is overlaid with some of the oldest sedimentary rock found in California. Fossils nearly 600 million years old are exposed along with a patchwork of metamorphic rock. The area is unique in that the original levels of sedimentary materials have not been transposed by warping and faulting. ”
“The White Mountains are in the rain shadow of the Sierra Nevada, resulting in a semi-arid climate. Annual precipitation varies from8 inches in the lower slopes to over 20 inches on the peaks. Over 80% of the moisture falls as snow. The remainder comes in isolated summer rain showers. “
Just a side note. Based on his CV Mann attended University of California at Berkeley, IIRC, for his BS. That ought to have given him ample opportunity to personally take advantage of the White Mountain Research Station, use of which ought to be a right of passage for any geologist who comes out of the UC system. One cannot fail to appreciate the bizarre particulars of the climate and botany of the area if one spends even so little as a weekend there. Clearly, these particulars speak to a climate and botanical suite which is well out of the ordinary versus many other places in North America. Certainly, any notion that such a place is even remotely similar to, say, coastal British Columbia or Southeastern Alaska, in terms of the expected responses of trees to “global average temperature,” cannot be based on even the slimest exposure to a place such as the White Mountain Research Station and its environs.
I hope I am not reinventing the wheel, but I wonder why the tree-ring proxies for temperature relied on by Osborne & Briffa in their Science article this month assume that there is a POSITIVE correlation between tree rings and temperature, such that
y(t) = a + x(t) …….(1)
where y is the predicted temperature, and x is the “regional growing season temperature” from the “predictor” (i.e. tree rings) (equation from Briffa et al, 2002).
But in reality tree ring widths are the result of several factors, including site slope and orientation, soils, temperature and – above all – precipitation.
Recently derived tree ring data from Bighorn Basin shows that there, tree rings (x) are positively correlated (over 100 years to 1995) with precipitation, and NEGATIVELY with temperature, so that we have
x(t) = a – y(t) + z(t)…..+ u(t) …..(2)
where z denotes precipitation and u all the other factors ignored by Briffa & co.
Thus Briffa’s equation should read:
. y(t) = a – x(t) …….(3)
Perhaps for global warmers, for whom current very cold NH winters and record Arctic snowfall are proof of AGW, what does it matter whether signs are plus or minus?
So am I right that tree rings are hardly a valid proxy, being evidently based on bogus correlations that became possible only because precipitation was ignored? Or have I missed something, and negative corelations between tree rings and temperature are what underpin the hockey stick?
Tim: Amazingly, I have yet to see any real validation of the use of tree rings as a temperature proxy. You would think that this relationship would be very well established, before being used as the basis for studying climate changes. I agree that there are so too many other variables to find a temperature signal in most trees. Perhaps there are trees somewhere in the world that have all the moisture, nutrients, etc. that they need and are affected only by temperature, but I doubt it. Even those trees are exposed to variations in sunlight, competiton, etc. And on top of all this, there is a negative correlation between growth rates and temperature in many cases! And then to think that all these other variables stay constant for thousands of years really stretches the imagination. I think this ring proxy thing is rediculous.
My 2 cents worth is that the major factor that tree growth should be correlated with is relative humidity
re 31. Yes, that makes much more sense than temperature. Probably different variables act at different places. Humidity would be important in a dry environment.
Don’t forget sunlight. A small tree in a forest may grow very slowly for many years. Then perhaps an older shading tree will fall or die (having no leaves) and the smaller tree will get more sunlight causing it to grow more rapidly. Its growth rate and tree ring width would not be providing any measure of large scale climate, but rather just the local microclimate.
Doug, the effect you mention is very much on dendro minds. Many of their sites are relatively open for that reason. However competition can take many forms. The spacing of open trees is remarkably hexagonal – it’s quite pretty in some photos. So there has to be some kind of inter-tree interaction – maybe the roots compete as well as the branches.
Rob Wilson is also interested in cloudiness as a factor.
Perhaps you can observe the spacing of living trees, but how does one know the ever changing surroundings of a tree that died centuries ago?
re: #34.
It’s been a long time since I read a botany textbook, but I recall reading that many species do compete with trees of their own and other species by producing chemicals which prevent competition. It’s not a universal thing however, so it might be that trees that naturally space themselves (usually because of habitats of either low fertility or low rainfall) are the ones picked to use in tree ring chronologies.
Still the fact that such spacing is usually a sign of low moisture or fertility should give pause to those wanting to use them as temperature proxies.
#33,#34,#: I have an example of this in my backyard. There is a fir tree that is now about 50′ high that was less than 10′ for many years, it grew in the shade of a huge maple that was about 150′ high. The maple was completely rotten at the base so I had it taken down before it showed up in my bedroom after a wind storm. It only took a few years for the fir to really shoot up once it got lots of sunlight. Had this occured naturally, I doubt that anyone would ever know about the maple after 50 years given the rate trees rot around here.
I also have a second example. I planted 4′ high Arbor Vitae along the same border. The plants that are close to the fir are still about 4′ high but fifty feet away they have grown to about 15′ high now. It’s just like real estate, location, location, location.
Long ago, looking at those trees made me doubt that tree rings were thermometers. This would have been interpreted as a sudden massive warming when in fact it was caused by an increase in sunlight.
I have degrees in forestry, wood science, and wood chemistry, so I know more than the average bloke about trees and wood. The discussions above have hit on many of the problems involved in using tree rings as temperature proxies. I wish I had time to do a serious literature search on relationships between tree growth rates and temperature (come to think of it, maybe it wouldn’t take much time, because I don’t think there is much literature to review). Based on what I know thus far, there is no real basis for assuming that tree growth rates can be used as a temperature proxy. If that is the case, it is amazing that this tree proxy “science” has gone as far as it has.
The places where I think it might be “safe” to use tree rings as temperature proxies are quite limited. They are all places subject to some degree of thermal seasonality (e.g mid latitude) and where moisture is essentially never a problem. Wet places well known for drearyness and typical Marine West Coast forests. If I were to have to commit to doing so, here would be my (very short) list:
* Coastal British Columbia and Southeastern Alaska
* Any remaining undisturbed forest fragments in coastal areas of NW Europe (are there any? doubtful ….)
* South Island of New Zealand
* Coastal southern Chile
I would like to see a study showing the relationships, even in those places. Variations in growth due to light intensity is more likely than variations due to temperature in such areas. Hmm, maybe trees could be used as a proxy for solar cycles! And solar cycles could be used as a proxy for temperatures!
The Cook et al Tasmanian study posted earlier on this site is interesting. This seems like an ideal & strategic location for a study. But the results are very complicated.
http://www.climateaudit.org/?p=343
I thought Steve_M had a ~4000 yr temp reconstruction graph of this study that had the classical, Antarctic ice-core interglacial pattern of a slight but persistant downtrend over that time. Can’t remember where…
RE: #40. Indeed, even with all my caveats, tree rings are very iffy as proxies.
38:
your degrees, then, had you go out in the woods and core to understand stand dynamics. Your degree taught you – provided you did field work – that cores tell you many things about a tree or a stand of trees. It’s basic and has been used for decades, and is well-understood.
When you did your first dendro population study, you were probably instructed to randomly core lots of trees of different dbh, after reading some journal articles. Probably a hundred or so to get a pop. that is significant, with x# of different dbhs. Whey you were done and analyzed your data – comparing the growth rings to the standardized sigmoid curve for each spp., you found you probably had noise. Why did I have noise, you asked your instructor? Well, which spp. did you use? Did you use shade-toleranT or -intolerant trees? Look at your cores again. Are there fire scars present, giving release? What about aspect? Look at your notes. A good instructor will make sure you make mistakes early so you won’t make them again. You should expect to find release after an opening is created, so that isn’t a problem. Noise is expected – it is a reflection of stand dynamics.
After you found all those problems gave you a headache, you chose your next site more carefully, right, depending upon the question? And dug into the ground to get an idea of the FRI for that site [or looked it up], to get a better history, right? Maybe you chose a slower-growing spp., or an even-aged stand to avoid the obvious confusion in 37. The ideas behind selection when doing coring probably started to make sense, esp if you want to go back pretty far in the age of the stand. You probably got to chainsaw some downed trees to make comparisons too, which is always a hoot & the girls want to do it and everyone has fun.
Your second or third trip probably was good enough that you brought back some good stuff so that you could use some of the standard programs to analyze tree rings after you sanded your cores and made them all purty.
Coring is different than cruising. It’s been done for a long time. Your degree should give you enough momentum that if you think the thing is ‘rediculous’, then do your Galileo and rock the forestry world, dude!!!!!!!!!
Certainly if you think you know more than the profession, let them know. Share.
Best,
D
Dano? What does all this have to do with temperature 1000 years ago?
This thread is a bunch of people with no experience in the field trying to question the science of dendrochronology. Next thing you know, there will be important-sounding chattering about “there are serious questions about the discipline’s methodology because blablabla!!!!!” and then there will be spam on listservs and blog comments, then it will be a talking point.
I’m saying they don’t know what they’re talking about*. Your comments above in 38 imply the same. Read up.
Best,
D
* Douglass, A.E. 1919. Climatic Cycles and Tree Growth: Vol. I: A Study of the Annual Rings of Trees in Relation to Climate and Solar Activity. Carnegie Institute of Washington Publication 289: 1-127.
1919 fer cryin’ out loud.
Jae,
Dano is going to give you a better answer than I am, but I believe he just described the barest fundamentals of dendrochronology, one aspect of which (relationship btw tree rings and temperature) you questioned in post #38. So the answer to your question appears to be embedded in the basis for your own posts.
Like I said, I wish I had the time to do a detailed survey of the literature. Looks like the Hockey Stick Team has been around longer than I thought. Too bad Steve didn’t set them straight on statistics back in 1919!
Re #45: Looks like there’s a 1971 reprint that’s more likely to be in your local library:
Thanks for the refs, Dano.
You’re able to conflate a century-old science with the hockey team and you haven’t read the literature?
My, my – you ARE a Renaissance man! You need to overturn this paradigm right away. Get on it, man! John A needs some talking points!
Best,
D
You’re welcome Armand.
Best,
D
Dan0: Climate is not temperature, you know. See Steve’s post on the Upside Down Quadratic Proxy Response (Post 1980 Proxies) and dozens of other posts here that show (to me, at least) that trees do not do a good job of recording temperature signals, in general.
#45. Dano, there is theory, and then there is the actual data used in the actual studies. To put it bluntly, this actual data sucks. Take a look at a previous post by Steve here — http://www.climateaudit.org/?p=393
The best correlation with sensor temperature he found from the actual data (and we are talking the best out of 70 separate series) was 0.2. From a signal processing point of view (which is the way I like to think of data) a correlation of 0.2 is equal to a signal to noise ratio of 1/4. In other words the noise power was four times higher than the signal power in the ‘best’ matching series out of 70. That is pretty horrible. This does not even get into the whole issue of negative responders, dubious age corrections, fertilization effects, use of ancient trees for which correlation quality cannot be checked or calibrated by comparison to modern instrument data, and on and on. Most of these problems you can find explained in detail on this site.
#52:
Ian,
I responded to this post as there was a gathering, seemingly inexorable tide of bad conclusions arinsing from misperception of dendro. as my wording in 45 made explicit. I contextualized and provided reading material toward re-directioning the way off-target conclusions being rapidly made. That was the implicit topic and I responded to it.
There may well be confounding environmental factors behind what you relate, but that is beyond my skill level to analyze, hence my not commenting on them. I will follow how the differential analyses fisticuffs play out in the places where the currency of scientific knowledge is exchanged, the journals. If I see someone other than one guy start talking about these concerns, then you’ll have my (and others’) attention.
But as your topic is a small subset of a larger issue [‘what are the indicators of a rising global temperature?’ ], the answer to your concern may be a quiet footnote unless someone hops on it, starts making their own hypotheses, gathers their own data, and says “See! told ya so!”. Because that is how it works; when someone didn’t like geological uniformitarianism, they didn’t post flyers on horse’s butts, they got a rock hammer and slept in a tent until they had an answer. However, I’m sure Aristotle and Plato occasionally called each other names (“…and how about that idiot Pliny? hohoho! How’s he expect to do a T-test on that finger now? Slave, more grappa!”) like what’s going on here, so let’s at least keep our perspective.
Best,
D
Dano: I have not read all of the many references you provided, but I suspect most of them suffer the same problems Steve is concerned about, especially the problem of picking only those series that go along with the preconceived view of AGW. Dendrochronology, as applied to temperature reconstructions, has suffered a terrible blow in the last year. Why don’t you use your vast wealth of knowledge and wit to address the cherry-picking problem? Will this ever be addressed in the journals? Probably not for awhile….
Dendro is of interest …. vis a vis past rainfall …. in most parts of the world. Even then, as our resident tree expert jae has noted, there are many other controls of growth. Has anyone done a really good DOE on this? It would be interesting to look at the response surfaces for temperature, moisture, soil, succession factors and all the other variables that we might surmise to influence tree growth and latewood density (or lacks thereof).
4 Trackbacks
[…] Post number 529 at CA, how quaint. […]
[…] after the publication of Osborn and Briffa 2006 and D’Arrigo et al 2006 in February 2006, I reviewed the findings of Briffa et al (1998) on the wide-spread decline of ring-widths and MXD since 1960 […]
[…] Briffa’s approch to the "Divergence Problem" before – see for example here – and we modified our presentation to respond to concerns about the "Divergence […]
[…] that "cherry picking" is necessary if you want to make cherry pie. And as for what she thought of that "divergence problem" with tree-ring proxies: Pshaw! (see pages 11 & […]