D’Arrigo presented their new study. I went over and introduced myself and said that I thought that their new study was much better than Osborn and Briffa and that it was too bad that they hadn’t received the same publicity. She said – Well, I guess that’s a compliment of sorts. I was trying to be nice, but the compliment was sincere. I missed much of her presentation as I went to a back office at NAS to download some information to edit our own PPT presentation, but a couple of interesting things, including one issue related to Briffa and familiar to readers getting firmly on the table.
Cherry Pie
I don’t have the exact words here. (I’ll edit it if I get better notes.) But, for certain, D’Arrigo put up a slide about "cherry picking" and then she explained to the panel that that’s what you have to do if you want to make cherry pie. The panel may have been already reeling from the back-pedalling by Alley and Schrag, but I suspect that their jaws had to be re-lifted after this. Hey, it’s old news at climateaudit, but the panel is not so wise in the ways of the Hockey Team. D’Arrigo did not mention to the panel that she, like Mann, was not a statistician, but I think that they already guessed.
I posted up a long time ago – scroll down – about Jacoby’s answer explaining why he would not archive or disclose the other sites besides the 10 most “Å“temperature sensitive” out of 36 that they reported on. But it’s also about making cherry pies. Here’s an excerpt:
If we get a good climatic story from a chronology, we write a paper using it. That is our funded mission. It does not make sense to expend efforts on marginal or poor data and it is a waste of funding agency and taxpayer dollars. The rejected data are set aside and not archived. As we progress through the years from one computer medium to another, the unused data may be neglected. Some [researchers] feel that if you gather enough data and n approaches infinity, all noise will cancel out and a true signal will come through. That is not true. I maintain that one should not add data without signal. It only increases error bars and obscures signal. As an ex- marine I refer to the concept of a few good men. A lesser amount of good data is better without a copious amount of poor data stirred in. Those who feel that somewhere we have the dead sea scrolls or an apocrypha of good dendroclimatic data that they can discover are doomed to disappointment. There is none. Fifteen years is not a delay. It is a time for poorer quality data to be neglected and not archived. Fortunately our improved skills and experience have brought us to a better recent record than the 10 out of 36. I firmly believe we serve funding agencies and taxpayers better by concentrating on analyses and archiving of good data rather than preservation of poor data.
The Divergence Problem
While there’s lots to complain about in D’Arrigo et al [2006], it is both a better and a more candid study than Briffa and Osborn [2006]. I had started a post on this a couple of weeks ago, but it got overtaken by getting ready for NAS. You remember about “bring the proxies up to date! Well, D’Arrigo et al. carries proxies up to 1995 in a decent sized network. After 1985, their verification fails, so they go through some contortions to re-calibrate up to 1978 and make some (IMO) unsupportable statements about the relationship between medieval and modern periods, given the out-of-sample failure. But they at least showed the divergence in their graphic (rather than snipping it off a la Briffa). Here’s a graphic from DWJ06 (which D’Arrigo showed.)
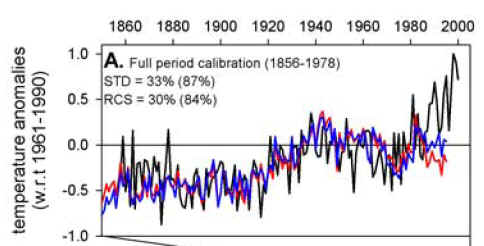
The discrepancy between the forecast and the actual caught Cuffey’s eye and he asked D’Arrigo about it. She said “Oh that’s the “Divergence Problem”‘?. Cuffey wanted to know exactly how you could rely on tree ring proxies to register past warm periods if they weren’t picking up modern warmth “questions dear to the heart of any climateaudit reader. D’Arrigo explained that it had all been discussed by Briffa et al. I think that D’Arrigo said that the "divergence problem" only applied to a few sites.
I’ve discussed Briffa’s approch to the "Divergence Problem" before – see for example here – and we modified our presentation to respond to concerns about the "Divergence Problem". First, we showed the following graphic, reporting that the "Divergence Problem" was not limited to a few sites, but applied to an entire network of 387 sites selected to be temperature-sensitive.

Then we presented a graphic showing the following direct quotation from Briffa, "explaining" the Divergence Problem":
In the absence of a substantiated explanation for the decline, we make the assumption that it is likely to be a response to some kind of recent anthropogenic forcing. On the basis of this assumption, the pre-twentieth century part of the reconstructions can be considered to be free from similar events and thus accurately represent past temperature variability.
I’ve been trying to figure out a proper term for Briffa’s explanation – would you agree that it’s a cargo cult explanation of "divergence"?
Also see posts 529, 586.


51 Comments
Exactly which University did Briffa graduate from and who was his supervisor? Who is funding this nonsense?
Roger Bell
You pay your taxes, don’t you Roger ? Well, then, you’re probably funding it …
My chin hit the desk, too. A freshman in any scientific discipline could see the glaring errors in this approach. BTW, why don’t these reconstructions show the cool period in the 1930-40 era? Is that another sign that tree rings are generally worthless as temperature proxies?
It’s the “head in the spot where the sun don’t shine” approach to divergence.
So Briffa’s answer to the “divergence problem” is that the estimates are right and we should ignore temperature records using actual thermometers? Hmmm…
I think that the Briffa statement is the clearest example of circular arguing that I have ever seen.
It could be anthropogenic effect, but it’s not temperature – at least as indicated the April September mean temps. What’s the source of the data behind the temp line?
Steve, how about the “Divergence Factor” as a proper term? Seriously, though, let’s look at what they are implying. They are making an assumption that man-made increases in global temperatures somehow slow down tree growth, yet natural climate variations would have the opposite effect. Has anyone seen evidence that increased CO2 would slow down tree growth? I’ve only heard the opposite. This effect would not be valid for the bristlecone pine data, if I remember correctly.
I would expect that this “Divergence Factor” might gradually take effect, such that it would slowly transition from a positive reaction to a negative reaction to temperature. That doesn’t seem to be the case, since it seems to make an abrupt transition near 1960. Maybe some pollutant showed up in 1960 that stunted tree growth? Then again, if they are cherry picking the trees for this data, then the 1960 transition may be an arbitrary artifact. Jacoby’s unarchived data might be useful in further analysis.
In the D’Arrigo figure, it looks like you have about a 0.2 C cooling for 1979 to 1995. This cooling is actually confirmed by Chase et al. (2000) who using the NCEP analysis (Table V in the paper, page 513) find that, for the 1000 to 925 mb layer, there was a cooling of 0.08 C/decade for 1979 to 1996. So almost identical answers. NCEP is supposed to be one of the most reliable data sets around.
It seems like the surface thermometer network disagrees with all other analyses.
Reference:
Chase, T. N., Pielke Sr., R. A., Knaff, J. A., Kittel, T. G. F. and Eastman J. L., 2000. A comparison of regional trends in 1979–1997 depth-averaged tropospheric temperatures. Int. J. Climatology, 20, 503-518.
Re #8
So its back to the greatest hoarder of climatic information ever – Phil Jones. Now what?
RE: #6. Presumably, the surface record. Hmmmm …. now that is interesting.
Ring widths appear to have a period of ~ 11 years, just like the Pacific Decadal oscillation. It looks like there are maxima of width during El Nino periods, roughly speaking. Durind a good El Nino there is enhanced probability of a strong Monsoonal flow during May – November. Otherwise, that part of the year bring’s drought stress to the trees. The latewood density is interesting. It is said that whereas the 1930s were a Dust Bowl for the Great Plains, especially the southern portion, that was not true for the southern half of California. The overall general climate was wetter and cooler. Then, from 1940 until the early 80s, there was a rather benign climate, with slow drying, in the southern half of the state. The extreme El Nino of 1982 and 1983 seemed to inject a perturbation of sorts, eventually resulting, by the mid 90s, in the southern half of the state appearing to leave behind the benign 1940 – 1980s mode. So perhaps ring width go with spring and summer moisture availabilty (spring snow pack and summer convection events) and the density goes with the overall general climate in the reverse sense, going down with a more benign condition and rising when the combination of precipitation events and coolness rises. Hey, my theory is at least as good as the orthodoxy’s theories!
Don’t tell the climatologists, but the trees may be telling us that it is getting cooler, rather than warmer. Look at the temperature records the Idsos publishe each week. They all show considerable cooling. I doubt that they are just cherry-picking, either, but you never know. Also, trees are impacted much more by moisture regimes than small changes in temperature.
Re: #8
I just looked at the Chase paper again and it is actually a cooling of 0.08 C for 19 years (1979-1997), so the cooling is 0.04 C/decade. The captions on the tables are a little confusing. You have to go back to Table 1 to see what the numbers mean. In any case, they also report the MSU 2r trends and they are also -0.04 C/decade. This is an older version of MSU data, but should be fine since the new 5.2 version differs from the earlier versions only for the data after about 1995. The recent warming trend began around 1993 and includes a couple of big El Ninos.
The Chase paper can be found at http://blue.atmos.colostate.edu/publications/pdf/R-224.pdf
(pdf format).
What are the red and blue lines in the D’Arrigo figure?
Also just noticed Table VI in the Chase paper where they give the trends for the surface thermometers. It is +0.16 C/decade. They seem to be using the Jones data.
They also give summer (JJA) trends, but they don’t differe much from the annual trends.
Not much going on at Realclimate these days, either. A definite dearth of posts.
Roger Bell
No. 11
“Ring widths appear to have a period of ~ 11 years”
How does ring growth match up with solar radiation, sun spot cycle?
Re #2 – No fFreddy, I pay my taxes in US dollars. K. Briffa is a Reader at the University of East Anglia so I suspect he’s getting support in British pounds.
Roger Bell
In the spirit of “nothing except what comes out of a tailpipe/smokestack (and can be regulated) is the cause”, I’ll venture that surface ozone will be conjured up as the explanation for the divergence. Ozone=less tree growth.
Just like sulfate aerosols were employed to explain any cooling in the temp record.
It looks like the recent data in two lines are not related so they give it a pass. Therefore I propose the Two Line Pass as an addition to the Hockey Team lexography.
The cherry-picking story sounds as if it might be a suicide note, but without more detail, it would be wrong to speculate.
I might guess that this could be difficult for the panel. They could reasonably have expected both sides of the argument to be presented, and both sides to be quite reasonable. If it turns out that the evidence presented on one side is gibberish, that puts them in a hole.
I do not think that they will be able to conclude that one side of the argument is gibberish just on the basis of the presented evidence; they would have to cast about widely to ensure that no-one else is available who could make a coherent case. Otherwise, the committee could be in the position where it writes up that one side of an argument is gibberish, and they are demonstrably wrong.
It all sounds like good fun !
per
#5-You’ve hit the nail right on the head, John. The same circularity is implicit in the Jacoby quote. By what criteria does he choose “good data”? Are they data that show trends consistent with his climatological expectations? And if it is “not true” that the noise in, e.g., tree ring data, does not average out of large proxy ensembles, by what rationale can anyone apply statistical methods? Noise that doesn’t average out is not noise. Jacoby clearly assumes he knows what the “signal” looks like a priori. There isn’t a better recipe for disaster in science than to presume the results and then construct the results. Doing so by deliberate malignance is called fraud. Doing so by honest ignorance is called incompetence. Doing so by mistake is called foolishness. I see no way out of calling the whole climate proxy enterprise an enormous mess. It has gone terribly astray.
#13 – Doug: red and blue are reconstructions using RCS and STD reconstructions (different tree ring standardization methods). What’s good about this study is at least they went up to 1995 and at least they showed the warts. What’s bad is that they mentioned MWP about 22 times and concluded that this information showed that the modern period was much warmer than the MWP despite the failure of the proxies to work in the modern period.
Their reconstruction also substituted Yamal for Polar Urals as we discussed before. They’ve argued (Wilson and d’Arrigo at NAS) that the substitution was for valid alternate reasons, but, really, what would have been the chances of a substitution going the other way?
Re #21: “Noise that doesn’t average out is not noise”. This claim seems to assume that the noise has a zero mean with a roughly bell-curve shape. Unfortunately, that assumption does not hold in tree-ring studies. Maybe a bear came along and scrapped the bark off the tree; or maybe there was a local canopy that blocked most sunlight; or maybe rain water diverted unusually on the hill on which the tree is situated; or maybe the tree has a very strange genetic makeup; or maybe…. The result is that “noise” can readily cause the tree-ring width (or latewood density, or whatever) to be extremely far away from the median. So noise often does average cancel out.
Even with a sample of 25 trees, one aberrant individual could easily dominate sample averages. Similarly, one aberrant site can seriously skew a large collection of sites. This is one of the justifications for cherry picking. Of course, cherry picking has the problem of leading to cherry pies, as Steve Mc says. What is needed is a much more accurate statistical treatment. But this is research-level statistics (try this with real tree-ring data: every assumption that you make seems to get contradicted). And I don’t think anyone is doing the research.
Tree ring data is actually pretty interesting. If I were running things, I would commission some top statisticians (say mixed effects people like Pinheiro and Bates) to take a crack at it. Relying on people with limited skills and an agenda is a toxic recipe.
I think the question is: Are the proxies capable of handling anthropogenic forcing, or not?
If yes, the “Divergence Problem” is bogus.
If no, then the calibration, which occurs when some anthropogenic forcing is present, can not be used to reconstruct for earlier periods when anthropogenic forcing was less.
Re #17, Roger Bell
Ooops – then I’m funding this nonsense. I want a refund.
Greetings All,
Some of you have obviously not read our paper.
It can be downloaded from:
Click to access D’Arrigo%20et%20al.%202006a.pdf
If this link does not work, you can go directly to:
http://freespace.virgin.net/rob.dendro/Publications.html
Some points:
(1) We calibrated from 1856-1978 as this was the common period of the tree-ring and instrumental data. However, using the method we used, we were able to ‘reconstruct’ temperature forward to 1995.
(2) with respect to Steve’s comment:
“What’s bad is that they mentioned MWP about 22 times and concluded that this information showed that the modern period was much warmer than the MWP despite the failure of the proxies to work in the modern period.”
well – I am sorry Steve, but I am not sure you have read the paper that closely either – lets look at the last statements in both the abstract and conclusion
Abstract
“Although we conclude, as found elsewhere, that recent warming has been substantial relative to natural fluctuations of the past millennium, we also note that owing to the spatially heterogeneous nature of the MWP, and its different timing within different regions, present palaeoclimatic methodologies will likely “”flatten out” estimates for this period relative to twentieth century warming, which expresses a more homogenous global “”fingerprint.” Therefore we stress that presently available paleoclimatic reconstructions are inadequate for making specific inferences, at hemispheric scales, about MWP warmth relative to the present anthropogenic period and that such comparisons can only still be made at the local/regional scale.”
Conclusion
“Taken at face value, our reconstruction indicates that MWP conditions were nearly 0.7oC cooler than those of the late twentieth century. These results suggest how extreme recent warming has been relative to the natural fluctuations of the past millennium. This conclusion, however, must be taken cautiously. First, there is significant divergence between reconstructed and actual temperatures since the mid-1980s, which, until valid reasons for this phenomenon have been found, can only question the ability of tree-ring data to robustly model earlier periods that could have been similarly warm (or warmer) than the present. Second, there are presently only very few millennial length records available for direct comparison between the recent period and the MWP, and these records show trends which are not necessarily coherent over the latter interval, resulting in a “”flattening” of MWP conditions compared to recent warming in our reconstruction. Ultimately, many long records from new NH locations and updating of existing records (mainly in Eurasia) to the present are required. Successful modeling of paleoclimate data with the high temperatures of the late 1990s is essential if we are to make robust, definitive conclusions about past temperature amplitudes and variability.”
My 10 pence to the discussion
Rob
So what else was true for that 1970 – 1980 divergence. I seem to remember that air pollution and acid rain were the buzz words with large forests clearly declining. Later a large scale aridness was also mentioned. We had three major aerosol volcanic eruptions in that period, Agung, El Chinon and Pinatubo doing something with clouds and light availabilty.
But explainations for that should not detract from the problem. How many other divergence problems are there, which have been interpreted as temperature signals.
very civilised ! much better that 2c 🙂
thx for the linx
per
Let me clarify the point I was making in posts #8, 13, and 14.
For 1979-1995/97, we have the following observations:
RCS tree rings: cooling for 1979-1995
STD tree rings: cooling for 1979-1995
NCEP analysis (pressure transducers) for the 1000-925 mb layer: cooling of 0.04 C/decade for 1979-1997
MSU 2r analysis: cooling of 0.04 C/decade for 1979-1997
Surface thermometers: warming of 0.16 C/decade for 1979-1997
The tree rings are validated by the balloons and satellites.
The surface thermometers, on the other hand, are wildly different from all the other results. This indicates that something happened to the surface network between 1979-1995 and it is not a reliable measure of temperature. The surface network is overestimating the temperature and has a spurious increase of 0.38 C by 1997. It is because of this large spurious increase that claims can be made that it is warmer now than any time in the last century, or perhaps last 1000 years.
The reason for the spurious temperature readings in the surface network could be many. For example, many rural stations were shut down in 1980 and in 1990, as well as the other years. The average population near the remaining sites will increase and introduce a spurious trend in the readings. It is time to audit the surface network and it would require a team of physicists and statisticians.
#30. Doug, I haven’t spent much time on recent temperature issues. But the SST readings are separate from the issues of urban heat effect and also show warming in the last 2 decades. I think that there may be some distinct issues here, but on balance, I think that there’s evidence of SST warming. (Causation is a different issue).
Glacier recession has continued in the past 2 decades. Now the glacier recession could simply mean that 1980 was already warm enough to cause glacier recession and maintenance of the same temperature levels would cause more recession. I think that the Jones record may be exaggerated, but I tend to think that there has been warming, perhaps the lesser amount indicated by satellites.)
Re #27
Rob, don’t do yourself down, that’s at least worth a quid!
A lot of the satellite warming has occurred because of two big El Ninos in 1998 and 2003 which have forced the temperature record upwards. The surface trends seem to be too high by a large amount. They are used nearly exclusively in promoting global warming, but are not validated by other measurements.
Re #27, Thank you Rob Wilson.
Try this link to fetch the paper.
Besides the fact that trees have an “optimum” temperature response and show reduced growth at higher and lower temperatures, there is some other phenomenom that may play a role: global dimming. Called that way, as there seems to be less direct sunlight coming down to the surface in recent decades (but increasing again since app. 2000). Some point to aerosols (but that is not very plausible, as that should give an increase since 1975 for Europe and in part for North America), but I have the impression that increased water vapour levels are at the base of this change.
Question remains, if this is a general response to increased temperatures, then the MWP may have been as warm as today, as higher MWP temperatures would also give more water vapour (in general) and thus reduced tree growth…
30. Boy, do I agree with you!!!
Re #11, #16:
Tree rings show a correlation both between temperature/humidity caused by ENSO as by the 11/22-years solar cycles, see: http://www.copernicus.org/EGU/cp/cpd/1/121/cpd-1-121_p.pdf
But even longer cycles are detectable in tree rings, see:
Click to access ext33.pdf
The effect seems more pronounced towards the poles, where growth is more restricted and changes in insolation may have their largest effect.
#30. I don’t have it available to me here, but if you look at the Hansen, et. al. paper on US surface temperatures they include all sorts of corrections to the data with time of observation the biggest. The net effect of all the corrections is a linearly rising correction of about 0.1 C/decade beginning in 1960. It may be that the raw surface temperatures aren’t too far off and the error is introduced by faulty data analysis.
The time of observation correction is very problematic. It is introduced as a smoothly rising linear correction based on a small test sample of a few weather stations. That would be fine if it were a physical phenomenon, but it’s not, it’s a social effect. The only right way to make a TO correction is to do it one station at a time when that station changes its time of observation.
Seems like models of our climate history might want to include the impact of cosmic rays on the earth’s cloud cover. For an general look see Henrik Svensmark site. For a long view see Nir Shaviv’s 2002 paper. That the hockey team seems to hate Shaviv and his work is starting to look like a plus. Cloud cover has to impact tree growth. Perhaps cosmic rays are the missing ingredient in the pie? I expect tree cores will only be useful to stir the mix but why not give it a shot?
Shaviv’s paper didn’t survive the tiniest, most cursory audit and was savaged by his peers back home.
The benefits of audit!
D
Re #40
I hoped Roger Bell would weigh in on it. Are we talking about the same paper? Who are some of the big names in astronomy who shot it down? Any of them pulling for him on this? How do I find out? Thanks
Dano,
I found an article by Stefan Rahmstorf on the 2003 paper. He does give Shaviv and Veizer a hard time. Shaviv has a reply on his site. Looks like they have a way to go before the spiral arm effect is accepted, if ever.
Rahmstorf et al. grabbed a pair of tigers by the tail. Shaviv and Veizer look to make a meal of them. Yow!
Dano? I thought you said he was refuted.
#27-“”Taken at face value, our reconstruction indicates that MWP conditions were nearly 0.7oC cooler than those of the late twentieth century.”
If we believe the instrumental record, your conclusion would make the MWP about as warm as the end of the LIA in 1880. That’s no warm period at all, and is contradicted by other physical data such as the freezing of the Thames during the LIA, and even at the end of it, but not during the MWP. One is tempted to conclude from your findings and results, rather, that tree ring climate proxies are dubious and untrustworthy.
Speaking of making cherry pies, I’d like to re-visit some comments of Esper. Here’s a quote from Esper et al [Tree Ring REs, 2003] previously posted up here
Here’s another amusing quote about cherry picking, this time by Esper:
Now what if any of the lead investigators has some preconceptions of what the “signal” is?
Re #38,
Paul,
The adjustments that Hansen discussed in the 2001 paper, abstract at http://pubs.giss.nasa.gov/abstracts/2001/HansenRuedyS.html , are further discussed at the USHCN page at http://www.ncdc.noaa.gov/oa/climate/research/ushcn/ushcn.html (but with the phrase “changed from midnight” corrected to read “other than midnight”) and summarized in the graph at http://www.ncdc.noaa.gov/img/climate/research/ushcn/ts.ushcn_anom25_diffs_pg.gif .
Your comments:
“The time of observation correction is very problematic. It is introduced as a smoothly rising linear correction based on a small test sample of a few weather stations. That would be fine if it were a physical phenomenon, but it’s not, it’s a social effect. The only right way to make a TO correction is to do it one station at a time when that station changes its time of observation.”
seem to be based on different perceptions of Time of Observation Bias (TOB), and TOB adjustments, than mine.
See http://www.john-daly.com/tob/TOBSUM.HTM for an overview of the topic, supported by a considerable amount of data.
The USHCN TOB adjustments are made month by month, and station by station, and seem quite plausible if the records of times of observation are correct.
I have been thinking of the r^2 versus RE issue and I have come to this conclusion: It’s possible that under these conditions the RE statistic is somewhat more indicative of skill than the r^2. In this case if you had a weak r^2, a strong RE could still compensate for it. However, I don’t see how anybody could support the idea that the r^2 statistic is completely useless to the point of not even computing/reporting it. I just can’t think of any legitmate situation where you could justify totally discounting the r^2 statistic.
If you are making cherry pie, none of this matters. It is simply terrible science. You can’t hand-select data that matches your theory. PERIOD.
Dear Steve,
“cargo cult sciences” is a term close to my heart. Yes, when we make the assumption that *every* new failure, discrepancy, or divergence is a reflection of a new kind mechanism, then we are surely doing cargo cult science.
All the best
Lubos
Re #45
Wouldn’t it be fascinating to actually give a large set of observations for a particular but unknown locale and ask these people to reproduce a temperature record?
They can pass a double blinded test, then I’ll be impressed.
Reblogged this on Climate Ponderings.
10 Trackbacks
[…] are personal emails not relevant to valid scientific concerns." Plucky, D'Arrigo is famous for explaining to the National Academy of Sciences that "cherry picking" is necessary if you want to make cherry pie. And as for what she thought of […]
[…] emails not relevant to valid scientific concerns.” Plucky, D’Arrigo is famous for explaining to the National Academy of Sciencesthat “cherry picking” is necessary if you want to make cherry pie. And as for what she […]
[…] need to pick cherries to make cherry pie”, D’Arrigo NAS panel […]
[…] an astonished panel that “you had to pick cherries if you want to make cherry pie” (see here). Although this evidence was highly relevant to the subject of the NAS inquiry and occasioned a […]
[…] is frequently referred to as “cherry picking”. In an amazing comment about tree ring studies, Roseanne D’Arrigo said if you’re going to make cherry pie you have to pick cherries. The issue is also discussed in […]
[…] Briffa’s original attribution of the “Decline” to a cargo cult (see for example here). The high-elevation samples occur in the medieval period and were not averaged with Little Ice Age […]
[…] during the joint Committee Hearing chaired by Representative Barton on the “hockey stick.” Steve McIntyre reported, “D’Arrigo put up a slide about “cherry picking” and then she explained to the panel […]
[…] during the joint Committee Hearing chaired by Representative Barton on the “hockey stick.” Steve McIntyre reported,“D’Arrigo put up a slide about “cherry picking” and then she explained to the panel that […]
[…] during the joint Committee Hearing chaired by Representative Barton on the “hockey stick.” Steve McIntyre reported, “D’Arrigo put up a slide about “cherry picking” and then she explained to the panel that […]
[…] during the joint Committee Hearing chaired by Representative Barton on the “hockey stick.” Steve McIntyre reported, “D’Arrigo put up a slide about “cherry picking” and then she explained to the panel that […]