Reader Bart S. has argued that Cook et al [QSR 2004] disposed of the "Divergence Problem", the name applied at the NAS panel on March 2-3, 2006 for the problem that, if the proxies do not record late 20th century warming, how can we be sure that they recorded potential earlier warming in the MWP.
Since many people here are alien to the scientific litterature on the topics they discuss, i would like to draw the attention to a paper published by Cook et al. in QSR 2004, I am sure it has been audited here before, but the audit seems to have failed to notice the fact that the paper speeks directly to the “divergency” issue. First by showing that the diergency is an issue not for the complete set of time series of Esper et al, but only for the northern ones, as also Briffa said in 1998, then showing that during medieval times this difference or divergency between mid and high latitude series does not appear. Bottom line – no evidence of MWP divergency.
I’ve not posted before on Cook et al [2004], but it’s not obvious to me that it represents an advance beyond Briffa’s cargo cult explanations for divergence.
Also see posts 529 and 570.
First, let me permit myself a snippy comment. The handling of statistical matters by the Hockey Team, including the calculation of confidence intervals, is about as "alien to the scientific literature" [statistics] as one could imagine. Before complaining about an alleged mote in our eye, it might make sense to examine the beam in the eye of the Hockey Team.
Second, I think that the scope of commentary on tree ring sites on this blog is commendably broad, given my resources. I do not claim to have "audited" every multiproxy study nor do I believe that it is my responsibility. I have not commented previously on Cook et al [QSR 2004], but am familiar with it, have a pdf copy handy and will make some comments in response to reader Bart S.
Third, Bart S, like many readers, seems to think that the idea of attempting to verify studies that are being relied upon for policy purposes warrants a snide comment. I am puzzled as to why people think this way.
Fourth, many multiproxy studies remain inaccessible to any form of verification. Briffa has published many articles on his 387 site network without ever disclosing the identity of the sites and has refused to provide this information. Cook et al. [2004] is a re-consideration of the 14-site network in Esper et al [2002]. Measurement data for most of the sites is not archived; data citations are not given for most of the sites and are inconsistent in other cases. Digital versions of the site chronologies used by Esper et al [2002] were not archived and were disclosed to me only last month and only after an intervention by Science in response to repeated requests (and probably only because of the publicity that I can shine on such refusals.) In addition, Osborn and Briffa [2006] provided some information on the Esper et al. network that was not previously available (although not necessarily consistent either.)
Finally, the issue of the Divergence Problem under that name was raised at the NAS panel. I’ve posted on many other aspects of the panel since then (and played in a squash tournament). If I’ve not posted on some paper that may be relevant, it hardly warrants a snide comment. There are limits on my time, priorities and energy.
Having said that, Cook et al. [2004] does refer to divergence issues and is worthwhile to comment in the light of the NAS panel. I might note that D’Arrigo, who presented at the NAS panel and who was asked to explain the Divergence Problem, was a co-author of Cook et al [QSR 2004] and did not seem to have at hand the explanation supposedly offered here by Bart S. It’s quite possible that she might have thought of this explanation afterwards and wished she’d mentioned it at the time. So I don’t mention her omission as a gotcha, but I’m merely observing that she had an opportunity to offer this supposed explanation and, to my recollection, did not do so (but I missed part of her talk as well).
Anyway, having vented a little, here is some information from Cook et al [QSR 2004]. Their Figure 6 (shown below) shows a difference between "Northern (55-70N) and Southern (30-55N) RCS chronologies, as illustrated below. The Southern sites of this 14-site network show a strong late-century growth pulse, while the Northern sites show a decline. Note that this information is only for the small 14-site network and not for the large 387-site Schweingruber-Briffa network. (I’ll look at the larger network from this point of view on another occasion.) Reader Bart S. characterizes this graphic as showing (1) that the "divergence" between modern instrumental temperature and ring width is a problem only for the North sites (blue) and (2) there was no prior divergence between the two RCS series in the MWP. Here’s how Cook et al. expressed it:
After AD 1950, there is clear divergence, particularly between the “North” and “South” subset chronologies. This is probably an expression of the well-documented large scale loss of growth sensitivity to climate in boreal forest conifers (Briffa et al., 1998a, b), a phenomenon that is not yet fully understood. The “South” chronologies may also show evidence of abnormally accelerated growth in the 20th century (Briffa et al., 1998a, b).
I’ll discuss possible reasons for "abnormally accelerated growth" at South sites in a moment. Cook et al go on to say:
Note that it [the RCS reconstruction] does very well at tracking the instrumental data on inter-decadal and longer timescales up to about 1982, after which the tree ring estimates systematically under-estimate the actual warming. This departure probably reflects the loss of climate sensitivity noted earlier in the “North” chronology shown in Fig. 6. Whether or not a similar loss of sensitivity has occurred in the past is unknown with any certainty, but no earlier periods of similar divergence are apparent between the “North” and the other regional chronologies. This result suggests that the large-scale loss of climate sensitivity documented by Briffa et al. (1998a, b) is unique to the 20th century, which argues for an anthropogenic cause ….
There’s a little bit more argument here than the pure cargo cult "explanation" of Briffa et al., but not much. There is no plausible candidate for an anthropogenic cause for the North Site Divergence is offered. If one proceeds to identify the actual South sites, one can quickly see that the Cook et al. do not explain the Divergence Problem and is not an actual advance beyond Briffa’s cargo cult.
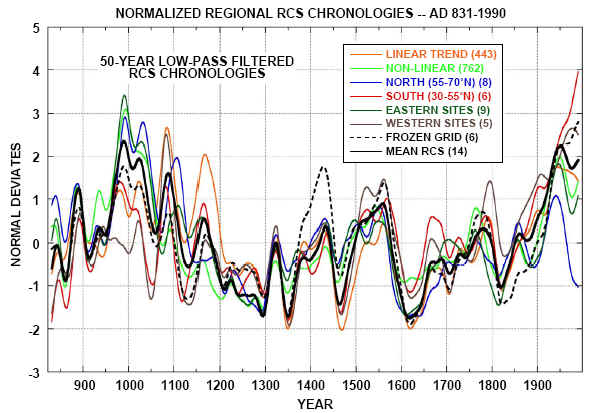
Original Caption. Fig. 6. Testing the regional robustness of the ECS tree-ring data. The “linear” and “non-linear” chronologies are the same as those shown in Esper et al. (2002). The other chronologies have been grouped by geographic location of the sites. The number of sites in each geographic group is provided in parentheses in the plot legend.
North and South Sites
Let’s start by identifying the North and South sites, since that will give some insight into the problem. Cook et al said that there were 8 North and 6 South sites. Using a 55 deg N dividing line, I identified 7 North sites and 5 South sites – with Jasper, Alberta at 52N being one of the "South" sites – a seemingly odd classification.) If the "Quebec" site is cana169, as indicated in Osborn and Briffa [2006], it is located at 55o 20′ N; perhaps Cook et al. classified this as a "South" site. (This identification in Osborn and Briffa may be incorrect and it’s possible that Esper et al used some other site – no accurate data citation exists in Esper et al 2002). Again a site on the shores of James Bay seems like a very odd inclusion as a South site, if it is, as its climate would be far more "northerly" than Gotland or Jaemtland.
| Northern Sites (55-70N) | Southern Sites (30-55 N) |
|
Mackenzie aka Campbell Dolomite Quebec (cana169?) Gotland Jaemtland Tornetrask Mangazeja Polar Urals Taimyr Zhaschiviersk |
Athabaska aka Jasper, Icefields Boreal (foxtail) Upperwright (foxtail) Tirol Sol Dav, Mongolia |
Whatever the ultimate identifications may be, the main issue here is that the South sites undoubtedly include two foxtail sites and the Jacoby Sol Dav, Mongolia site, which, between them, impart the 20th century growth pulse to the South sites in Cook et al. As readers of this site know, Bristlecones and foxtails are cousins on opposite sides of the Owens Valley in California. I presume that the "abnormally accelerated growth" affecting South sites, alluded to here by Cook et al. in very vague terms, is the cluster of issues surrounding bristlecones and other high-altitude low-latitude sites, including CO2 fertilization. Ironically, D’Arrigo et al [2006] excluded the two foxtail sites because they did not have a correlation to gridcell temperature (an amusing contradiction to Osborn and Briffa 2006, who claimed the exact opposite in an article published the same week.)
On this record, there does not appear to be a Divergence Problem for the South Sites. But the 20th century ramp here is largely created by two high-altitude low-latitude foxtail sites, where CO2 and other fertilization (phosphate, nitrate) issues have been specifically identified by specialists. This is presumably the "abnormally accelerated growth" alluded to in veiled terms by Cook et al, but not further discussed. The relationship between bristlecone/foxtail growth in the 20th century and temperature is arguably spurious. If so, one could reasonably conclude that the divergence between late 20th century growth at high-altitude low-latitude sites and North sites is due to fertilization impact on the South sites. One is then left with merely cargo cult explanations of the Divergence Problem at North Sites.
Aside from fertilization issues, the foxtail sites are in arid locations and moisture stressed as well. There is no ecological report on Sol Dav, Mongolia, but other Mongolia sites are described as precipitation proxies and, until some definitive information on the Sol Dav site is provided, I don’t see how it can be relied on as a temperature proxy. One could plausibly interpret the above record as showing increased 20th century precipitation in arid sites (Woodhouse discusses a "20th century pluvial" in the American Southwest). Millar et al 2006 suggest that the MWP was warmer and slightly drier. If the foxtail chronologies are moisture-stressed, then their attenuated MWP levels – which is inconsistent with the ecological niche information as an index of temperature – may simply be recording additional precipitation stress at these altitudes in the MWP – hardly inconsistent with Millar et al [2006].
In short, Cook et al 2004 resolves nothing. They provide no explanation of the Divergence Problem for North Sites that rises above cargo cult science. The foxtail site chronologies are additionally inconsistent with the ecological niche information of Millar et al [2006] for the Sierra Nevadas. The issue of whether these tree ring site chronologies can accurately recover medieval warming – the Divergence Problem – remains alive.
UPDATE – March 15
If one actually tries to verify the results of Cook et al. [2004], there are some serious obstacles.
First, as noted above, it is impossible to replicate the number of sites. For the calculations below, I’ve used 5 South sites, allocating the Quebec site to the North roster, both by definition of 55-70N and its logic as a North site.
Second, measurement data is either not archived or incomplete for many of the sites.
Third, the distinction between linear and non-linear trees in the original Esper et al article is not defined operationally and both Esper and Science have refused to provide an operational definition.
Fourth, even the RCS site chronologies were unavailable until a few weeks ago and even then, left out the Mongolia RCS chronology inexplicably.
For the calculations below, I’ve used the Mongolia chronology saved with Jones and Mann [2004] and the 13 Esper site chronologies provided to me by Science in February 2006 (after months of waiting.) I’ve defined North and South according to the table above(which differs a little from Cook et al).
The figurre below shows the average of available chronologies in the North and South rosters from 800-1996 smoothing using a gaussian filter of length 41.
Reader Bart S. has argued that the North and South chronologies are coherent prior to 1950 and diverge only afterwards – which he attributes to an unknown anthropogenic cause affecting North (but not South) sites. Here’s how Cook et al expressed the supposed coherence:
the low frequency signal in the mean RCS chronology and the various subset chronologies is generally robust, particularly over the AD 1200-1950 interval. The average correlation between the mean RCS chronology and the subset chronologies is 0.82 for the full AD 831-1990 period and 0.87 for the AD 1200-1950 period. Prior to AD 1200, there is more separation between the subset chronologies, which is consistent with the significant decline in replication described earlier.
First, the correlation between North and South chronologies calculated as above over the 1000-1850 period is only 0.09. The correlation in the period 1200-1950 is 0.44. In most cases, the correlation between smoothed chronologies is surprisingly lower than between the unsmoothed chronologies; the one exception is the 1200-1950 case. Given the interest in the MWP period, which is mostly before 1200, it’s disquieting that the supposed coherence between North and South chronologies does not extend to this period. Cook et al blame this on a lack of replication in the MWP period. However, their replication is no worse than many similar multiproxies, which have not cavilled at opining on MWP-modern relationships.
| Unsmoothed | Smoothed | |
| 800-1950 | 0.14 | 0.13 |
| 1000-1850 | 0.09 | 0.07 |
| 1850-1990 | 0.18 | 0.19 |
| 800-1990 | 0.12 | 0.10 |
| 1200-1950 | 0.44 | 0.55 |
Table 1. Correlations between Averages of “North”‘? and “South” Esper Chronologies.
Hockey Team statistical practice frequently includes turning a blind eye to autocorrelation. I’ve noticed that Hockey Team articles often report information on spectra. Econometricians tend to prefer to look at time-domain information such as autocorrelation functions. While spectra and autocorrelation functions contain the same information, they lend themselves to somewhat different perspectives. Here are the autocorrelation functions for the North and South averages with the autocorrelation function for the CRU NH temperature series also shown for reference.

Figure 3. Autocorrelation functions for North and South averages. Red- Autocorrelation function for CRU NH temperature.
As you can see, the North and South chronologies are VERY autocorrelated and the decorrelation time is VERY long. I wouldn’t attach much significance to the longer autocorrelations for the temperature series as the series is very short. But the greater persistence of the tree ring series is obvious. Cook et al have observed that the North and South series are correlated over one portion of their history, but not over other portions. They failed to observe the correlation over the entire length was very low. The “best” correlations that I’ve been able to replicate are much lower than those reported in Cook et al., where correlations exceeding 0.8 are thrown around. Is there anything here that is inconsistent with the behavior of highly autocorrelated series? I’ll bet that David Stockwell wouldn’t think so. (I’ve posted up digital versions of my calculations of the North Average and South Average here.)


6 Comments
Steve: 25 Comments follow from a backup by Doug Hoyt. The numbering has been lost in my copying.
“But the 20th century ramp here is largely created by two high-altitude low-latitude foxtail sites, where CO2 and other fertilization (phosphate, nitrate) issues have been specifically identified by specialists.”
Interesting. The Bristlecone site are about 70 miles away from one of the most intensely farmed and fertilized agricultual regions, the Central Valley. The famous Fresno Fog increases distant tree growth? Might check trees on the western side of the Sierra Nevada, the effect there would arguably be more prominent.
Comment by Follow the money “¢’¬? 14 March 2006 @ 5:46 pm
…(and played in a squash tournament)…
And haven’t told us the result. Is that because you are feeling grumpy, or feeling modest ?
Steve: The bad news was reported here
Comment by fFreddy “¢’¬? 14 March 2006 @ 6:00 pm
Thinking more about the Owen’s Valley and fog…there’s the famous Owens Lake dust storms of certainly anthropogenic origin.
Should have known you discussed it before!
Owens Lake Water Diversion for L.A. and Bristlecones
Could account for increased phosphate, etc. And doesn’t need to hike over the Sierra.
Comment by Follow the money “¢’¬? 14 March 2006 @ 6:00 pm
What would be the result if instead of using latitude for North-South, the clmatological growing classification was used?
(The one used for gardeners)
Comment by Gerald Machnee “¢’¬? 14 March 2006 @ 7:25 pm
4. The presence/absence of Jasper and Quebec don’t look like they make any difference. The results are driven by foxtails (and Jacoby’s Sol Dav, Mongolia.) How many times have we seen these series turn up like bad pennies? So how seriously should we take it if these series are now said to be magic bullets that prove that there exists some still unknown anthropogenic cause for the Northern sites? It doesn’t rise above cargo cult.
Comment by Steve McIntyre “¢’¬? 14 March 2006 @ 7:28 pm
And another point about fertilizers and desert lakes without outlets. How about potash? Owens lake had a history of extraction attempts for potash. I know they had a soda plant there in the past.
In the immediate area around the lake the vegetation is brushy or high steppe. Would be interesting to see if the east side Sierra trees upslope record increased tree ring growth. Could correlate with the White mountain bristlecones and dust/smoke from Lake Owens.
Comment by Follow the money “¢’¬? 14 March 2006 @ 7:38 pm
But, how did you do in the squash tournament?
Steve: Lost in the finals of the Canadian over-55 doubles, which was very good for me. Beat last year’s champions in the quarters and the top seeds in the semis and lost to the #2 seeds. Close but no cigar. Was bone tired after playing 4 matches in less than 48 hours, which is a lot at my age.
Comment by jae “¢’¬? 14 March 2006 @ 9:15 pm
“In short, Cook et al 2004 resolves nothing. They provide no explanation of the Divergence Problem for North Sites that rises above cargo cult science.”
This is not the issue – the issue is not whether the divergence is explained. The issue is that the same series that show divergence in 20th century do not show this in MWP, thus the argument that there might be a divergence in MWP is not supported by the data. The late 20th century divergence remains unexplained, but one should make it clear that the issue is not a general issue for tree rings, and that the issue is over-hyped by many here.
Comment by bart s “¢’¬? 15 March 2006 @ 2:10 am
But that’s just it, if nobody understands WHY divergence is happening, how can you be sure it wasn’t happening in the past, and we just can’t detect it? Maybe if the proxies were divided up into different bins, rather than say “North” & “Not so North” like they do now, divergence in the past WOULD be evident? Just because the selection of proxies studied here have divergence in the 20th century and not the 14th does not mean a different set of selections, maybe even from the same pool, would not show similar properties in a different time period.
Or put it this way, you get some proxies from location X that tell you temperature went up in 1492. You get proxies from location Y that tell you temperature went down in 1492. Now, you can claim that this means there was no average change in temperature in 1492 because they cancel out. But how do you know this isn’t just a case of divergence? Just because divergence is more pronounced now does NOT rule out its happening at other times.
Statistical methods will only serve to give meaning to these kinds of errors. That’s the last thing you want in a statistical analysis. Especially if finding nothing of significance (i.e. no trend in the middle ages) is in itself significant.
Comment by Nicholas “¢’¬? 15 March 2006 @ 2:37 am
It seems that the phrase “the Divergence Problem” is a euphemism for “not a temperature proxy”, or “misleading if used as a temperature proxy”.
Comment by JerryB “¢’¬? 15 March 2006 @ 3:20 am
Re 2,7 – Not bad at all. Take “em next year.
Comment by fFreddy “¢’¬? 15 March 2006 @ 5:26 am
“The issue is that the same series that show divergence in 20th century do not show this in MWP, thus the argument that there might be a divergence in MWP is not supported by the data. ”
How exactly do you know there was no divergence in the MWP?
The point of the “divergence problem” is the divergence between the tree ring record and the thermometer-based “instrumental” temperature record – if there are no thermometers…
Comment by John S “¢’¬? 15 March 2006 @ 5:26 am
Bart, I think that John S has pretty well nailed this point.
Comment by James Lane “¢’¬? 15 March 2006 @ 5:43 am
re 9&13. Nicholas, go and read Cook´s paper. He has “binned” the data as you suggest, and the results are quite convincing. The 20th century pattern is not seen in earlier times, thus tree-rings seem to work in the same manner as in the 18th and 20th century prior to the klast decades. It is the last 50 years that are odd, and only at high lat, not elswhere. People are therefore making too much out of this and the issue is over-hyped. For what purpose one can only guess…The divergence in the 20th century has a geographical pattern. There is no such pattern in the preceeding centuries of the last millennium. If one is concerned about the issue of the divergence in some areas in the last decades, one should be equally aware of the times and areas when there is consistency.
Comment by bart s “¢’¬? 15 March 2006 @ 6:53 am
Why do they even go back 500 or 1000 years into the past, when they only have accurate temperature data for the past 100 or so years? Aren’t they over-complicating their task?
They are attempting to not only predict the future, based on the past 100 years, but also to predict (or “post-dict”) the past. They don’t have data for the future, nor do they have accurate data for the past.
Half a degree, 1000 years ago? When temperatures fluctuate by 10 degrees, or more, day-to-night/day-to-day/month-to-month/season-to-season?
Do they think they’re gods?
Comment by BradH “¢’¬? 15 March 2006 @ 7:16 am
I’m sorry but I still don’t see how it’s valid to assume that tree rings are good temperature proxies if, for the only period where we have both instrumental and proxy data, much of the proxy data fails to track the temperature for a large portion of that period.
What makes the assumption particularly startling to me is this: we only have instrumental data from the last 150 years or so. Also, if we’re going to have any major effect on the climate, it will also be during the last 150 years or so. Therefore, deviation of proxies from instrumental data can *always* be excused as some kind of anthropogenic forcing. However, where is the evidence that is the case? Just because historical proxy data correlates with other proxies does NOT prove that ANY of the proxies are actually accurately reflecting your chosen piece of data.
I’ve read some of Cook’s paper and it didn’t address the quandry above. It’s the same quandry that we get out of the “bristlecones” and other proxy series again and again, which is that they don’t seem to be accurate proxies now, so what makes us think they ever were accurate proxies? In the absense of strong evidence to suggest they are good proxies, I think the prudent course of action for anyone is to assume they are not.
I grow sick of this. The only reason many proxies seem to be considered temperature proxies is because they correlate with temperature. Yet many of them actually do not! In the absense of a very, very good reason for that I can’t understand defending them. “Unknown anthropogenic forcings” (i.e. fudge factor) is not a sufficiently good excuse.
Comment by Nicholas “¢’¬? 15 March 2006 @ 7:22 am
“Half a degree, 1000 years ago? When temperatures fluctuate by 10 degrees, or more, day-to-night/day-to-day/month-to-month/season-to-season?”
Wow, now that IS a disingenuous comment. Dave, I KNOW you know the difference between weather and climate and that you KNOW variation between years, or decades, is way less than 10C on a global or hemispheric basis.
“Do they think they’re gods?”
No, do you think Steve is one?
Steve: Peter, please stop ragging.
Comment by Peter Hearnden “¢’¬? 15 March 2006 @ 7:27 am
Sorry, I mean Brad not Dave – doh!
Comment by Peter Hearnden “¢’¬? 15 March 2006 @ 7:28 am
bart s, the “divergence” problem is so ubiquitous it even occurs on basically the same site among the same species, let alone over large geographical areas:
http://www.climateaudit.org/?p=478
Comment by beng “¢’¬? 15 March 2006 @ 7:44 am
#14 ROFLMAO… if there are no records to diverge from then there isn’t a problem then Bart? Look even Hughes admitted at the NAS that there is no way of knowing whether there has or hasn’t been divergence prior to the establishment of an instrumental temperature record in the 19th Century. In that case, how does anyone actually trust the proxy record as being remotely accurate?
Comment by John Lish “¢’¬? 15 March 2006 @ 7:55 am
16. I agree. There is now a tremendous amount of evidence that tree rings are simply not generally suitable as temperature proxies. It’s time to “move on.” There are other proxies that are much more reliable, such as the Sargasso Sea proxies. The problem is that if these good proxies are used, they clearly show a MWP and LIA, thereby spoiling the hockey stick and clearly showing that we very well may be experiencing part of one of the normal warming and cooling cycles.
By the way, it is relatively easy to demonstrate statistically that the averaging of proxies with a lot of red noise (caused primarily by large dating errors in tree ring data) will “wash out” any long-term non-linear trends, leading to a “hockey stick shaft.” The greater the number of such proxies included in a “reconstruction,” the straighter the shaft gets. Individual proxies make much more sense than “averages.”
Moreover, there are some good non-linear models that correlate very well with the better proxies, such as the Sargasso Sea proxies.
Comment by jae “¢’¬? 15 March 2006 @ 11:05 am
Things like the Sargasso Sea proxies are not necessarily magic bullets for millenial reconstructions. Their accumulation is slow. When you examine relative dating, there’s lots of wiggle-matching which is hard to prove.
Comment by Steve McIntyre “¢’¬? 15 March 2006 @ 11:32 am
Steve: I need to get a paper to you. How can I do it?
Comment by jae “¢’¬? 15 March 2006 @ 11:36 am
First off I apologize in advance if this has already been discussed. Traveling and so I don’t get to read everything as thoroughly as normal.
But Steve has started to use the term “Cargo cult” I like the sound of it, but didn’t know the real meaning, So I searched, and since this is the first result I’m sure others have done the same and found it, I’m sure Steve knows about it and all, but I so enjoyed reading it, and it is so directly applicable to all of the discussions here I figured I’d post it for those that may not have seen it.
http://www.physics.brocku.ca/etc/cargo_cult_science.html
Feynman I’m sure could have used direct examples from climate research if he’d done the talk now instead of 1974.
_____________________________________________________
“It’s a kind of scientific integrity, a principle of scientific thought that corresponds to a kind of utter honesty–a kind of leaning over backwards. For example, if you’re doing an experiment, you should report everything that you think might make it invalid–not only what you think is right about it: other causes that could possibly explain your results; and things you thought of that you’ve eliminated by some other experiment, and how they worked–to make sure the other fellow can tell they have been eliminated.”
R Feynman
Comment by ET SidViscous “¢’¬? 15 March 2006 @ 11:52 am
I’ve updated this post to show my emulation of the North and South Site averages, which do not show the same amount of reported coherence as Cook et al. The correlation over the full period is very low, but is relatively high in a selected subperiod. Also I’ve plotted up the autocorrelation functions of the two series.
Cook et al indirectly acknowledge a lack of coherence in the MWP, but do not report the results, which are worse in this emulation than people would expect from reading Cook et al. Whether anything rises to statistical significance relative to similar autocorrelated series is not discussed in Cook et al. – hey, this is the Hockey Team. I’ll bet that David Stockwell could answer this pretty quickly. If not, I’ll return to it on a later occasion.
Comment by Steve McIntyre “¢’¬? 15 March 2006 @ 12:19 pm
That Feynman essay is great. Should be required reading for all scientists and wanna-be’s alike.
Now wait a minute. The proxies are no longer sensitive to temperature? And we are using them as temperature proxies? But they are wonderful proxies for temperature 1,000 years ago? And we know this how?
I concur on the Feynman essay. He is sorely missed. The tale of Millikan experiments should be a cautionary tale for anyone claiming “independent research”. After giving a public lecture he was asked whether he thought his theory of QED would still be in operation in 10-20 years. He could have said “I think so” or “I hope so” or “Its working pretty good now so probably” thereby expressing his personal investment in the theory. His reply was simply, how can I tell you what I am going to know in 20 years?
The Divergence Problem was something discussed at the NAS Panel. Cook et al was cited by the NAS Panel as a magic bullet for the Divergence Problem (see references in my post on the NAS Panel.) This post is a pretty good refutation of using Cook et al 2004 as a solution for the Divergence Problem. If strip bark samples can’t be used as a temperature proxy, then this post pretty much destroys Cook et al. The proprietor of this blog should really do something about publishing this analysis.
When I re-read this post, I must confess that I could barely remember writing it. I had a similar experienc when I was googling and saw an interesting statement on the internet about the very different weights for two Colorado PIFL series in MBH a few miles apart, one with HS and one without – I’d forgotten all about it, but it was an interesting observation and worth incorporating in one of the zillions of papers that I’m supposed to write. (But don’t blame the blog; if I’d not written this down for the blog, I’d have still made the calculation and then totally forgotten about it.)
On a lighter note.
A friend of mine was working on a lens calculating program. HE went to the standard Optical reference, a published collection of papers in one volume.
He was working through it to find the relevant math. He came across one article that was particularly helpful, and he found it very easy to understand. So he went looking for the authors so that he could find more material.
Well then it made sense why it was so understandable. He had written it years previously with a colleague.
2 Trackbacks
[…] appears that Cook et al 2004 is relied upon in this article. I discussed this article previously as More Cargo Cult. It will be interesting to see whether D’Arrigo, Wilson et al considered the issues raised in […]
[…] made a detailed analysis of the Cook network in March 2006 here – a post in which I displayed (and commented on) the same Cook graphic in Angliss’ post […]