The chronologies for Taymir in Esper et al [2002] and Osborn and Briffa [2006] differ – not a whole lot but enough to be noticeable. Esper provided measurement data for Taymir, while Osborn and Briffa have refused. The letter from Science said:
The other three series contain some non-identical tree-ring series derived from the same sites; thus the series they used can not be reproduced using the Esper et al. data; there are fewer tree cores in the Esper et al. data. The source for these three series is Briffa (2000).
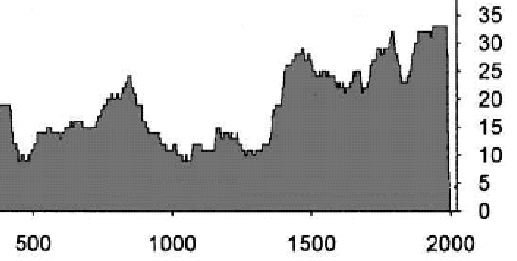
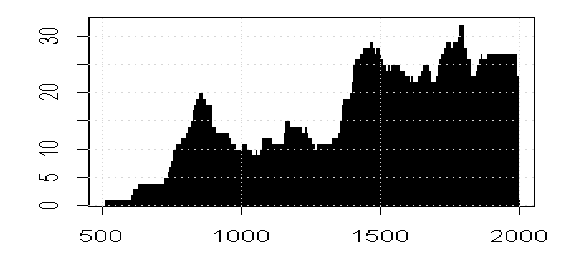
Both Esper and OB cite Naurzbaev as the source of the data. (Naurzbaev’s articles are ones that I’ve recommended as good ones.) Naurzbaev et al [Holocene 2002] have a graphic showing the count of ring width measurements by year; so I plotted up the corresponding information from Esper’s measurement file with curious results.


Top : Taymyr core count from Naurzbaev et al; above – core count from Esper measurement file (March 2006). Image prettied up by Mike Carney below.

The visual match is exact except at the beginning and end of the series. At the beginning, Esper has not used some of the earlier data. It’s the end that interests me. Here Esper has apparently not used 6 cores, which was not apparent from the report in the chronology file. These 6 cores probably account for the difference between Esper and Osborn-Briffa. It’s not the use of completely different files. So the question is: why did Esper exclude these 6 cores? If Esper excluded these 6 cores, should Briffa have excluded them as well?
An observation made in Esper et al [2003]:
When using RCS, one has to decide whether differences between subsamples reflect (i) climatic signals and should be preserved or (ii) non-climatic signals and should be eliminated. If significant differences occur between various subsamples, some discussion of the impact these differences will have on the resulting chronologies would be useful.
Quite so. Another observation from Esper et al [2003] which I’ve mentioned before, but is worth repeating:
Before venturing into the subject of sample depth and chronology quality, we state from the beginning, “more is always better”. However as we mentioned earlier on the subject of biological growth populations, this does not mean that one could not improve a chronology by reducing the number of series used if the purpose of removing samples is to enhance a desired signal. The ability to pick and choose which samples to use is an advantage unique to dendroclimatology. That said, it begs the question: how low can we go?


16 Comments
The patterns of behaviour are shameful. keep the presrue on, Steve. a real article in a journal every now and then would be nuce too….:)
It’s impossible to see/get any use out of the figures given how they run under the sidebar.
Actually I’m multibrowser. I use Netscape for ClimateAudit and other sites I regularly go to but use Explorer for my ‘default browser’ to come up when a program needs to use a new browser window. No logic to the division of labor, that’s just what I’ve decided to do.
But, but, Bill Gates (who owns Explorer) just feted the world’s head commie, that chinese dude. You’re going to have to switch to something RWB.
The figures don’t disappear under the sidebar but I looked using both Firefox and Exploder (personally I hate using exploder since it downloads spyware like flies attracted to something rotten) but still the figures look odd. The left hand one looks like it has stalactites hanging down and I can’t tell what the Y axis units are.
The main point though that I was going to make was the comment by Esper. How on earth do you tell what is a real climate signal and what is not? On what rationale basis are series eliminated? The only rationale I have heard is that the few series repeatedly used (out of potentially hundreds available) are that they reflect modern warming. Well then why do most (>90%?) not show this warming? Talk about chosing the ones you want to show the answer you want to get! The rational question is how do you know that these few ‘super climate sensitive’ series have always been super sensitive throughout the whole time period?
This selection of cherry picking data would just be completely unacceptable in a physics experiment. You must have some rational basis for eliminating data from consideration and I am not seeing it. I am perfectly willing to accept that bristle cone pines (to chose a random example) display a good linear relationship between tree ring width and mean external temperature whereas oaks, larch and other species do not and so can be eliminated from consideration on good, rational biological grounds IF someone has done a rigorous study that shows that these relationships hold for one species but not for others.
But where are these fundamental studies? All we are seeing at the moment is that some series (even before the extremely dodgy statistical treatments) are selected because they show the expected behavior. I can even understand the rationale that a few are chosen because they do calibrate against (so called) modern warming and that allows you to have more confidence that they tell you something meaningful about the past temperature but I come back to the point then that why do most not show this behavior? How do you know that you are not choosing the random noise series that happen to correlate by chance with what you think should be happening? the fact that only a small number out of a large number of series are selected makes me think that this is precisely what happens.
(I know this is exactly what Steve has shown far more rigorously but I like to say it out loud for my own understanding).
IL, I’ve been asking those questions for a year. I think Steve has been asking them for over two years. There appear to be no answers.
They are*** treehuggers what do you expect. They would die if you tried to make them handle some Hamiltonians.
IL, the stalactites came from clipping out the graphic from a bigger figure; they don’t have anything to do with the count.
As to the super-sensitive data, Hughes updated the Sheep Mountain bristlecones in 2002. We haven’t heard anything about it. As I’ve mentioned on numerous occasions, every stock promotion instinct in my body tells me that if they’d had “good news”, we’d have heard about it. Same with Lonnie Thompson’s Puruogangri core taken in 2000. Nothing for 6 years – where is it? Did the dO18 go down?
There are answers, jae, but they sure aren’t scientific:
1. Didn’t you once work for an oil company?
2. We know how to do these things and you don’t. Get lost!
3. You once made a mistake therefore I don’t have to answer you.
4. You’re mean, bringing up these things. I’m not going to talk to you again.
5. Where’s your degree in hockeystickistry?
6. We’ve already answered that in a paper submitted to the Journal of Ilreplicatable Results. Therefore we’re not going to reply further.
7. We’ve moved on. Would you like to talk about our latest opus in the Webweavers Journal?
Etc., etc.
Who kidnapped TCO and replaced him with an equally loud and obnoxious, but even more foul-mouthed version?
Me, me.
I don’t remember posting the #12 text as written. Did JohnA or Steve write that under my name? Better to just ban me or snip me. Putting words in my mouth is dishonest.
Or maybe I have an imitator.
Or maybe I did post it and don’t remember it.
Considering the language you were using this morning, TCO, I’m surprised you remember anything.
I remember the other posts. I was emotional.
Tired and emotional more like.
Dave
The 8th answer
There is a paper which will published next year which will answer your question.
(It hasn’t been published yet)