Several people have written to me about today’s article in Nature by Treydte et al (including Esper) announcing that the 20th century is the wettest period in the millennium. Treydte et al state:
Comparison with other long-term precipitation reconstructions indicates a large-scale intensification of the hydrological cycle coincident with the onset of industrialization and global warming, and the unprecedented amplitude argues for a human role.
Nature published a special covering review of the Treydte article by Evans, which concurs with this as follows:
Furthermore, it seems that recent changes in precipitation patterns probably exceed the range of natural variability estimated for the past several hundred to one thousand years.
It’s hard to keep up with the extended Hockey Team, but here is a report from yr obedient servant. With the Hockey Team, nothing is ever quite what it appears on the surface and out text today provides an interesting oportunity to reflect on Soon and Baliunas, or rather the mugging of Soon and Baliunas by the Hockey Team.
Treydte et al [2006]
Treydte et al present new analyses of dO18 values in junipers from northern Pakistan (I’ve been to this area – I heard the news of Bobby Kennedy’s assassination in Gilgit in 1968 on a shortwave radio so I can pin down the exact date that I was there.) Treydte et al:
We have evaluated precipitation changes through four, annually resolved oxygen isotope ratio (d 18O) chronologies from juniper treering cellulose (Juniperus excelsa, J. turkestanica). Three of these records cover the twentieth century and one extends back to AD 828. The latter was used to reconstruct precipitation variability over the past millennium.
They argue through correlation analyses that tree ring dO18 has a negative relationship to precipitation and a negligible relationship to temperature:

Figure 1 from Treydte et al., showing the negative correlation of dO18 with precipitation.
They then use this relationship to make a precipitation reconstruction for the past millennium, shown in the graphic below – note the inversion of the dO18 chart between figures: nothing wring with this, it’s just to visualize the inverse relationship a little better. A couple of quick thoughts on this graphic: (1) while the promotion of the Treydte et al article suggests that the the argued precipitation change is attached to anthropogenic causes, the change in level in the reconstruction (squinting at it) seems to occur in the second half of the nineteenth century and had relatively little change in the 20th century; (2) the change in precipitation level, such as it is, does not seem to consist of increased maxima in the 20th century but reduced minima i.e. fewer droughts. If the change in precipitation is caused by anthro factors and its impact in China and Pakistan has been fewer droughts in the 20th century (and I’m old enough to remember parents worrying about people starving in China), then it’s not obvious that this is a negative impact on the human race. This is not to say that further increases won’t have a negative impact, but that, if I may put it this way, the impact of global warming on net human welfare in some sense is nonlinear and non-monotonic. I.e. while Jonathan Overpeck and others predict negative and even catastrophic consequences predicted for the future – and I’m not arguing against this point here- I’m merely observing that the reduction of droughts indicated in the Treydte et al record would have to be construed as a positive consequence on any reasonable ground. That could have been observed in the Nature article, but Treydte et al didn’t seem to think it worthy of mention.
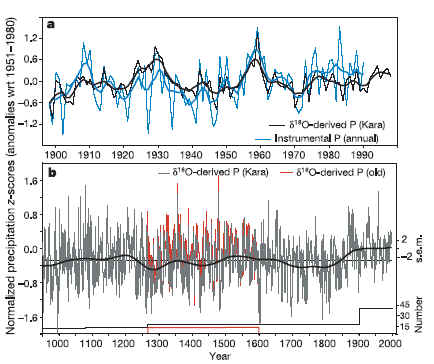
Figure 2. from Treydte et al, showing the precipitation reconstruction.
After presenting their new information, Teydte et al compare their results to other precipitation reconstructions in the following figure and it is this comparison which is used to justify the claim that "large-scale intensification of the hydrological cycle coincident with the onset of industrialization and global warming, and the unprecedented amplitude argues for a human role". I’ve bolded a couple of precipitation reconstructions which I’ll discuss below.

Original Caption to Treydte Figure 4. Precipitation reconstruction for northern Pakistan and long-term precipitation variations for different regions in the northern hemisphere. a, Tree-ring d 18O-derived reconstruction. b, Annual precipitation reconstruction (July–June) from tree-rings in northeast China [17]. c, Southwest Asian monsoon intensity from Globigerina bulloids in the Arabian sea [12]. d, Drought reconstruction from tree rings in western USA [23]. e, Spring–summer precipitation reconstruction from tree-rings in southern Germany [24]. f, Regional to hemispheric temperature variations according to ref. 11 (red, western Central Asia), ref. 4 (blue), ref. 5 (black) and ref. 8 (green). Records are normalized over their individual periods and smoothed using 150-year splines.Numbers in a–e refer to the last year of the records, and the black dashed line to the shift from negative to positive precipitation anomalies in the Karakorum record.
Soon and Baliunas 2003
Let’s turn the clock back to 2003 and consider the response by the Hockey Team to Soon and Baliunas 2003, much of which focussed on the alleged confusing of temperature and precipitation proxies. I’m not going to discuss whether Soon and Baliunas actually committed the alleged confusion; I’m also not going to talk about the use in MBH98 of actual precipitation measurements (oe even the notorious MBH98 relocation of French precipitation records to New England). I’m going to limit myself to describing policies stated by the Hockey Team in the strongest possible terms about the need to distinguish precipitation and temperature proxies. I’ll tie this together later.
Mann and a big panel of the Hockey Team led off the assault against Soon and Baliunas in EOS, saying:
In drawing inferences regarding past regional temperature changes from proxy records, it is essential to assess proxy data for actual sensitivity to past temperature variability…The existence of possible underlying dynamical relationships between temperature and hydrological variability should not be confused with the patently invalid assumption that hydrological influences can literally be equated with temperature influences in assessing past climate (e.g.,during Medieval times).
While this is not a particularly nuanced statement, Mann’s statements in public and media discussions ratcheted this up even more. Consider some of Mann’s comments about Soon and Baliunas to the U. S. Senate Committee here.
No, the work of me and my colleagues does not follow the flawed approach used by Soon and Baliunas. It is fundamentally unsound to infer past temperature changes directly from records of drought or precipitation…
numerous climate scientists have indicated (see same article) that Soon and Baliunas misinterpreted evidence of drought or precipitation as evidence of temperature changes,….
In short, the analysis by Soon and Baliunas is unsound because (a) they inappropriately interpreted indicators of past precipitation as evidence of past temperature changes, …
Drought and temperature are essentially independent climate variables. The papers by Soon and Baliunas seem not to recognize this fundamental
The Hockey Team drew a line in the sand that it was absurd to use the same record as both a temperature and precipitation proxy – again leaving aside whether Soon and Baliunas actually did this. The position taken in Mann’s Senate Committee testimony was also taken by numerous scientists in a contemporary article in the Chronicle of Higher Education. Mann’s criticisms were described in that article as follows:
It is absurd to take wetness or dryness as proof of abnormal warmth, the critics argue. " A paper using that kind of methodology could not be published in any legitimate climate-research journal unless something was severely wrong or suspicious with the review process," says Virginia’s Mr. Mann, lead author of the Eos paper, whose own studies on climate were heavily criticized by Mr. Soon’s team in the Energy and Environment paper. Mr. Soon and Ms. Baliunas improperly used data sets compiled by other researchers, says Mr. Mann. "Many people feel betrayed by the misrepresentation of their data."
The Chronicle of Higher Education article went on to report that "scientists contacted by The Chronicle complained about the way their work was cited by the Harvard-Smithsonian team." Peter deMenocal:
Peter deMenocal, an associate professor at Columbia University’s Lamont-Doherty Earth Observatory, used sediment records off the coast of Africa as a proxy for ocean-surface temperatures. He says Mr. Soon and his colleagues could not justify their conclusions that the African record showed the 20th century as being unexceptional. "My record has no business being used to address that question," the Columbia scientist says. "It displays some ignorance putting it in there to address that question."
David Black took a similar position. Note carefully here the nature of Black’s record:
David E. Black, an assistant professor of geology at the University of Akron, says Mr. Soon’s group did not use his data properly in concluding that the Middle Ages were warm and the 20th century ordinary. Mr. Black’s record of plankton in ocean sediment collected off Venezuela provides a proxy record of the strength of trade winds from 1150 to 1989. But "winds don’t meet their definition of warm, wet, or dry," he points out.
The Hockey Team mauling of Soon and Baliunas was quickly disseminated in blog world. Here’s one example from a quick google:
Meanwhile, Mann and 12 other leading climate scientists wrote a blistering critique of Soon and Baliunas’ paper in the American Geophysical Union publication Eos, noting, among other flaws, that they’d used historic precipitation records to reconstruct past temperatures”¢’¬?an approach Mann told Congress was “fundamentally unsound.”
Moberg et al 2005
Reviewers of Treydte et al 2006 would presumably be familiar with another recent multiproxy study in nature, Moberg et al 2005. If such reviewer examined the Moberg SI, he would have noted the following graphic applied as a temperature proxy.

From Moberg et al. SI
If you check the references and even compare the graphs, you’ll see immediately that Moberg et a l #11. Arabian Sea is precisely the same record as Treydte Figure 4c "Monsoon (SW Asia)", other than the Moberg record goes earlier through splicing a couple of cores. This record is not an incidental record in Moberg – it is one of the two strongest contributors to any HS-ness in Moberg. Here it should be noted that the proxy portion of Moberg is already at a knife-edge, with the MWP level just barely below 20th century benchmarks. (Such a fine distinction is very worrying to me – the first people to pick up on Enron were short traders who noted the very thin profits every year on huge capital employed. Any time you see thin differences, such as the thin differences betweeen Moberg MWP and Moberg modern, all aspects of the selection process need to be examined, which, of course, is impossible without a statement of selection criteria.)
I drew attention to the use of this record in Moberg here in February 2005 shortly after publication, pointing out:
One of the two strongest contributors to higher temperatures in Moberg’s 20th century proxies is higher incidence of subpolar glob. bulloides foraminifera in the Arabian Sea off Oman, actually a direct indicator of cooler SST.
I also discussed this proxy (together with others) here showing the extreme non-normality of this proxy – which is probably not consistent with Nature’s statistical policies, seemingly unenforced in paleoclimate.
So is the percentage of Glob. bulloides offshore Oman a temperature proxy or a precipitation proxy? Shouldn’t the Hockey Team be dumping all over either Moberg et al or Treydte et al for getting it wrong? Maybe David Black, who dumped all over Soon and Baliunas for using a wind proxy, should weigh in here. I’m having a little troble understanding why Glob. bulloides in the Caribbean should be interpreted in a fundamentally different way than in the Arabian Sea. But hey, they’re the Hockey Team.
Dulan Tree Rings
The second precipitation comparison in Treydte et al is "b. Precipitation (northeast China)". The citation, Sheppard et al., decribes a precipitation reconstruction from junipers in northeastern Qinghai. Here’s their figure 1 showing the location of the Qinghai junipers. You will notice that Dulan is on the map (also Dunde of Dunde ice cores).

Original Caption to Sheppard et al. Fig. 1 Map of People’s Republic of China (A) with the boundary of Qinghai Province. The white rectangular region B indicates an enlargement of northeastern Qinghai, where triangles indicate living treering sites, the star indicates the site with archaeological wood, the closed circle indicates the meteorological station at Dulan, and the cross indicates the Dunde ice cap (Thompson et al. 1989). The white rectangular region C is area I of moisture indices of Gong and Hameed (1991), and the region D indicates an area of Shiyang River catchment (after Chen et al. 1999, with modifications)
Alert readers will recognize that we’ve previously questioned the use of Chinese junipers as a temperature proxy on this blog. Dulan junipers were one of the important components creating modern-MWP differential in the Yang et al composite, commonly used in recent multiproxy studies (e.g. Moberg, Osborn and Briffa, Mann and Jones 2003). I discussed this last summer here, saying:
This climate-growth relationship indicates that moisture stress in growing season is a major limiting factor to tree-ring growth. This result is in general agreement with that observed in dendro-climatological studies of the same species in other areas of the Qinghai-Tibetan Plateau [Zhang and Wu, 1999; Brauning, 2001; Huang et al., 2002], suggesting that the annual growth rings mainly reflect variations in regional spring precipitation.
Yang et al. say that the junipers are correlated to autumn temperature based on Kang et al [1997] a Chinese-language publication which is inaccessible to me. There is a later western publication, which seems to be by the same group of authors: Zhang et al, 2003.A 2,326-year tree-ring record of climate variability on the northeastern Qinghai-Tibetan Plateau, GRL, 30(14), 1739, doi:10.1029/2003GL017425
Dr. Yang posted up a comment on the above thread criticizing my statements on Dulan tree rings as follows:
About Dulan tree-ring width chronology, new width data from nearby region (Shidalong) representing winter temperature change are consistent with Dulan series usded in our paper in trend variations, giving strong evidence that Dulan chronology is an indicator of tempeature change at least.
However, the position of Sheppard et al seems to be that they are precipitation proxies. But I’m not trying to say which they are. I’m merely trying to say that they can’t be both.
In addition to their use in Yang et al, Dulan junipers under the alter ego of "Qilianshan tree rings" attributed to Wang et al 1983 were used in both Crowley and North 1991 (yes the North of the NAS panel) and Crowley and Lowery 2000. Consider the discussion here, which was applied in IPCC 2AR in 1995.
If there’s any question in your minds about whether these trees are temperature or precipitation proxies, consider the following image of a Dulan juniper from here . (I’d noticed this image a couple of years and couldn’t find it – it turned up by a google of Qilianshan Dulan)

I don’t think that you need to be dendrochronologist to think that this tree is more likely to be a precipitation proxy than a temperature proxy. But regardless of which it is, under Hockey Team policies for Soon and Baliunas, it can’t be both. If it’s a precipitation proxy (and I have no trouble accepting this view), then the use of Dulan junipers as a temperature proxy in the Yang composite (with its knock-on impact on Moberg, Osborn and Briffa, Mann and Jones etc.) or their direct use by Crowley as a temperature proxy should be condemned by the Hockey Team in terms equally as vociferous as those used to dump on Soon and Baliunas.
References: [fill in]


143 Comments
In Figure 2, there are 2 high bumps at around 1000 and 1100 which exceed the 20th century but are decreased by the averaging curve.
#1 – the difference is that the 20th century record, however it[s calculated, lacks negative (drought) values. How awful that must be for the people of Pakistan and China.
re #1
Gerald, I’m going to go on a limb here and say that there is no statistically valid information at all, in figure 2b
Re#2,
China seems to have had its share of disastrous flooding this century (not sure how much is really due to increased rainfall vs dams, etc), so maybe they’d prefer a little drought now and then.
It would seem to me that local precipitation would generally follow global temperature (More temperature = more evaporation = more rain, even far away) whereas local temperatures wouldn’t necessarily follow local precipitation (or global temperatures either). So if it were ultimately proven that the use of what seem to be local precipitation proxies, like bristlecone pines, actually do follow global temperatures, Mann would be both vindicated and refuted!
I thought that GW was supposed to increase the intensity, and frequency, of extreme weather events, most notably droughts?
Mark
India is rather close to Pakistan and just a few days ago, the following news report appeared in http://www.zeenews.com/znnew/articles.asp?aid=290686&ssid=26&sid=ENV where Lal claims no changes in precipitation outside of normal variability.
No climate change: IMD
New Delhi, Apr 25: The clamour over climate change the world over notwithstanding, the country’s weather agency believes that variation in rain and temperatures over the country being experienced over the years fall within the “natural variability”.
“We are keeping a watch. We are not denying…. It (the variations) are still under the natural variability,” Director General of the India Meteorological Department Dr B Lal told reporters here today.
There has been no significant change in terms of temperature and rainfall on year-to-year basis, he said.
Monsoon was bad in 2002 while prediction was perfect in 2003. In 2004, there was a little deviation from the predicted rainfall but July rainfall that year was perfect, he said.
Similarly there has been a change in temperature of only 0.4-0.5 degrees. But it has been in pockets – some pockets have undergone cooling, others have undergone warming, he said.
“For example, when one enters Delhi from other areas, there is a general feeling of warming, but this is due to population (density),” he said.
“Thus, there is no clear cut signal…We are keeping a watch over temperatures,” he said.
Lal said there had also been no increase in intensity and frequency of tropical cyclones. Since October 1999, there had not been any super cyclone in the country.
Last year there were only five disturbances, of which two became cyclones of marginal value, he said.
Scientists in the country have been claiming that evidence of climate change is all too evident and the government should initiate studies in the area.
Haven’t you mentioned somewhere that dO18 is supposed to be a temperature proxy, though as is usual, with an ambiguous relation to temperature?
What are the chances that Figure 2b is just (correlated) noise? Sure looks like it to me. Take away the smoothed average and you’d never assign any kind of trend to it. A plot of the amplitude distribution of the spikes would be an interesting diagnostic along with a Hurst exponent.
If they say that D018 is negatively related to precip, then it has to be non-linear, because zero precip means zero growth.
Back to Bristlecones. Maybe the Hockey Team can get them in the back door by saying that while Bristlecones may not be a temp proxy, their anomalous growth since 1850 was due to changes in precip.
Thanks for this research report, Steve, but it makes the climate change propaganda literature so tangled now that I might as well be reading Sanskrit. It’s like the time that a symphony orchestra was playing a particularly grating and atonal modern piece when a member of the audience leaped out of his seat and shouted “Stop! I confess!”
Steve, you silly sausage.
Mikie clearly said that you can not use precipitation proxies as temperature proxies.
Using temperature proxies as precipitation proxies is no problem.
Well, that seems logical in Hockey land.
Steve said:
” don’t think that you need to be dendrochronologist to think that this tree is more likely to be a precipitation proxy than a temperature proxy ”
Why? It looks to me like it is growing on the margin of an oasis of some kind. If its root system is tapped into a groundwater source, which seems likely if that is in fact an oasis, then why would precipitation be limiting for its growth?
Lee,
Based on what?
It looks to me as if the location of photographer was based on creating a good photograph.
The existance of an underground aquifer is a possible assumption, but lacking any additional information, it is pure speculation.
“I also discussed this proxy (together with others) here showing the extreme non-normality of this proxy – which is probably not consistent with Nature’s statistical policies,”
Uhhh.. what? Nature has a policy against inclusion of data which is not normally distributed?
re 12:
Brooks,
Based on all the brown featureless stuff filling most of the pic (sand or soil? dormant or dead annual grasses?) and in the midst of all that, the splash of vegetation trending from the tree and out the right side of the picture.
Do I know that its an oasis? Of course not. Not any more than Steve has ANY reason to guess from that pic whether the tree is temp or water limited, because as you point out, he has NO way to evaluate groundwater. The only bit of data that does exist, that streak of vegetation, at least implies a groundwater source.
But my point is that the pic is essentialy devoid of relevant information for Steve’s argument, pro or con,, and seems to have been included just so Steve can fire a colorful (but meaningless and information-free) shot across the bow of his opponent here.
Isn’t Quelccaya glacier snow accummulation (i.e precipitation) data?
and steve’s famous “the rain in maine falls mainly in the seine?”
Lee, of course the picture is for visual effect. It’s not one of the cored trees that was used in the study, right? The important thing about the picture is that it shows very dry conditions in general. Unless you think that every tree in that part of the world is linked to an underground water source, surely there is reason for belief that one could find precip proxies. After all finding vegetation near extrema of range is how selective proxies are found. Reread the Dendro Principles:
http://web.utk.edu/~grissino/principles.htm#2
If anything your (admittedly thoughtful) comment about groundwater, would seem to suggest that this is one more concern that impacts proxy selection, field work, and makes one more concerned about the relevance of studies that are reported. Particularly when tree by tree site descriptions are not given and detailed* (rather than hand-waving appeals to the canons of the field) tree by tree selection criteria not referenced.
#13: The policy requires disclosing the non-normalness:
From: http://www.nature.com/nature/authors/gta/Statistical_checklist.doc
See also http://www.climateaudit.org/?p=616
–
tco,
I dont care that the tree was for “visual effect.” I care that he used it as an appeal to — emotion? “common sense?”– to suport an argument when it doesnt offer any relevant data for that argument.
Regardless of whether you buy the methodology, remember that the reason for selecting proxy series by comparing recent years with the measured temp series, is to attemtp by a posteriori analysis to isolate records that are temp rather than precip (or other effect) proxies.
One interesting implication of this paper, if the result holds up and it isnt pushing the data too far, is that it appears it might be possible to separate out temp and precip effects in the same tree, using different proxies. Simplistically, remove low-precip years from the tree ring data set, for example.
#19 Lee, have you missed the point of Steve’s post? Its not that its either a temperature proxy or a precipitation proxy but that it cannot be both according to Hockey rules. Steve individual opinion doesn’t affect his argument here.
I gave a URL for the picture which was to a study entitled A Dendroclimatic Study of Study of Qilian Qilian Juniper in Juniper in
the northeast the northeast Qinghai-Xizang Xizang (Tibet) Plateau by
Xuemei Shao, Lei Huang*, Xiuqi Fang”➪, *, Lili Wang*,
Junbo Wang*, Haifeng Zhu. The study states that the trees are precipitation proxies. Add this to Sheppard et al and Zhang et al and we have 3 studies saying that Dulan junipers are precipitation proxies rather than temperature proxies.
But I’m not taking a position on which they are. All I’m saying is that they can’t be used both to say that the 20th century is anomalous temperature as a temperature proxy and anomalous precipitation as a precipitation proxy under Hockey Team anti-Soon and Baliunas policies. They have to choose. Hey maybe they can have a draft. We can all try to guess which proxies will be lottery picks – the precipitation team gets some picks, the temperature team gets picks. But the proxies can’t play for both teams. We know that the bristlecones will be lottery picks for the Hockey Team.
Steve, the link for the tree pictures is not to a study. It is to a PPT slide show. The tree pic is the last pic in that PPT slide show.
In the next to last slide, second bullet point, it states:
“Precipitation and mean maximum temperature in May and June are highly limiting to growth of Qilian Juniper is study area.” To the extent this is true, it is problematic (unless controlled for) for deriving temp proxies from ring width. That is a separate issue from the one you raise here.
Why is it not possible to use TWO DIFFERENT MEASUREMENTS from the same sample to derive two different proxies? This study seems to be deriving precip from d018, not from tree ring width. I’ve only glanced at the paper, but in principle there is no reason that ring width as a proxy for the limiting factor (perhaps temp?), while at the same time that a DIFFERENT measurement of dO18 in the rings themselves is measuring precip. I dont understand your criticism here.
Over to you Michael…
re 23:
And then you select (cherry pick) the proxy which matches your parameter (temp or precip) in the calibration period.
And then you hope/guesss/hugely extrapolate/infer/wish that the (very noisy) proxy also represents your parameter in the non-calibration period.
That’s David Stockwell’s approach innit?
And regarding the Soon and Baliunis, it seems to me that the criticism was on their DISREGARD of temp and precip confounding effects.
If (assuming for discussion the validity of the methods) someone uses analytical methods to choose proxy series that respond to temp, and also uses analytical methods to choose proxy series that respond to precip, and finds that a few of the proxy series are chosen by both methods, that does NOT invalidate their analyses. It tells us something interesting, perhaps that the variables are correlated in those samples, and that identifying which is the primary effect is problematic. This should be mentioned and discussed, yes. But this is a different KIND of thing from not considering confounding effects of temp and precip at all.
Lee:
1. You have a good point about O18 versus RW (two different measurements). I think more information can in principle be gotten this way. However, if you do, you are violating the principle of dendrochronology that says to use limiting factor stands. I also wonder if a calibration based on a limiting stand will hold for a stand that is intermediate.
2. On the photo, Steve says “most likely”. You are also still totally missing the relevant points: (1) If the trees are temp limited, they can’t also be precip limited. (They would be intermediate.) (2) The region is prone to precip limited stands. We need to assure ourselves by having detailed description of how stands were picked that were Temp limiting factor, to trust this species from this region. If you can show me some groundwater studies, great. Otherwise, there is a definite concern that these stands are misused. WHAT DO YOU BET the papers don’t go to this level of detail??
BTW, jumping on Steve for that photo and the most likely statement would be as silly as me cramming it your hooha for the oasis comment? Why don’t you stick to engaging on the most important parts of arguments. You’re smart and good and can help the discussion here. You do even on the small points. I just think you could do so much more.
re 25:
and for convenience disregarding all other possible fertilising mechanisms in the calibration period.
#14 “But my point is that the pic is essentialy devoid of relevant information for Steve’s argument, pro or con,, and seems to have been included just so Steve can fire a colorful (but meaningless and information-free) shot across the bow of his opponent here.”
and #19 “I dont care that the tree was for “visual effect.” I care that he used it as an appeal to “¢’¬? emotion? “common sense?”– to suport an argument when it doesnt offer any relevant data for that argument.”
Lee, you’re picking at nits and making a case out of opportunistic derogation. Steve clearly designated that tree as “a (not ‘the‘) Dulan juniper” and observed that it, “is more likely to be a precipitation proxy than a temperature proxy.”
“[M]ore likely” means ‘more likely’ and does not mean ‘is.’ Given the picture, the “more likely” is a safe supposition. Much safer than your ‘edge of the oasis’ supposition, which requires angled rooting or at least an unlikely and unusually wet early growth climate. The picture bears on the argument made in this thread because it shows the general desert ecology of the Dulan area, which was its intent. If the cored trees represent that ecology (why else choose them?), then they are indeed going to be water-stressed.
If you’d looked at the report Steve linked, you’d have noticed dried grasses and bushes everywhere, with no evidence of local oases. There’s also a contrasting green/brown pair of pictures, presumably showing growth following the wet period and the later die-back from dessiccation. In the picture Steve posted, normal precipitation-based growth/die-back would explain the bits of grass far more naturally than your supposition of a local oasis.
None of what Steve wrote involved false claims or even rhetorical flourishes. The point is clearly made in the sentence immediately following, namely, “But regardless of which it is [temperature or precipitation proxy], under Hockey Team policies for Soon and Baliunas, it can’t be both.”
That’s the whole ball of wax, and that is an undeniable conclusion.
I’ve read a number of your posts here. It’s clear you’re searching for reasons to be dismissive, and the reasons you find too often seem to devolve into personal attacks against Steve’s integrity. Your objections above, for example, do not bear at all on the substance of the issue, but instead make an issue of Steve himself.
Considering the unremitting and documented squirrely behavior of the proxy climate folks, your selectively sour view of Steve is hardly evidence of an unbiased opinion.
re:#25 And where, Lee, is the evidence that Mann, et. al. have EVER taken both temperature and precipitation into account? If they have, there should be discussions of the process in the papers. I’m not the expert here, but I betcha Steve says there is no such discussion.
Why do you hone on this “emotional effect” point (btw, I could find a million suggestive photos at Real Climate. Like the hurricane covering the whole page for the post on possible connection of storms and GW). Even if you’re right, why don’t you gig Steve for the comment and then also engage on the places where he does have supports, does elaborate an argument? Don’t you want to talk about what matters? Do you accept everything else in Steve’s post?
Re Soon an Ballunias: I’m not familiar with the case (not to read back), but don’t you see plenty of evidence of lack of proof of non-confounding wrt hockey team work? Not just for precip, but also for CO2?
The Asian formulations end in 1980, 1993, and 1998.
Divergence problem? Look at the other two.
re 28:
“None of what Steve wrote involved false claims or even rhetorical flourishes. The point is clearly made in the sentence immediately following, namely, “But regardless of which it is [temperature or precipitation proxy], under Hockey Team policies for Soon and Baliunas, it can’t be both.”
That’s the whole ball of wax, and that is an undeniable conclusion.”
But the same TREE **CAN** be both. Tree ring width can’t be both; to the extent that any given study fails to distinguish these, it is problematic. I madea psot on this already. But tree ring for temp and dO18 for precip CAN in principle be derived from the same tree.
————
I think Steve made two serious errors in this piece, and they are not nit-picking.
One, confusing the fact that Treydte were using TWO DIFFERENT PROXIES that happen to be measured from the same tree, such that precip via dO18 and (to the extent they get it right) temp via tree rings analysis, can both be simultaneously valid.
And two (and I’m on less sure ground here, still reading the literature,and willing to be corrected) mixing criticisms over failure to deal with confounding variables at all, with a different kind of criticisms over proper methods to deal with confounding variables.
I’m still digging into the literature and the commentary here and elsewhere, and am not yet equipped to comment intelligently on the tree ring analyses themselves. But running into this kind of superficial criticism (which, frankly, is plastered all over this site intermingled with the substantive stuff) certainly makes it a damn bit harder to narrow in on the substantive criticisms and start to understand if or why they are valid. Frankly,its damned frustrating, which is what y’all saw with the (valid if nitpicky) tree pic post, which was posted while I was trying to weed extraneous material and figure out why Steve’s analysis didnt make sense to me.
#32 If you were more familiar with the site, you’d know that the multiplicity of effects on tree ring width has been extensively discussed here. The short of it is that the basic green house work on separating out the various influences on trees rings has never been done. Therefore, while it is true that a given tree can both reflect moisture and temperature, there is no analytical way whatever to separate those effects.
Likewise, O-18 is not strictly a temperature proxy because, as Steve has pointed out in the past, there is a monsoon rain-out effect that confounds temperature. dO-18 therefore, could reflect more rain elsewhere in upstream climate, as opposed to temperature where the O-18 is measured. It’s not simple.
Treydte have no method to separate effects. Showing the same proxy one time as reflecting temperature and another time as reflecting moisture is either mistaken or actively tendentious. In the absence of a good analytical theory, it is never “simultaneously valid.”
My criticism was not superficial. Rather, that word describes yours. You criticized nothing of substance. And your point about Steve’s misrepresentation was strained and prima facie invalid. If you want to narrow in on substantive criticisms then go ahead and do so. On this thread, you have so far not done so.
Steve’s analysis made perfect sense. It was that the Hockey Team criticised Soon and Baliunas using criteria that should have been applied to Treydte’s paper, but weren’t. Who, after all, reviewed their paper prior to publication? And why wasn’t the EOS logic applied to it?
Getting away from pics and nits for a bit, has anyone other than Steve addressed how anthropogenic CO2 and climate change can cause the rain in Pakistan to start increasing in the early 19th century and level off in the early 20th century? Sorry if I missed it.
#32. Lee, I didn’t discuss the issue of whether Treydte’s dO18 and ring width in the same tree could measure different effects. The proxies that you’re complaining about are cited by Treydte but are different.
The identical Arabian Sea diatom series is used as temperature proxy by Moberg and cited as a precipitation proxy by Treydte. If Treydte is right, then Moberg confounded the two and should be dumped on from high heaven by the Hockey Team. Have you heard a whisper of criticism?
Similarly with Dulan junipers – they are cited by Treydte and dO18 has nothing to do with it. If Dulan junipers are a precipitation proxy, as cited by Treydte relying on a plausible article by Sheppard et al, with the internet presentation merely further proof, then the use of the Dulan junipers as a temperature proxy by Crowley is wrong and their inclusion in the Yang temperature composite is wrong. Those are the take-home points. Or if they are temperature proxies, then Treydte is wrong. There are no other alternatives and dO18 has nothing to do with it.
re 33:
sigh… “If you were more familiar with the site, you’d know that the multiplicity of effects on tree ring width has been extensively discussed here.”
I am familiar with that, I explicitly said I’m wading thrugh some of that and dont yet feel I know it well enough to comment on it. That is why I’m here (and why I’m frustrated): I’m tryign to learn this stuff. But one of my basic points is that Treydte IS NOT BASED ON TREE RING WIDTH and is NOT THE SAME PROXY as tree ring width from the same trees.
“It was that the Hockey Team criticised Soon and Baliunas using criteria that should have been applied to Treydte’s paper, but weren’t.”
The fact that one’s analytical methods identify a subset of proxy records as meeting criteria for both temp and precip proxies, is an inmprotant fact that needs at least to be discussed and recognized as an issue. I SAID THAT! If they didn’t do that, that is a problem. It doesnt necessarily invalidate either analysis, (IF at that site temp and precip are highly correlated, it may be valid at that site for both) but it does say at least that there’s some more learnin’ to do here.
But it is a different problem from ignoring the issue of validating a proxy agaisnt a variable altogether (which is what Soon and Baliunis seem to have been criticised for; again, I’m still reading this stuff, correct me if I’m wrong. Both of those are in turn different from poor or inappropriate analytical methodology. I’d be happy to hear dubstantive argumen that ‘the hockey team’ si wrong; I ge tfrustrated when I see what instead or alongside adnamking it mroe difficuotl to follow the substantive stuff, are essetnaily accusations fo hypocricy based on a set of criticisms tha tare different in kind fromthe ones they used.
What drives my frustration here, which you are clearly sensing, is that the substantive criticisms that I’m trying to find and learn from are so often mingled with what look like arguments from one criticism addressed to a different problem, intermingled so thatit is difficlt to sort them out.
“Likewise, O-18 is not strictly a temperature proxy because, as Steve has pointed out in the past, there is a monsoon rain-out effect that confounds temperature. dO-18 therefore, could reflect more rain elsewhere in upstream climate, as opposed to temperature where the O-18 is measured. ”
Treydte is using dO18 IN THIS SERIES as a precipitation proxy. Maybe it works because of the rainout mechanism you mention? Or maybe it doesn’t work. In any case, criticism needs in this case, for this series, to be based on their analysis and methods. That isnt what Steve (or many of the commentors here) addressed. It may be true that the ‘correlation with test set – back prediction’ methods is fatally flawed. Fine, concentrate on that problem with this study. It may be true that the dO18 proxy for precip in this series is flawed. Fine, discuss that. Those are the kind of criticisms that I’m trying to understand and evaluate. But ther is no reason in principle that I can see, that at different sites under different conditions with appropraite validation, it cant work for both.
Lee, can’t you at least reread what you write before hitting the send button? I’m getting frustrated trying to decypher what all the typos in your messages are. Remember these messages are more public than a typical e-mail and can be around forever. Try, at least, to make them readable.
Steve said in post:
Let’s turn the clock back to 2003 and consider the response by the Hockey Team to Soon and Baliunas 2003, much of which focussed on the alleged confusing of temperature and precipitation proxies.
No alleged about it Steve, c’mon. Give your fans a break an’ fess up. Yes, yes, it’s a Heritage TeamTM paper, but still.
1. Just about the entire planet saw the flaws in S&B’s paper, except the folks that either planned or attended the Heritage Victory TourTM which opened very soon after the publication in the non-peer reviewed journal.
See, it wasn’t peer-reviewed, so folk had to…um…audit the paper. And they did audit it, and found the paper to be wanting. Had this site been in existence, I’m sure the intrepid auditors here would have approved.
2. Specifically, S&B appear to have done a lit search and cited papers that did not look at temps.
That is: they said they looked at papers that looked at regional temps, but instead cited papers that never looked at temps.
Simple: that’s kinda a little problem.
Plus they used a 50-yr window (e.g. not replicating) that conveniently hid fun results. Regardless of all that, the majority of worldwide (not regional) papers S&B looked at supported the theory that worldwide temps rose.
Problem is, they never mentioned this little bit, which orignally caused all the furor after folk audited their paper.
As I see above, Steve, that you sniff disparagingly over something Treydte left out of their paper, surely you understand about leaving stuff out of papers.
Too bad Quark Soup isn’t around anymore, which had the best discussion board on the S&B FUBAR.
3. Steve, Steve, Steve. I’m humbled by your ability to
nit-pickdeconstruct a paper published just today. Most impressive. Your fans, I’m sure, anxiously await your detailed response to this paper, along with the scientific community. I’m sure you already have a full paper with data in the works.Best,
D
BTW, ‘preview’ shows that I can use [sup], but it don’t show no [sup] on the page.
D
Whether something is a better proxy for XY or YZ must be justified rationally – at least by some statistics. Such statistics is likely to depend on the comparison of the high-frequency data.
If you imagine that the second half of the 20th century happened to be both one of the warmest as well as one of the wettest half-centuries, and some trees seem to be extreme in the half-century, too – you still don’t know whether it is because of the moisture or because of the temperature.
Statistically, one can find evidence for one or another by investigating the statistical correlations and the r2 coefficients. Microscopically, one can think whether a tree is affected more by moisture or temperature. Well, yes, the trees in the desert probably depend on the amount of water around, and my guess is that it is true for trees outside deserts, too.
Even if Soon and Baliunas made an imperfect inference, it is rather clear that they are treated much more harshly than similar sinners who reach the “right” conclusions, and this bias just does not belong to science.
#38. Dano, jeez, I was not discussing whether S&B were right or wrong. I was merely using the S&B criticisms to establish Hockey Team policies. The ciriticisms contained very strong statements about the need to distinguish temperature from precipitation proxies. so be it. All I’m saying is what’s sauce for the goose is sauce for the gander.
If Nature’s peer review is so red hot, how come they published papers within 12 months of each other in which the same proxy is used both as a precipitation proxy and as a temperature proxy. And its use as a temperature was not incidental to Moberg but critical.
However you cut it, if Soon and Baliunas erroneously used precipitation proxies as temperature proxies, then so did Moberg (and so did Crowley). What’s the over/under on when realclimate or any other climate scientists for that matter gets around to trashing Moberg (and Crowley) for using precipitation proxies as temperature proxies?
Or the over/under on how long it will be until any climate scientist dumps on Nature for crappy peer review in presenting such inconsistent views within 12 months. The problem was not very hard to spot. The proof is : how long did it take me to spot the problem? It was obvious in a first reading. And, as you like to say, I’m just an amateur. I guess that the pros must have figured it out even faster.
Re #28: I found this breathtaking:
“Considering the unremitting and documented squirrely behavior of the proxy climate folks, your selectively sour view of Steve is hardly evidence of an unbiased opinion.”
And of course there’s no questioning your other inference that Steve hasn’t questioned the integrity of the Hockey Team.
Imho, as we saw with Enron, it is good to audit the auditors.
Er, Steve, apparently you and a lot of other auditors missed an error or two on the part of von Storch et al (2004); see discussion here. Apparently some of this poop rolled downhill toward Burger & Cubasch. I look forward to your detailed analysis.
Steve Bloom, I look forward to your detailed analysis promised back on March 8 over here http://www.climateaudit.org/?p=554 (see #236) or an apology for the insults you directed towards me in that same thread.
#42 Steve B., your history of breath-takingness is not one to cause much of an impression on exposure to it now. Steve M. has documented one transgression after another by the HS team, including statistical misapplications, spurious claims of independence among studies, evidence of tendentious data truncations, and now adjusting critical appraisals to suit the author list. His more personal criticisms, modest as they have been — especially in comparison to yours — have been entirely earned.
But you’re almost right at the last, not that it’s good to audit the auditors, but rather that it’s good to audit the audits of the auditors. Hew on with that, pray, and we’d all welcome that change in your posts. Somehow, you’re perpetually unable to distinguish between the work and the worker. Do politics ever cease for you? Or, in other words, is there such a thing, to your mind, as objective knowledge?
Nanny, as I pointed out to you before, when I refuted the other claims you made about aerosols (as I recall largely based on a World Climate Report paper that turned out to be composed of unsubstantiated claims) your response was basically pure denial. Since I expect the same from you on the rest of it, I choose to simply wait for publication of the Stott paper I mentioned. You’ll deny that too, but at least I won’t have wasted any more time.
Steve B,
If you’d keep up with this site instead of waiting for your daily talking points e-mail, you’d know that someone pointed out the new real Climate article already and that this was linked to where Steve explained the problem months ago. What took Real Climate so long?
Where, Dave?
I’ve been in and out of the active threads off and on all day (probably irritatingly so) and reading some back articles, and I havent seen it.
41:
However you cut it, if Soon and Baliunas erroneously used precipitation proxies as temperature proxies, then so did Moberg
S&B did no such thing, Steve. The non-climatologists merely data-dumped a bunch of papers they likely marginally understood, wrote it all up in a non-peer reviewed journal, and then enjoyed paté and Dom on the Heritage Victory Tour (TM).
I was merely backgrounding/contextualizing the paper you chose to make your point, is all. Surprising that _anyone_ would use such a shoddy work in an argument, let alone someone who professes umbrage over far, far less. And using it comparatively to an actual scientific paper, well, how does one contextualize _that_?
40:
Interesting how you choose your premises, and what those premises contain, Lubos.
Best,
D
re:#48 I just went and looked at all the recent threads and don’t see the post. I think it was from a regular so I don’t think SpamKarma ate it. I suspect it was added to an old thread. Perhaps someone else remembers? I’m sure it was this afternoon. The remark was something like, “The gall of these guys!” meaning how can Mann, et. al. complain about anyone not making a journal correction.
re #48
It’s here.
Steve Bloom,
You didn’t “refute” anything Steve since my claims are not based on the WCR paper.
You’ve still somehow got to show that North American aerosols cause cooling while Chinese aerosols cause warming. I doubt you’ll come up with a response to that, regardless of whatever the Scott paper says, so why don’t you be a man and apologize for your childish insults.
Thanks bkc, I knew it wasn’t just my imagination.
I think it would be very interesting if Steve did go through Soon and Baliunas (2003) with a fine toothcomb. I wonder what he’d find.
it’s time this blog becomes a forum like the ones below, at least over there is some possiblity to add typography, graphs and latex formulae and you can edit your own postings.
http://www.wetenschapsforum.nl/
http://www.ukweatherworld.co.uk/forum/forums/forum-view.asp?fid=30
Steve,
Why don’t you write a comment to Nature about the Treydte et al. paper? The data and results in that paper can apparently be questioned.
Sheesh, how come every nitpicking exercise generated on this blog ends up hooking themselves onto meaningless sidetracks. Dano I see is wiggling on the Soon & Baliunas paper is carp hook. Well thats the point of Steve’s post Dano. He is taking the Hockey team’s criticism as being valid and then asking if these criticism are being consistantly applied. Lee this is also the point when you ask “criticism needs in this case, for this series, to be based on their analysis and methods” – so why aren’t the Hockey Team being consistant in their analysis then? Thats the question this particular thread started by Steve is asking. The fact that no-one has yet invalidated the question says it all.
This plot shows that there is little or no trend between the seasonal varation in precipitation and isotopes for lower lattitudes:
The source is the GNIP database, Global Network for Isotopes in Precipitation
The plots are made for all stations that show an R2>50% in the correlation between amount of precipitation and isotope ratio (d18O)The plots show the trends of the relationship factors between those average annual seasonal variations.
The high lattitude stations show an increasing steep positive trend between isotopes and precipitation whereas the lower lattitude stations show a very little mostly slightly negative trend.
Therefore it’s a complete mystery for me how the variation in isotopes is assumed to be measuring precipitation in lower lattitude stations. Variation in Sea Surface Temperatures, Monsoon varations, etc are likely to be disturbing factors that dwarf a isotope – precipitation trends.
Moreover they should have used the meteoric waterline, determining deuterium excess etc, to reach a little higher level of uncertainty about the precipitation proxy.
Silly response maybe, but that Dulan juniper looking reasonably healthy in such an extremely arid location is remarkable. It prb’ly has found groundwater well below the surface.
re #43: Steve B, did you actually read the comment by Wahl et al? Did you also read the response by von Storch et al… or are you simply relying on what they say over (un)realclimate?
Especially, which part of the following you did not understand:
Folks, it is looking more and more like there simply is no way to separate the effects precip. and temp. using trees. Given the information available, one simply cannot know what was causing growth changes in trees 300 years ago. Thus, we have “scientists” using the same trees to show different things. It’s all becoming very comical.
re #61: Jae, I would not say there is “no way”, I think what’s been illustrated is that it sure seems that we can not with current methods used so far separate the causes reliably. There might be other ways. Even I have a few ideas that might be useful to try. On the other hand, it’s not my field and I have no publications in Nature (so my ideas can not be worth a sh*t ;). Also reading RealClimate have convinced me that everything is settled and “real scientists” have moved on to more important issues 😉
Re #60: Just from the section of the Von S. et al response you quoted, what part of “although it does affect the magnitude of the reduction in variance” don’t you understand? Wasn’t this discussion all about the variance? One begins to smell something a little bit like the UAH MSU inbroglio. And did you notice that the Science editors didn’t feel it necessary to say anything? I’m sure the NRC panel members will read this exchange with great interest (although strictly speaking I’m sure that they all knew about it at the time of the hearing).
57:
Sheesh, how come every nitpicking exercise generated on this blog ends up hooking themselves onto meaningless sidetracks….the point of Steve’s post Dano..is taking the Hockey team’s criticism as being valid…
[Australian accent] Nitpicking projection…noooooiiice, mate! [/Australian accent]
This argumentation would be true if S&B weren’t a lit review. They processed no data.
The premise is stretched quite thin. So thin I can see thru it, to someone hand-waving…hmmm…are they waving away smoke? Hmmm…can’t quite see clearly to tell…hmmm…
Anyway, one of the points of my comment was the Heritage Victory Tour an’ stuff.
Best,
D
#64 only 12,000 miles out Dano, thats quite good for you…
Dear Dano #49,
I am happy that you appreciate my premises, and thanks for your compliments. Nevertheless, it would be even better if you tried to understand them and to follow the basic rules of scientific reasoning, and I wish you a lot of good luck for this new step.
All the best
Lubos
#62, Jean there are no numerical methods that will separate moisture from temperature in tree ring widths or densities. That’s because there is no theoretical matrix with which to constrain, and in which to embed, an iterative fit. Honestly, I don’t see any way to even derive such a theory using wild-type trees because the cross-talk among genes will make it extremely difficult, if not impossible, to separate out effects. One can’t use tree-ring d-O18 to constrain moisture because doing so carries the implicit assumption of long-term constant climate outside the test-local ecology.
Trees do not secularly respond to stressors. They adjust themselves in various ways, and genes are up-regulated or down-regulated, depending. That means their responses will be very non-linear and will vary from tree-to-tree even within species because every tree is genetically unique.
Tree ring proxy studies are making quantitative judgments using probes that are not quantitatively understood. The field is being driven by wishful thinking, and the practitioners are blinding themselves to the enormous unknowns lying beneath their data by focussing in on a false precision.
re 67:
uhh.. what?
“That’s because there is no theoretical matrix with which to constrain, and in which to embed, an iterative fit. ”
So, we dont have any understanding of the process from which to cosntrain our fit..
but:
“Honestly, I don’t see any way to even derive such a theory using wild-type trees because the cross-talk among genes will make it extremely difficult, if not impossible, to separate out effects.”
Genetic effects on population variance for any given phenotype can not be assumed a priori; it must be demonstrated. The only way that latter sentence can make any sense whatsoever, is if there is a literature on the genetic components of tree growth response to temperature and moisture, sufficiently detailed to be not only identifying the genes involved, but in understanding interactions between genes and between the various pathways that the putative involved genes participate in. In other words, a “theoretical matrix” in which to constrain the results. Got any evidence to offer on “cross-talk among genes” involved in tree ring width responses to temp and moisture?
“will vary from tree-to-tree even within species because every tree is genetically unique.”
Got any evidence for this? This is NOT a priori evident for any given phenotype. It is true (and known) that individuals will grow at different rates, and one can maybe even assume a priori that the relative strength of responses will vary from individual to individual. So what? If the relative response between trees from a given area are strongly correlated, that is evidence that they are responding suficiently similarly to make the response useful, and one can say this without understanding ANY of the underlying genetics. Whether it measures what they want to measure is another issue altogether.
“One can’t use tree-ring d-O18 to constrain moisture because doing so carries the implicit assumption of long-term constant climate outside the test-local ecology.”
Would you like to expand that into a statement that I can try to understand?
#68, Lee, do you know the meaning of the term ‘descent with modification,’ and do you understand that variation within species is the stuff of evolution? Every individual is genetically unique, in the absence of clonal reproduction. So says basic evolutionary theory.
“Genetic effects on population variance” and the genetic uniqueness of every phenotype is a direct prediction of evolutionary theory. If you can show that genetic differences do not produce phenotypic variation, you will have refuted evolutionary theory and can line up for your Nobel.
You, in any case, make my point. The systematic studies separating temperature and moisture responses in trees, under controlled conditions, have not been done. Therefore, paraphrasing you, “there is [no] literature on the genetic components of tree growth response to temperature and moisture.” In the absence of those studies and that literature, there is no basis for any quantitative theory relating tree rings to those variables. Moisture and temperature cannot be explicitly divided out from convolved data, therefore, You seem to suppose that because there is no evidence bearing on the question at all, one can therefore blithely go an and assume there is no conflation of responses so as to produce some proxy series.
One cannot so blithely go.
My d-O18 point is this: local O-18 deposition depends on local temperature but also on distant rainfall. O18 rain-out varies with rain intensity, in other words. See here for a thorough article. If the intensity of distant rainfall varies, then local d-O18 will also vary even if local temperature is constant. If d-O18 is used as an independent local temperature proxy for tree rings so as to try and tease out separate temperature and moisture contributions to ring widths or densities, one must be able to show that the magnitude of upstream O18 rainout was constant over that period. One would also have to know, of course, that the observed tree ring variation was predominantly due to only moisture and temperature; how one would know that without a quantitative theory of tree ring response, I don’t know.
Before Pat and Lee get _too_ far into this genetic firefight… I sense you’re talking past one another.
Pat said “their responses…will vary from tree-to-tree even within species because every tree is genetically unique….” and “If you can show that genetic differences do not produce phenotypic variation, you will have refuted evolutionary theory…”
Lee said “If the relative response between trees from a given area are strongly correlated, that is evidence that they are responding suficiently similarly to make the response useful, and one can say this without understanding ANY of the underlying genetics.”
I suspect “unique” is being interpreted uniquely by each of you 😉
Each tree is genetically “unique” just as snowflakes are: overall, one will find at least some differences. And yes, those differences will be expressed in some way.
At the same time, each tree is not necessarily “unique” in _every_ way. They may all (or mostly) respond in similar or even identical ways… partially because _most_ of their genetics are identical.
Last I heard, even mammals (including humans) share 90+% of their expressed genome, and unrelated humans differ in only about 0.1%.
I think you’re both correct 😉
To paraphrase an opening that has been directed to me here:
oh, Pat…
“”Genetic effects on population variance” and the genetic uniqueness of every phenotype is a direct prediction of evolutionary theory. ”
Do you happen to know the “genetic effect on population variance” for the presense or absense of noses in humans? Hint: it is very, very close to zero; almost everyone who doesnt have a nose, did NOT acquire that lack through genetic mechanisms. This is just a very simplistic first-month-of-population-genetics example, but it illustrates the point. Genotypic variation does not necessarily lead to population variance for the phenotype. The undoubted truth of genetics and evolution is NOT evidence that variation between individuals for any given phenotype is of genetic origin, or even that such variation FOR A GIVEN PHENOTYPE exists at all.
I was not claiming or even implying that genetic variation does not exist; of course it does. I was pointing out that one can not assume a genetic basis for population variation in the absense of direct evidence for a genetic basis for such variation. Similarly, one can not assume that such phenotypic variation will occur, or especially that it will be significant or confounding for some other measurement, a priori, without determining that it is even actually present. You claimed a priori that THIS variation is of such magnitude as to make determining temps impossible; and there simply is no a priori way to assume that.
On the other hand:
“You seem to suppose that because there is no evidence bearing on the question at all, one can therefore blithely go an and assume there is no conflation of responses”
Well, no. I never assumed that or implied that. What I did say is that understanding of the genetic responses is not necessary for disentangling conflating variables. Researchers in medicine do it all the time, for diseases where we have no genetic understanding at all, and where there IS substantial known phenotypic variation between individuals for often unknown reasons. Epidemiologsts make their living at it.
Claiming as you appear to be doing that one can’t perform statistical analyses to tease out effects IN GENERAL (you are nto just claiming that they did a bad job of teasing out variables, but that it is in principle impossible), unless one previously understands the physical basis of those effects, is simply denying the utility of entire bodies of highly useful science.
Thank you Lee, for taking more care on your writing. #71 was a long post and I only noticed one typo which is more than acceptable.
#70, Pete, Lee’s comment that, “If the relative response between trees from a given area are strongly correlated, that is evidence that they are responding suficiently similarly to make the response useful, and one can say this without understanding ANY of the underlying genetics.” is wrong.
Without knowing any of the genetic basis for the responses, there is no way anyone can know whether correlations are causal or accidental. To assert they’re causal without knowing causation is mere tendentiousness.
#71, Lee, your argument about the genetic determinism of noses is completely irrelevant. No one is arguing about trees having or missing leaves. Using your human analogy, the proxy argument is like noticing that humans can run faster on cooler days. One then makes an empirical calibration of running speed with temperature using some human runners, and goes on to construct a global temperature proxy by timing groups of wild-type human runners without knowing their nutritional status, their health profile, their homeothermic capacity or ability to sweat, their susceptibility to heat stroke, or the twitch rate of their muscles. Neither relative to one another, nor relative to the temperature calibration group.
You wrote: “What I did say is that understanding of the genetic responses is not necessary for disentangling conflating variables. Researchers in medicine do it all the time, for diseases where we have no genetic understanding at all, and where there IS substantial known phenotypic variation between individuals for often unknown reasons. Epidemiologsts make their living at it.”
That’s wrong as well. Drug responses, in the absence of specific genetic knowledge, are all followed by large group statistical assays. There is nothing concerning causation in those assays that is not informed by medical theory. This is a critical point. There is no analogous biological theory of tree rings to bring any causal light on the empirically observed variations.
However, proxy studies assume that because a tree showed a positive response to temperature today, the same observed variable reflects a certain temperature a century and more ago. That’s like supposing that because a person achieved a certain state of being using a drug today, a similar state of being 10 years ago indicated the action of a similar drug. One then reconstructs a past drug-use profile by ascertaining a past health-history. Does that sound like good medicine to you?
Your resort to epidemiologists thus refutes your own point. Epidemiologists only establish associations that by themselves tell us nothing except that certain variables happen to co-vary in a regular manner. The results of epidemiological studies are winnowed by reference to theory in order to choose out those results that have a causal relation to the variable of interest. If mere correlation is all, how would anyone know that the stock market really isn’t driven by, e.g., lingerie sales?
In the case of trees, an epidemiological approach could ascertain that tree rings vary with climate variables. However, if the same property of trees responds to a variety of climate inputs, then one cannot reconstruct which of the several inputs caused which part of the change, unless you have a theory of tree biology that parses tree response in terms of the climate variables.
You wrote: “Claiming as you appear to be doing that one can’t perform statistical analyses to tease out effects IN GENERAL … is simply denying the utility of entire bodies of highly useful science.”
Such as what bodies of science? Science is theory and result, Lee. In the absence of a valid theory, results can have any meaning one likes. Steve M. has shown that caricature of science in this thread with the Arabian Sea proxy used both by Moberg and by Treydte; once it’s temperature and once it’s moisture. Without a valid theory, meaning is applied promiscuously.
In the absence of a theory that explicates the causes, how can anyone possibly tease causal effects out of data consisting of convolved dependent variables? One cannot pull knowledge out of ignorance.
re #63: Oh dear! I understood your quotation perfectly, detrending does affect the variance but it is irrelevant to their main conclusion. Since you don’t seem to understand the thing, let me try to instruct you step by step: look the Fig.~1 in von Storch et al. response. You see red, blue and black curves (we don’t care about the orange curves since they are done with “wrong” methodology). Blue and green curves are MBH reconstructions under two different “scenarios” (white and red noise). Are they the same as the simulated “true temperatures” (black curves)? Are the blue and green curves “flatter”? If so, then MBH methodology underestimates the variability. Now read the original von Storch et al paper (abstract is enough). What was their claim?
Since you seem to have problems understanding these basic things (no wonder if you only rely on (mis)information over realclimate), I suggest that you read a good book about linear statistics. I recommend:
C.R.Rao: Linear Statistical Inference and Its Applications, 2nd edition, Wiley, 1973.
It’s tough, but once you master it, you may (I’m optimistic) realize why Mann’s methodology is fundamentally flawed.
And I sure hope that NRC panel members will read this exchange.
re #63: Yes, I understand it is very hard. My main crtitique was about the wording “no way”. I think science has proved time and time again that something which may now seem impossible, is possible.
Pat, you are either misreading me or misquoting me:
“#70, Pete, Lee’s comment that, “If the relative response between trees from a given area are strongly correlated, that is evidence that they are responding suficiently similarly to make the response useful, and one can say this without understanding ANY of the underlying genetics.” is wrong.
Without knowing any of the genetic basis for the responses, there is no way anyone can know whether correlations are causal or accidental. To assert they’re causal without knowing causation is mere tendentiousness.”
————-
I claimed the correlations can be *USEFUL*, not that they give us causal understanding. Correlations can be USEFUL even if the causality is not understood. In your somewhat silly lingerie example, if the correlation between lingerie sales and market performance is robust, one can use it to predict market moves, even if the causality is not understood or is backwards. Miners used correlations between rock types to find gold ores for centuries (at least), before we started to understand the geology of ore deposits enough to explain those correlations. And as you say “One then makes an empirical calibration of running speed with temperature using some human runners,” and can then, AT THAT POINT, use that calibration to make statistical predictions about variations in running speed for an assemblage of runners, on warmer or cooler days, absent any causal understanding. Those epidemiologists draw USEFUL correlations, even absent any causal understanding. Correlation can be USEFUL (my claim) even if short of having causal understanding.
A sufficiently strong and often-enough verified correlation can be used to make predictions in the absense of ANY other info. One does have to be circumspect about noting the possibility that other variables, which we dont sufficiently understand, might interfere with our prediction and THAT (not a basic impossibility of the method) points toward the potentially valid criticisms of the tree record. But it seemed that you were making a much stronger claim than that.
Even in the presense of multiple causal effects, one can attempt to tease them out without a strong theory of causality, by attempting to isolate one variable in the selection of subjects (the dendro method, it seems), or by using alernative measurements to subtract out such effects (an attempt toward which which a bit of recent lit, including this paper, seem to be pointing).
BTW, I am reading MM05ee, and one of the first things I noticed when I looked at the various forms of the disputed record on that first graph, was that in each case there WAS an initial warm period, which fell to a sustained low, and that the
timing was approximately compatible with the historical transition from the MWP to the LIA. This seems true of many of the reconstructions. That is the kind of secondary verification, EVEN IN THE ABSENSE OF ANY CAUSAL UNDERSTANDING, that can add to one confidence in the utility of a method. As I say, I dont know enough yet to know if that is statistically real; I offer it as an example of how the USEFULNESS of this kind of analysis can be confirmed at least in part without the necessity of causal information.
But I wasn’t even addressing that; I was addressing your claim that a correlation can’t be USEFUL, absent causal understanding of it. I’m still working on understanding this literature. The comments on it are sometimes useful in that attempt. But when I find bold pronouncements like your initial claim on genetic effects, in a field I do know and which simply don’t make sense in this context, but are offered as a grand pronouncement of the essential dis-utility of this method, it ain’t helpful.
BTW, your initial claim was that genetics make usefulness impossible, becaue “cross-talk among genes will make it extremely difficult, if not impossible, to separate out effects.” Are you still making that claim?
#38, Dano, your comments made me look back at the critique of Soon and Baliunas (SB03) offered by Mann and his 11 co-authors in Eos, which can be found here, or in preprint form here.
What I found was the masquerade of a critique. For example, SB03 is criticised for being “inconsistent with the preponderance of scientific evidence.” In fact, however, it was consistent with the preponderance of pre-1998 evidence, but merely inconsistent with MBH98-class reconstructions. When MBH98 was published, on the other hand, it was itself inconsistent with that same previous preponderance of evidence. Inconsistency with past work, alone, is not a valid critique of any scientific report. But Mann, et al. offered that criticism as though it were valid, and applied it to others while ignoring that it applied even more strongly to themselves.
The supposedly substantive criticisms are equally suspect. For example, Mann et al., cite their own work as definitive (par. 3), when it was not (the debate was, and is, still open). They also cite support from climate models, which are incapable of giving support.
They misrepresent SB03’s assumption under item “(1)” (that SB03 equate hydrologic and temperature signals) while ignoring their own invalid assumption that short-term correspondence with modern temperatures allows extrapolation of tree response into the distant past.
They go on to misrepresent SB03’s definition of a warm climate anomaly as “either ‘warm, wet, or ‘dry,’” when SB03 clearly define it as “50 years of sustained warmth, wetness or dryness.” That is, warmth itself is defined as such, regardless of whether it is wet or dry. Cold periods are likewise defined — as such, no matter whether wet or dry. This misrepresentation forms the entire basis of Mann, et al.’s claim that SB03 confuse hydrology with temperature.
Likewise, item “(2)” is an analytical smoke screen. It supposedly faults SB03 for confusing local climate excursions with global excursions, when in fact what SB03 did was compare local excursions across large geographic regions, looking for large-scale correspondences.
As an aside, Mann, et al.’s reference to “Eurocentric origins” was a wonderfully subtle polemic equating belief in the MWP and the LIA with racist bias. That sort of discredit through political smear is StOP for the social constructivist attacks on climate scientists who are not with the AGW program.
In their item “(3),” Mann at al. cite the IPCC report on proxy reconstructions as authoritative, ignoring the fact that Mann was the author of it, and relied chiefly on his own work. The suggestion that MBH “reconstructions of past temperatures [take] into account the uncertainties in those reconstructions” is ludicrous in light of the fact that there is no way to quantitate, or absolutely scale, the magnitude of the temperature signal within the total tree ring response (or d-O18 response, for that matter) in the absence of any theory delimiting the various contributions to the signal.
Whatever the faults of SB03, they are not illustrated by anything offered by Mann & co in (2003) Eos Trans AGU 84, 256-257.
As an interesting aside to Steve M., in their Eos response to Mann, et al.’s critique, SBL wrote that the MBH99 reconstruction, “prior to 1400 depends sensitively on tree growth from one region; namely, trees growing at high elevations in western North America.” That was published only 3 days after MM03 came out in Energy and Environment. Did they know about your work, or did they independently notice that the preponderance of Mann’s “preponderence of scientific evidence” was preponderantly localized in the White Mountains?
I’m really getting sick of the criticism of similarity of behaviour now and earlier. I think that this sounds very creationist. I mean geology assumes that weathering occurs similarly now and earlier. Provided that we don’t extrapolate into regimes way outside of current observed ranges, I don’t see why the behavior would be any different now than earlier. This type of critique almost seems like an attempt to mug ANY reconstruction since there was (obviously) not an observer there. It’s a weak reed.
TCO has spoken. *Holds hand up like big chief*
#76, Lee, most of your argument relies on a slippery definition of the term “useful.” Useful for what?
In the case of a correlation of tree ring widths with temperature, the permitted use would be that finding a similar tree with a correspondingly similar ring width within the time-domain of the correlation may imply a similar local temperature.
That is not what is done with proxy reconstructions however. Proxy reconstructions extrapolate the correlations to well outside their domain, and assert causality. That is an invalid use of empirical correlants.
With respect to miners, I’m reminded of the story of people worshipping Poseidon for having saved so many from drowning. One Greek skeptic (I don’t remember his name now) wondered about all those who were not present to worship, because they had in fact drowned. The skewed statistics arising from a tendentious focus on success stories powers the entire industry of quackery. People may have used empirical measures to find gold, but only the successful told the story.
You wrote, “A sufficiently strong and often-enough verified correlation can be used to make predictions in the absense of ANY other info.”
Any such predictions are unscientific, in that they are entirely free of valid theoretical content. It is further true that no matter the number of successful empirical predictions, there is no reason whatever to credit the predictive power of any other empirical correlation. David Hume showed this 250 years ago, and it’s as true today as it was then.
Empirical correlations permit only judicious interpolation. Extrapolation outside the immediate bounds of the correlated data sets is never legitimate without the proper caveats. Successful inter- and extrapolations are never predictions in the sense of science. They are statistical outcomes. In proxy climatology, in contrast, reconstructions are time-localized empirical correlations that are being used to make scientifically unjustifiable retrodictions and to power entirely invalid claims of causality.
You wrote, “Even in the presense of multiple causal effects, one can attempt to tease them out without a strong theory of causality, by attempting to isolate one variable in the selection of subjects (the dendro method, it seems),…”
What independent measure would you use to determine that one variable? And how would you ‘tease out’ the magnitude of the response to that variable when the total response represents a convolution of the response to your desired variable with the responses to all the other variables; responses that may be positive or not, or linear or not?
Further, how would one eliminate spurious correlations? If multiple causes produce a single observable, does it make sense to you that there will be false positive correlations with single variables? How would you systematically eliminate them, and how would you know when they are occuring?
In your first “BTW” paragraph, you entirely ignore the issue of series that were cherry-picked to produce a desired ‘signal.’ You also ignore that you are supposing data are correct because they follow your subjective expectations. Both are a prescription for error.
In your last-entry “BTW,” you completely misrepresented what I wrote in #67. Very ironic, that, in light of your prior complaints here.
#78 “I mean geology assumes that weathering occurs similarly now and earlier.”
That’s not an assumption. That is an expectation grounded in very good chemical and physical theory. Geological sediments entirely comport with those expectations.
Biological theory says the species genome will evolve in multiple ways to maximize reproductive success. In terms of individuals, that means a comprehensive adjustment to ecological variables, not a linear adjustment. I don’t see how anyone can claim a linear response of tree rings to temperature in the absence of any grounding greenhouse studies.
congratulations, Pat.
You have just proven that entire successful fields of observational science have no validity.
tco, thank you for the succinct statement; I was using way too many words circling around that idea.
#81, Rather, Lee, perhaps you have a misapprehension of science and a correspondingly mistaken notion of empiricism.
“observational science”, now there’s an interesting phrase. How can something be science if it does not have a falsifiable theory? Observation is critical to science, and indeed science can’t occur without observation, but in the same breath a falsifiable theory is also required. Likewise, statistics is a useful tool in the hands of a scientist that knows how to use it, but alone it is not science.
Right on, Paul.
oh, god protect us. Why do I even bother with this foolishness?
Google: Results 1 – 10 of about 46,500 for “observational science”. (0.34 seconds)
Observational science – Wikipedia, the free encyclopedia
An observational science is a science where it is not possible to construct … Cosmology is probably the most extreme example of an observational science, …
en.wikipedia.org/wiki/Observational_science – 14k – Cached – Similar pages
Code 614/WFF
You are being redirected to science.wff.nasa.gov. Most browsers will be redirected automatically, if yours’ is not, simply click o n the link below… …
osb1.wff.nasa.gov/ – 2k – Cached – Similar pages
[PDF] Industry Studies: An Observational Science
File Format: PDF/Adobe Acrobat – View as HTML
Industry studies is an observational science. It is. one of many such sciences. In Physics its parallel is. astronomy. Astronomy is a science, …
web.mit.edu/ipc/sloan05/gomory.pdf – Similar pages
Observational Science
The Observational Science Branch conducts a broad range of research that uses both active … Dr. John Gerlach, Branch Head Observational Science Branch, …
neptune.gsfc.nasa.gov/~brianc/970osb.html – 14k – Cached – Similar pages
CSE – Remote Detection of Nuclear Proliferation: an Observational …
The detection of nuclear proliferation is a challenging problem in observational science. Although many details are sensitive, I hope in this talk to give …
http://www.cs.umn.edu/news/colloquia.php?id=252&term=fall_2005&title=Fall%202005&cat_des=&cat – 17k – Cached – Similar pages
Evolution – May 1996: Observational science (was: Science and …
observational science blend at the edges (difficult-to-control … Loren has summarised 5 characteristics of “observational science” …
http://www.asa3.org/archive/evolution/199605/0001.html – 6k – Cached – Similar pages
Evolution – May 1996: Re: Observational science
Loren has summarised 5 characteristics of “observational science” … suggested category of “observational science” involves no new …
http://www.asa3.org/archive/evolution/199605/0063.html – 7k – Cached – Similar pages
[ More results from http://www.asa3.org ]
[PDF] What is Observational Science?
File Format: PDF/Adobe Acrobat – View as HTML
Observational science is theoretical, experimental and applied research related to … Observational science. A third branch of science (which can be …
geoearthkam.tamu.edu/obsci.pdf – Similar pages
evl | A Two-Tiered Collaborative Design for Observational Science …
A Two-Tiered Collaborative Design for Observational Science Activities in … the play experiences of children in support of observational science learning. …
http://www.evl.uic.edu/core.php?mod=4&type=3&indi=180 – 19k – Cached – Similar pages
observational science: Information From Answers.com
observational science An observational science is a science where it is not possible to construct controlled experiments in the area under study.
http://www.answers.com/topic/observational-science – 30k – Cached – Similar pages
Can someone post the entire quoted paragraph from SB03?
Pat said this above:
“SB03 clearly define it as “50 years of sustained warmth, wetness or dryness.” That is, warmth itself is defined as such, regardless of whether it is wet or dry. Cold periods are likewise defined “¢’¬? as such, no matter whether wet or dry.”
I must say, I have a hard time reading that phrase as meaning anything other than “either warmth, wetness or dryness.” Using “wetness or dryness” to mean “whether wet or dry” seems to torture the language to a substantial degree. But I’d like to read the paragraph in context – or even the entire paper. I cant find a link to it here. I’ll keep looking, but posting a link would be a mitzva.
The MM05(grl) link on the right is broken, too, but that’s another issue.
#85, Wikipedia’s “Observational science” does not mean what you meant by that term, Lee. Wiki’s entry means ‘observation in the context of an otherwise falsifiable theory.’ Your meaning was ’empirically correlated data sets.’ Your argument here merely turns on a common phraseology, rather than on substance; a slippery approach, rather like a vaguely referenced “useful.”
As it turns out, the same disparity of significance attends your representation of “Industry Science,” as demonstrated by the HTML version of your reference here. The author makes a direct analogy to observation in the context of a valid scientific theory — something entirely missing from proxy reconstructions.
The “observational science” referenced by Gerlach refers to remote sensing of physical observables within the context of physical theory, once again entirely at variance with your definition equating “observational science” with epidemiology.
The “observational science” described by Priedhorsky, looking for nuclear proliferation, your number 4 item, once again is remote sensing applied to physically very well understood signatures of technological activity.
That’s four in a row not supporting your claim. I’m done checking.
#86. Here’s SB03’s entire definition: “Anomaly is simply defined as a period of more than 50 yr of sustained warmth, wetness or dryness, within the stipulated interval of the Medieval Warm Period, or a 50 yr or longer period of cold, dryness or wetness within the stipulated Little Ice Age. We define anomaly in the 20th century within each proxy in the same way.”
Here, in contrast, is how Mann, et al., represented it. “The existence of possible underlying dynamical relationships between temperature and hydrological variability should not be confused with the patently invalid assumption that hydrological influences can literally be equated with temperature influences in assessing past climate (e.g.,during Medieval times). Such a criterion is implicit, for example, in the SB03 approach that defines a global “warm anomaly” as a period during which various regions appear to indicate climate anomalies that can be classified as being “warm,””wet,” or “dry” relative to “20th century” conditions.”
Does the latter seem to you a fair representation of the meaning intended by SB03?
You can find Mann, et al’s Eos paper in pdf format here, and the pdf comment and reply set here.
If John A is of a mind, I can send him a pdf of SB03 on Monday that he can then distribute to all interested parties.
Lee/Pat:
http://web.utk.edu/~grissino/principles.htm#1
This is just conjecture, but wouldn’t the tree ring *deltas* be a more sensible way of measuring past climate?
The approach that I took in my analyses (for my own amusement) of the tree-ring data was to use an exponential average of the data. Given that a tree may adapt to its climate (if the climate shifts, then is stable for long enough for the tree to adapt) the changes from year-to-year may contain a valid “signal” – i.e. whether the next year was better or worse for the tree than the last – but can not be compared in absolute terms across large time periods, because the tree’s size and structure may have changed during that time in order to adapt to the new conditions.
The exponential average works by assuming that as the climate gets better or worse for the tree (growth increases or decreases), over time that new climate becomes the ideal growth point for the tree, and future deltas are relative to that. Of course, this only reconstructs the “growth goodness” factor for the tree, not temperature or precipiation, since I’m assuming that not only are there multiple variables connecting climate to tree growth, but they are also not linear. But it’s still interesting to see what the proxies tell us about the growing conditions in the past.
Anyway I’m neither a botanist nor a statistician, but it strikes me that the dendrochronologists’ usage of tree ring widths and densities is a little too simplistic to give the best quality information extraction from their raw measurements, and doing statistics on this information is just going to garble it.
In fact, I think it would be very interesting to look at the spectral properties of my exponentially averaged proxy outputs, to see if it is closer to a gaussian distribution than the original data is. Perhaps that would be an indication that it’s a valuable technique. I’ll whip up a program to check that.
#88, Thanks TCO. Observe: “Because we assume … we can then use…”
’nuff said.
RE 88, TCO, thanks for the link you provided. However, the link did not contain any information about the upside down quadratic form of the response of a living creature to almost any variable. It’s the “Goldilocks principle”, that if a given variable either too low or too high, the living creature doesn’t do as well as when it’s “just right”. Did they say a word about that problem, which affects all of dendroclimatology? … well … no. Not a word.
Nor did it contain a speck of information about the problem of the interaction of two variables, such as temperature and water. A tree will grow quite wide rings in hotter temperatures … provided there is enough water. But if there is not enough water, it will produce much narrower rings at the same temperature.
Although they go on at length about “limiting variables”, trees are generally not limited by a single variable (either temperature or precipitation), but by the interaction of the two. If a tree is experiencing heat related moisture stress, is it limited by the heat or the moisture? Well … neither one individually, it is limited by the interaction of both, and there is no a priori method to distinguish the two.
Finally, is “the present is the key to the past” applicable in the field of dendroclimatology? The idea was first posited by James Hutton, who said that the geologic processes observed in operation that modify the Earth’s crust at present have worked in much the same way over geologic time. In general, this seems to be quite true … at least for geological processes.
But the climate, on the other hand, has not worked in the same way over geological time. There have been warmer and cooler periods, and wetter and dryer periods. Thus, just because a tree happens to be temperature limited in the present, there is absolutely no reason to assume a priori that it was temperature limited in the past as your link claims. If there was a drought in the past, the tree’s growth during that period would have been moisture limited, and the present would not be the key to the past in any sense.
In fact, this idea, that climate has been the same until man came along and changed things, is one of the grand illusions of dendroclimatology and climate science in general. It is accepted, as in your link, as a tenet of the science, when in fact it is something that has to be proved for any given site before we can go forwards with the analysis of that site.
All in all, your link was very good … but only if I wanted a link to a cheering section for a sixth-grade dendroclimatology class.
But in this forum? It’s a joke, bro’, it doesn’t touch any of the clearly identified problems with the field in any manner. We’ve discussed these problems here at length, so I know you know they exist … so why post a link that ignores them entirely?
w.
Pat,
The assumption, which is part of the dendrochronological **theory** that is in play, is an assumption of sufficiently similar past conditions. The point you are missing is that the greenhouse studies you want are not evidence of lack of a theory, they are missing tests of a theory that is being used, and that could potentially falsify that theory. The statistical tests for covariance of dendrological data and temperatures are detecting the corespondence that the **theory** is says is potentially detectable. You believe this is an inadequate basis for at detection; fine, but it is still a methodology based on a **theory**. Hell, even in your response to tco, you are debating details of a theory, pointing out weaknesses in the theory. You may not like the basis upon which this theory is derived, you may believe that this particular derivation of the correspondence is flawed, you may believe it is not adequately tested, but stop pretending there is no theory in play here, and stop claiming that the lack of a particular (greenhouse) test of **part** of that theory is evidence that the theory does not exist and therefore the field is not science. You are smarter than that. Argue the science.
Even the greenhouse studies you want won’t address the assumption of sufficintly invariant past conditions. They would be useful in determining the correspondences and limits on those correspondences, and even perhaps in finding separable measurements to tease separate efffects out (like ring width and density, perhaps; as potentially independent variables responding in different ways to different stimuli?), but they would tell us nothing about the variability of past conditions affecting those variables.
The assumption of invariant conditions is a falsifiable assumption embedded within dendrochronological **theory**. If there were no theory, no one could be building reconstructions in the first place. That assumption of invariance and the resulting theory that leads to dendrochronological temperature reconstructions, makes the prediction that such reconstructions must needs be in accord with other details we know about the past. As I’ve said at least two times now (and won’t repeat, they are right there where I said them), and even pointed out to you specifically when I said you werent addressing it, and which you still have not addressed, details such as the end of the MWP and onset of the LIA can provide such a check. I *DO* see those in many of the reconstructions; with argument over their magnitude. If you want to dispute that those are accurate or that they properly correspond, go for it, but stop pretending that there is no theoretical background for all this, and stop pretending that there is no verifiability.
—
Reading the quote from SB03, I find it hard to come to any other reading that the one Mann et all derive from it, or at best a statement that they want warmth **along with** anamolous wet or dry, which still makes Mann’s point. I still want to see the preceding text; perhaps they limit it somewhere up there?
If you see interaction effects, the way to handle them is as one more term (factor) in the overall regression. That is basic: if you are doing six sigma in manufacturing, doing a DOE in science, doing sociology with a complicated issue.
The issue of quadratics and the issue of “past might be different than the future” both seem like weak reeds. If they are present so much, why don’t we see them during current observations? When you all talk about stuff like this, I get the impression more that you are just trying to throw glass in the road to slow down the oncoming automobiles than anything else. If quadritics is such a problem, why don’t we have more examples of it during observation? And the past different than future smacks of creationism or of an effort to set an impossible high philosophical bar (absent time machines) for any past research (geology, archeology, etc.).
TCO, you said: The issue of quadratics and the issue of “past might be different than the future” both seem like weak reeds. If they are present so much, why don’t we see them during current observations?
Couldn’t the “divergence problem” be a manifestation of the quadratic behaviour?
Given how poorly many proxies seem to correlate to current recent historical climates, I don’t see how you can come to the conclusion that either, or both, of these issues are not causing the differences between observations and proxy measurements.
#94. I think that quadratic is more palusible explanation of the divergence problem than any of the other candidates. It’s even been proposed by someone on the Hockey Team http://www.climateaudit.org/?p=67
The quadratic effect seems like one that we really ought to be able to nail. We shouldn’t even need the divergence issue to help us. We should be able to see this given the large year to year variability of climate. I wonder if the reason that we don’t is that few of the stands really get to the point where this occurrs.
The “how do you know things weren’t different in the past” seems like a naive attempt to make an impossible to pass barier. I mean you might as well criticize all geology then and retreat into some solipsist nightmare. A more sophisticated comment would be something along the lines of showing that the extrapolation leads to abnormal areas where we can no longer extrapolate. Burger and Cubasch have a nice take with the comments on variability during the instrumented and non-instrumented period. I’m cool with that. Not cool with the brewcrew weak reed attempts to throw glass on the road.
regression to the mean of overfitted, cherry-picked subjects, is another possibility, no, Steve?
#92, Lee an assumption is not a theory. Nor is it a *theory.* If they want to assume the past is like today, then why do they need tree rings, or any other proxies, at all? Just take the recent temperature record and extend it backwards and forwards. As it already has a small positive slope, your assumption will correctly predict cooler temperatures into the LIA, which can be claimed as verification, and go on to predict wonderfully hot temperatures after 2100, which is what the AGW crowd want anyway.
Doing so would produce a body of ‘science’ just as good as what they’ve got already, but without all the razzmatazz.
The assumption in dendroclimo is not that the past was like the present. The assumption is that trees that track positively with temperatures today likewise and as accurately reflect the temperatures of the past. Those that do not today, likewise do not of the past, either. That assumption is not at all being tested. It is hardly even discussed. And it is entirely unjustifiable.
People who make proxy climate reconstructions are not testing their assumptions regarding tree ring response. They are incorporating that assumption into their analysis as a given and then going on to make conclusions about present climate. They are not, in other words, even following the scientific method.
The basic theory that would have to undergird dendroclimo is a theory of trees, not of climate. That theory of trees would incorporate systematic knowledge of the biological response of trees under a variety of climatic variables. It would make predictions about tree-growth that could be tested under controlled conditions by biologists (not by dendroclimatologists).
From that prior knowledge, the time-wise behavior of wild-type trees could then be assessed in terms of the already-known response attributes of those sorts of trees to those same climate variables — allowing those climate variables to be extracted and reconstructed.
That theory does not exist.
Your argument does not display an understanding of the form theory must have in order to produce appropriate predictions. Science is not axiomatic. Scientific theories are not logical elaborations of apriori assumed properties.
Re 93, TCO, thanks for your contribution. You say:
Umm … see, that’s the problem … it doesn’t show up in observation. All we can observe is wide rings and narrow rings.
But because of the upside down quadratic nature of the response to temperature, we don’t know if the narrow rings are because the tree had too little of a good thing (temperature), or too much of a good thing.
Thus, while we may be seeing “examples of it during observation”, we simply can’t tell if we are seeing it or not, and that’s the problem. We can’t tell if a narrow tree ring in 1735 indicates a really hot year, or a really cold year.
Since the dendroclimatology assumption is that narrow rings = cool and wide rings = warm, the net result of this invisible error will be to flatten out the warm peaks … but we cannot observe this in the tree rings, so as you point out, it doesn’t show up in observation.
w.
#97. Absolutely, in the case of proxies in Hockey Team subsets.
But in the case of large-population declines such as the 387-site network, something else has to be at work.
Re #91:
Yeah, right. We all believed that climate was variable, until Mann came along and changed things.
#99: Willis, agreed you can’t resolve the problem during 1735. You certainly can in 2006. If it happens so much, why don’t we see more people citing it in CURRENT dendro studies. In studies during instrumental time frames.
Re#102:
TCO, perhaps the interesting phenomenon of people going out and coring recent trees, and then not reporting the results of the their work, has something to do with your question. There’s also the whole issue of cored trees that are specifically excluded from detailed analysis/publication in the studies (remember, typically only the *chosen* trees’ data gets published; who knows what the rings on the others looked like?).
Mebbe so. But I just worry a bit that you all try to grab at every confounding factor and never try to think about which confounding factors are less likely to be a problem. If “quadraticy” were such a problem, I would think that we would see it more in everyday humdrum 20th century works.
Pat, this is getting circular. We’re back now to your proof that much of observational science is invalid.
I didn’t say an assumption was a theory; I guess someone who can read “Anomaly is simply defined as a period of more than 50 yr of sustained warmth, wetness or dryness, within the stipulated interval ” as meaning ‘warmth, whether wet or dry’ and EXCLUDING consideration of moisture, can also read “The assumption of invariant conditions is a falsifiable assumption embedded within dendrochronological **theory**,” as meaning that ‘assumption’ is synonymous with ‘theory.’ I’m being driven to the conclusion that you either can’t read and respond to what is actually said, or you dont care to, I’m getting bored of it, and I’m going to stop wasting my time on this and spend it on people willing to discuss the science rather than dismiss as unscientific anything less than a perfectly constructed and tested theory.
I think I was very clear about what I said. This particular assumption is one part of a theory that may or may not be correct, and likely still needs some verification. Many, many theories contain assumptions. Testing those assumptions is one way science progresses. Hell, Darwin made a major (and largely incorrect in its details) assumption about the nature of heridity in his initial formulation of evolutionary theory. Without a theory of inheritance, there is no way to construct a testable hypothesized mechanism by which evolution can work. By your argument, without a tested theory of inheritance, Darwin’s work was not science.
Such assumptions can be and typically are tested over time, both directly and indirectly, and one typical way that science progresses; comparing predictions from dendrochronology with other lines of evidence is such an indirect test. And to listen to you deny this, as you are doing, and in the same post lecture someone else on how science works, and in fact to offer insults based on that, is laughable in the extreme.
Now, I’m done with this. I’ll spend my time discussing science with people who dont argue that the presense of an only-partially-tested assumption in a theory is incompatible with the practice of science, and who can read plain english.
Good day to you.
Well so quit screwing around with Pat then. Screw around with steve. and screw around on the main content, not the “his tone” crap. I mean if you want to get into the science…get into it!
In addition to the problems of dual identification of various proxies as both temperature and precipitation proxies, there are other problems with the Treydte et. al. study. Here’s one of them.
This is what they said about the stations used for the meteorlogical data::
OK, so the nearest stations to the tree sites are Astor (Ast) and Gilgit (Gil). The first thing that struck me is that according to their own analysis as reported in the study, there is no significant relationship between the precipitation at Astor and Gilgit. The r^2 of the two precipitation records is 0.07, and the p>0.05.
It seems to me that the whole study should stop there … how are you going to derive a significant relationship between tree à⣃ ’ ”¬Å¡18O and precipitation, when the two nearest and best precipitation records don’t show even a statistically significant relationship with each other? This lack of correlation means that we don’t have a clue about the precipitation at the actual sites. They try to get around this by using a “regional average” precipitation, but the reality is that trees do not respond to regional precipitation, only to precipitation at their specific site, and in this case we don’t know what that precipitation was. For me, that should be the end of the story … but of course, a little thing like lack of statistical significance hasn’t stopped them before.
This, of course, is part of a larger problem with dendroclimatology — the trees usually are located at some distance, both horizontally and vertically, from the nearest meteorological station. This leads to a huge difficulty in determining how the trees are responding to the local conditions, because, as in this study, we all too often don’t have much of an idea what the local conditions are where the trees are located.
w.
This is a very good point, Willie.
Willis,
Regarding the sahpe of teh growth curve.
Many growth phenomena do not show such an inverted curve. Relatively linear curves with discontinuities are also reasonably common. One I am familiar with is generation time in D. Melanogaster. Increasing temp decreases the generation time, and it continues to decrease right up almsot until the culture fails at high temperature.
This doesnt decrease the necessity of being careful with growth curves, but I want to point make specific that an assumption of reversed sign off oppsitie sides of some optimum is also not universal. I think tco’s point is also well taken that continuing field studies should resolve this issue as temps increase in the field.
I don’t think we need to wait for continuing increasing temps. year to year variability is much more dramatic than the trended temp increases. We should be able to figure this out NOW.
Re 104, TCO, you raise an interesting point regarding the upside down quadratic nature of the tree response to temperature. You ask why there is not more mention of this in the literature.
Given the quality of the dendroclimatology studies that I have seen, and given the youth of the science, and given the so-called “scientists” that are currently publishing in the field … I am not at all surprised.
Do you really think Michael Mann is interested in showing that the whole field that he has been working in (dendroclimatology) has major unsolved problems? He’s trying to prove that trees are thermometers, not the other way around
In any case, the problem is not unknown in the field. Consider, for example:
Note that growth is reduced in the hottest part of summer (upside down “u-shaped” response), and that growth was related to the interaction of water and temperature, and finally that no significant relationship was found between growth and environmental variables … sounds like big problems to me.
w.
Willie, that is interesting and I give you kudos for finding it. But it is daily growth. Can you find examples of people having issues with rings (annual growth) from quadraticy?
#105, Lee, you misrepresented “observational science” and the examples you gave did not conform to the meaning, “epidemiology,” you originally assigned to that term. You have clearly decided to proceed as though that refutation never happened. The circularity is all yours. You are opportunistically assigning a definition to “observational science” that serves your immediate argument. So long as you do that, you won’t get anywhere in your thinking.
In your next paragraph, how does including “wetness” exclude “consideration of moisture”? It is ludicrous that you can write such an obvious non-sequitur and then go on to suggest that I cannot “read and respond to what is actually said.” Including wetness excludes moisture? I also never wrote anything implying you meant, “that “assumption’ is synonymous with “theory.'”
What I did write is that the assumptions of dendroclimo with respect to tree response to climate are unjustifiable. Your supposition that dendroclimo reconstructions can be falsified by testing against past climatological results is itself falsified by the literal re-writing of millennial climate history that followed the MBH98 proxy reconstruction.
Darwin’s original theory predicted the existence of inheritable traits. Nothing in dendroclimo predicts the response of trees to climate. They instead assume that responce and go on to use it to monger specious conclusions. The contradistinction with Darwin’s theory could not be more basic.
Laugh as you like. It won’t make you correct.
TCO, since annual growth is the one-year sum of the daily growth, I’m not sure what the difference is …
We have established from this study (as well as from common sense and from my observation of the forests around where I grew up) that too much heat makes a tree slow its growth. The “too much heat”, however, is not annual average heat. It is daily peak heat that makes the difference, combined of course with limited water. High annual average temps, or average monthly temps, may not correlate with high daily peak heat, so the correlation would be diluted and harder to see in the longer term records, even if it were visible on a daily basis.
However, despite that, I’ll go take a look.
It will be very hard to show, though, because of the problem I alluded to before, that the met. stations are usually a long ways from the trees. One critical statement in the study I quoted was:
Clearly, this shows that to study this properly we’d need, not just one thermometer and raingauge, but one at every tree … it also points out the inter-relationship of water and heat, that with plenty of water heat can help, but if water is short, heat can hurt.
Thanks to you, I’ve been thinking about this question of the basic principles of dendroclimatology. I suspect it is not accidental that the pioneering work in the field was done by Fritts in the American Southwest and was used, not for determination of past temperatures, but for determination of past drought and rainfall. Particularly in an arid region like the Southwest, the rainfall signal would be clear in the tree rings.
When the field was extended to cover past temperatures as well as rainfall, however, I think that a fundamental difference between the two was overlooked. This is that the effect of “too much of a good thing” differs between rain and heat.
While too much rain on any given day doesn’t slow down plant growth (unless it is so extreme that it washes out the roots of the tree or something of that nature), too much sun on a given day can slow down growth, or even seriously injure or kill a plant.
Thus, while Fritts could make the assumption of linearity w.r.t. precipitation and have it be generally valid, the same is not true of temperature. A bit of extra rain doesn’t slow growth, while a bit of extra heat definitely slows growth. This is the problem I am pointing to.
Off to look some more, thanks for the question,
w.
daily and yearly might be different. let’s say the top of the parabola is 80 degrees. Let’s say that the temp during growing season is 50-83 degrees. Daily observation will show that the GR goes down for the times when temp is 80+. But raising all of the day’s temps by 1 degree would still have substantial positive impact because there are so few days where GR is heat limited.
TCO, a quick look finds a dendroclimatological study of Australian Red Cedar at http://www.publish.csiro.au/?act=view_file&file_id=BT04033.pdf:
Here, the relevant quote is as follows, referring to trees growing in the Australian National Botanic Gardens:
Note that they describe temperature as a “limiting factor” because of high temperatures, where the Mannites call it a “limiting factor” because of low temperatures … note also that they say that the high temperatures cause a total cessation of growth in the summer months.
Which, of course, is exactly the upside-down quadratic shape of response that I have been pointing at as being an unacknowledged problem with paleodendroclimatology.
My best to you,
w.
You still don’t have it down to ring width, though Willie. Don’t have annual issue. What I’m really looking for is somone doing chronologies and noticing that some of the very hot years have small RWs.
TCO, repeatedly calling me “Willie” is either proving you can’t read, or that you are going out of your way to be nasty, or both. Use my name. Unlike you, I use my own name in this discussion, so you could at least have the common courtesy to get it correct when you address me. I manage to get your handle right, and I expect the same from you.
Returning to the issues, obviously, you didn’t take the trouble to read either study I cited. It does come down to ring width, that’s the whole point. In fact, you don’t even have to read any more than what I posted … unless you think that somehow the cited “collapse of growth in mid-summer” due to excess temperature has no effect on the ring widths, and even you can’t be that obtuse.
Come back when you’ve actually read the studies, and are not just trying to score points, and we can continue the discussion. As you requested, I’ve proven my point through citations, I’ve shown that excess temperatures inhibit tree growth, both on a daily basis and annually. At this point, nitpicking won’t cut it. If you don’t think excess temperature inhibits plant growth, then bring in something to disprove it.
I must warn you in advance, however, that this is a basic fact that is familiar to every farmer — when it’s too hot, crops wilt and fail to grow as well as they grow when the temperature is lower. You’re seriously swimming upstream with your claim that it doesn’t happen, with trees or any other plant life.
Finally, your idea that trees could suffer a total “collapse of growth in mid-summer” without affecting their ring widths is … ummm … oh, I don’t want to be too harsh here, so let me just call it a “unique and refreshingly naive point of view” and leave it at that …
w.
TCO, how about Fritts? Because tree ring literature originated so much in the American southwest, there is more literature showing ring widths negatively correlated to temperature than there is showing positive relationships.
Two general points. First I think we’re drifting away from the history of Dendroclimatology if we say consideration wasn’t made of the interconnection between temperature and precipitation. The reason given for chosing trees near the tree-line in the mountains is that there was reason to think they might not be precipitation limited, rain being more common at higher altitudes (wringing out residual moisture). Likewise, it was more unlikely that temperatures would exceed optimal temperatures at high altitudes; temperatures dropping rapidly at higher altitudes. That being said, I don’t know that these prima facie reasonable assumptions are actually true in many cases. First of all when we’re talking inland mountains there may well not be much moisture to wring out in the acutal situation making the trees actually precipitation limited (I think this is what Graybill & Idso were saying). Secondly, insofar as we’re talking trees which are especially adapted to high dry environments, their optimal temperature may be quite a bit different than that of more normal trees. Therefore they might well, especially in timespans measured in centuries, go through periods where the temperatures are too high.
My second point is that I don’t buy the basic premise which has been stated here as animating dendroclimatology; that at any given time there’s only one limiting factor. Take three of the major factors, temperature, precipitation and a generalized ‘fertilization index’. Plot them all vs rw on one of those triangular graphs for a given location and you’ll get a bunch of isorings (isobars? isotherms?) with probably only one highest value somewhere in the middle of the graph (though it’s possible there could be multiple optima). The basic assumption of treering analysis for climate reconstruction is that if we make a number of cuts through the graph connecting reasonable values for moisture and fertility, we will, in the region of likely temperatures find monotonically increasing ring widths with increasing temperature.
There, that’s about the best statement I can make of a scientific theory of tree ring width. It has the advantage of showing what should be known and available (or constructable); such a graph for a given tree species (or at least the portion of the graph needed) to be used as a temperature proxy. With computers it should be possible to produce tetrahedrial and higher dimensional graphs as well to be sliced and diced appropriately (to follow more than three limiting factors). Can anyone point to papers in the tree-ring literature which do something analoguous?
Dave,
One of the principles of Dendro is additive effects. I think it’s well understood that temp limited stands is a goal, not a method. Also, there are some (not enough) multiple regression studies.
Willis, That link doesn’t work. From the text you posted, it sounded like a seasonal observation (i.e. part of the year). Your earlier text clearly sounded like day to day data. It is not nescessarily true that overall RW will be reduced by temp increase, just because it is during a portion of the year. Look at my thought example again. Steve, will beack me up. He loves logic.
Steve, I guess I’m wondering why we don’t see people trying to improve chronologies or making observations of negative effects on RW from temp quadraticy. Fritts is an icon in the field, but its not obvious to me that he is any better than his follower ons. I don’t know the studies you are referring to. BTW, he is asking some stats questions about bootstrapping on the dendro listserv. I assume you are a member?
Thanks, Dave. I’d like to point out that the graph you describe would need to be constructed for each tree species, and possibly for sub-populations, for greatest validity, although even an overview analysis might be useful. In either case, it seems a big job, and as you imply, it seems likely it hasnt been done.
Which is why one often turns to external verification. I know the disdain for ‘spaghetti graphs” often shown here, but has anyone presented overlay graphs of reconstructions derived by independent means? Preferably with correlation stats calculated? Dendro, boreholes, sediment / isotope ratios studies (about which I still know less than I should) and so on? Cross verifications like that could lend strength to the assumptions and analyses being used in each of the areas, and could also highlight one of the methods as giving results out of accord with th others. I havent been able to find a broad between-methodologies analysis of this sort, but I admit I’m still a beginner with the proxy literature, and still even learning what the various proxies are.
Give me an example. And I’m not talking about Mannian principal components nonsense which isn’t regressing on multiple RW factors. If you can’t say “this component represents temperature and this one precipitation” it isn’t what we need.
Somebody cited some French study that looked at RW as a function of precip, temp, etc. I’ve even seen some that were Finnish that had sunlight and temp of different months. Hold on, let me Google Scholar.
#121. No, but I’ll look in. Did you notice the number of hits on that site? We get about as many hits in 2 days as they’ve got in the entire history of the site if I read it right. Fritts would have a better audience here.
TCO, did you see epica’s rant a day or two ago about the supposed lack of "sober data analysis" on this site? I thought that it was a pretty ridiculous comment for a climate scientist to make, especially if you compare discussion here with that at realclimate. On the VZ article for example, even allowing for differences in point of view, their head post on VZ was tendentious, but the followup discussion has been trivial. Their censorship catches up to them as there’s little sense of engagement in the discussion.
Yeah, I agree that that site has very little traffic. I invited Fritts to come here, but he begged off. He is quite an old man and has an infirm wife. I think the discussions here are quite technical and quite good. I don’t think they are purely technical as often you (and defenitely me) approach things more from a common sense, how do things work, perspective than from that of an educated professional. That said, I think the forum would be helped by participation of guys with good knowledge of the literature, of field techniques, etc. Rob Wilson is a good example. He probably can’t hang with you in terms of stats stuff, but he could enlighten a lot even on what/why people make certain assumptions. I think there is a hesitancy from some of the tree ring guys to wade in here, given their stats weaknesses. I mean really, MOST natural scienctists are weak on stats. Even good ones.
Click to access vaganov-nature-siberia-tree-snow.pdf
Reading this study again, I’m aghast. They use visual cross-dating. That’s a no-no per Grossini. Anyhoo, it’s a multiple regression. blows me away that decent long papers like this are in specialty journals and that Briff has every irrelevant little crap letter in Nature. But all the more reason for Steve to engage in the specialty literature and not in Nature. One has more length, it’s less of a club, and one can dig into foundational debates.
Click to access danis06.pdf
re: #127
Interesting article, though it just goes to show that where we don’t have historical records, attempting to determine what exactly RW or MX shows is problematic at best. How exactly would you expect to correlate RW with snowfall in 1283 in the US white mountains? I’m not saying it’s impossible, I’m saying that it’s presumptuous of the climate proxy reconstructors to think they’re anywhere close to being able to do what they say they’re doing.
re: #128 Likewise interesting, though of little direct value for pre-historical record use.
Just a little pull quote for the fun of it.
I’d have thought that any real attempt to determine trees’ sensitivity to climate is more dependent on high-resolution climate data than on a long timeline. What you would need is weather monitoring stations that have been in place for at least a couple of decades, then sample the trees in the immediate vicinity.
Does anyone know of any work like that ?
Willis, your link in #116 didn’t work. Here’s the correct one: http://www.publish.csiro.au/paper/BT04033.htm
Thanks for that, by the way. It’s good to see someone actually doing basic studies. I wonder if people are gathering more than semi-macroscopic data (i.e., more than average ring-width and density). There may be useful growth response information in such parameters as cell-wall thickness, cell volume, cambium vascularization, or lignin/cellulose ratios, etc. It’s my feeling that the only way to truly extract temperature from other influences is by collecting as many different sorts of parametric data as possible.
I read the paper, Will-Willie-Willis. Still not clear to me if the observations in Upper Kangaroo Valley are seasonal or annual. I think you need multiple years to make the judgement of signifant occurence of temperatur quadraticy. Also, the convict-penned paper seems long on background and short on samples. 5 trees from 3 sites or something like that. Not good, Ozzie.
TCO, please stop the silliness with names. Willis uses the name Willis here, let’s use it here.
I started using it. That last one, was just me making fun of myself. Plus I’m sober now. Had a great weekend…
Re 133, TCO, I must admit, I find your childish games with my name most revealing about your level of maturity and sophistication … but it’s not a problem, I did the same thing in high school myself, so don’t worry, I suspect you’ll grow out of it.
On the other hand, thank you for your comment on sample size. I agree with you about the small sample size in the Australian study … but I note that you have not made the same objection re the Treydte et. al. paper. Probably just a coincidence …
Treydte used 7 trees from one of four sites, and “4-5 trees” from each of the other three sites.
You have a comment on that?
w.
Umm…it sucks. Probably about twice as numerous as the Oz study, but still not up to par, given all the possible confounding variables. I would like to see within site variation, though. I’m very interested in that.
One and the same proxy can be a proxy for T,P and even more quantities. One example are records for North-East Brasil rainfall strongly related to ENSO and therefore to the typical SST key regions (NINO3 etc.). When you go out of the directly observed intervall you make assumptions about stable teleconnections (e.g. ENSO goes on provoking displacements of the Hadley-Walker cell and therefore producing rainfall anomalies in Brazil in this case. The problem of Soon/Balliunas is that they didnt spend one second (or one line in their article) to think about these kind of climate relations (and it’s therefore it shouldnt have passed ever peer review).
Otherwise I agree with the critic here (point 1 and 2 of the beginning of the post).
Steve, since it is a non-existant thing, why do you still keep this beutiful picture “a tree in the desert ” here? I am fed up with this picture. It gives CA readers wrong visual effect. Almost all the CA readers regard it as a Dulan juniper, although it is definitely wrong. I suggest you delete it as far as Science is concerned.
twq, I suspect that you have posted this in the wrong thread … but in any case, since you are upset about the picture being used inappropriately, I’m sure that you have contacted Professor Shao and asked her to remove it from her publication.
What was her reply to you?
w.
Whether Shao remove it or not is irrelative to that steve should remove it. If you insist keeping it here, it is your fault. What do you say?
twq, you are entrely free to post of a picture, or even three pictures of Dulan junipers which you judge to be representative. Now, please, can we move this back to the correct thread?
re #141,
My position would be to err on the side of caution. The picture has not yet been authoritatively sourced, and if a collage, then CA is open to a charge of misrepresentation. I emailed a friend who works professionally with computer graphics and prior to that for decades as a photo engraver and asked whether it looked genuine from the technical point of view. His reply:
“I would say with absolute certainty, the image of that tree on a desert is fake, in as much as the tree has been cut and pasted onto the background. If you were sitting here in front of the image with me I could point out my reasons for being so certain.”
One Trackback
[…] worthy than the hockey team's cherry picked tree rings? For their part, the hockey team is a bit lacking in consistency WRT deciding what is and what isn't a suitable temperature proxy. In any event, nothing you've posted shows causation between the weather in Peru and alleged AGW. […]