If you actually look at the medieval proxy index of the "other" studies (Briffa 2000, Crowley and Lowery 2000, Esper et al 2002, Moberg et al 2005), the medieval proxy index is usually just a razor’s edge less than modern proxy index – just enough that the study can proclaim with relief that the modern values exceed all values in the past millennium. However, there’s a lot of data handling that is a lot like accounting and there are decisions that are like accounting decisions. If the profit is very slim, wise investors know that there were might have been some decisions where choices were made to get the accounts into the black, which might equally have gone the other way.
My view of the "other" studies is that the relative levels of the medieval and modern proxy index are very non-robust and dependent on a very few series – bristlecones for example. Another issue of this type is the substitution of the Yamal series for Polar Urals, once the Polar Urals update showed a high MWP value. In February of this year, after about 2 years of trying, I got some data from Esper on the Polar Urals Update and posted a few posts on this topic a few months ago. See Polar Urals: Briffa versus Esper Polar Urals Spaghetti Graph
I got a bit off this topic during the NAS Panel and some other issues, but I re-visited this with a quick and interesting calculation. Of all the reconstructions, Briffa 2000 is by far the easiest as you don’t have to run the gauntlet of weird methods. The measurement data for key sites (Tornetrask, Yamal and Taimyr) is unavailable but there is still analysis that can be done without a complete file.
Briffa 2000 uses 7 canonical series – Tornetrask, Yamal dba Polar Urals, Taimyr, Yakutia, Jasper aka Alberta aka Athabaska, Mongolia and the Jacoby treeline composite. Most of these recur in every subsequent study and all the "other" studies can be said to reflect slight variations of this composite. Briffa does a simple average of available data. His series are archived here
so emulating Briffa 2000 is a matter of minutes rather than months (other than the measurement data.)
In my earlier posts, I was pretty sarcastic about the substitution of the hockey-stick shaped Yamal series for the high-MWP Polar Urals Update as being opportunistic at best and about the Polar Urals spaghetti graph – if you had spaghetti at a single site, how come all the multiproxies seem to agree so well?
But did this "matter"? Let’s check out the impact of the single substitution of the Polar Urals Update (as used in Esper) back into the Briffa 2000 roster. Recall that Briffa et al (Nature 1995) was about the Polar Urals, claiming that the old version showed that 1032 was the coldest year of the millennium. So Briffa knew all about the Polar Urals site (which has been used directly or as the aka Yamal) in every study.
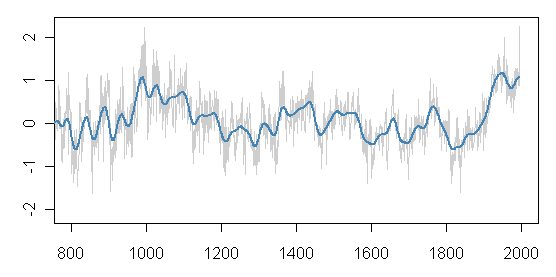
The Briffa 2000 reconstruction, as shown below, has a highish MWP, whichis just a titch less than the modern values. The medieval values (averaged) are just a titch lower than 20th century and some years look as high.

Figure 1. Briffa 2000 reconstruction.
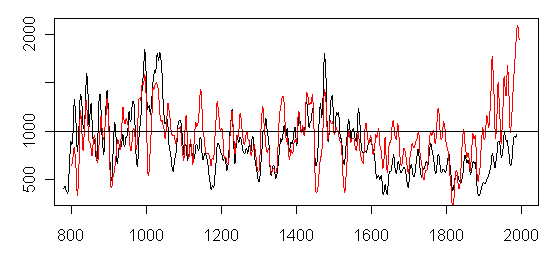
Now let’s the review the bidding, by showing the difference between the Polar Urals update and the Yamal substitution – the one with a pronounced MWP, the other with a pronounced 20th century, otherwise quite a bit in common. But hardly a very "robust" method when two nearby sites yield such contradictory results.

Figure 2. Black – Polar Urals; red- Yamal.
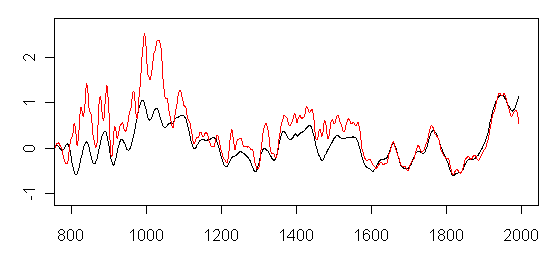
Now here is the result of simply making one subsitution. The relative position of the modern and MWP periods are reversed and reversed substantially – this is with the subsitution of just one series.

Figure 3. Briffa 2000-type reconstruction, with Polar Urals update.
Yeah, I know that they say that they couldn’t calibrate the Polar Urals Update and "had" to do the substituion, but somehow Esper managed to do a calibration and there is a lot of similarity to Yamal so the calibration couldn’t be all that bad. (How does Esper ensure that the MWP stays below modern levels? Of his 8 or so MWP series, he has not one but two foxtail series, which help his accounting).
By the way the Polar Urals Update has nearly double the correlation to gridcell temperature as Yamal In this connection, I checked the reported correlation to gridcell temperature from Osborn and Briffa 2006 at Science for Yamal and they are incorrect. I even got the temperature data as used by Osborn and Briffa and the correlation still doesn’t match, but that’s for another day.
If you can get such different results merely by substituting Polar Urals Update for Yamal, how can you assign "confidence intervals" to such a reconstruction. When results depend on such seemingly minor accounting decisions, you have to examine each accounting decision as each decision may be material,


17 Comments
Interesting, but ultimately not very surprising.
You say “By the way the Polar Urals Update has nearly double the correlation to gridcell temperature as Yamal In this connection, I checked the reported correlation to gridcell temperature from Osborn and Briffa 2006 at Science for Yamal and they are incorrect.”.
What method did you use to calculate the correlation? What method did they use? Could that explain the difference? And, how do you determine the best method of calculating correlation in this situation?
Regardless of which is the “right” proxy to use in any given circumstance, the result really should be a lot more robust than this. Otherwise, I wouldn’t trust it. Given the time scales and geographic scales involved here, there should be many ways to arrive at the same answer. Anything less suggests this data is not representing what they are trying to get it to represent.
I still can’t believe ANYONE can support the results of studies like this, that are that sensitive to ONE damn series. The studies are especially stupid, given that it is theoretically impossible to detect a one or two degree change in temperature in tree rings.
Some interesting links:
“Fraud in Science”, http://www.aaronsw.com/weblog/001616
Ruthless Science Fraud at the University of Toronto – http://ca.geocities.com/uoftfraud/ruthless.htm
Really there is a continum, or slippery slope, of ‘results management’ with such things as exaggerations, selective use of data and post hoc justifications at one end, and justicable actions at the other. Call a spade a spade.
The Enron of climate science. The “razor’s edge” of the “profitability” of the current “global average temperature” versus the reputed Yamal MWP “baseline” sets off my own chicanery alarm bells.
About the MWP, I read an article claiming Al Gore in his movie uses hockey stick charts and makes some kind of joking reference to the MWP. Anyone see the movie that can confirm? I have no interest in seeing the Gore movie unless someone can tell me it is substantially different than similar recent ones on HBO and PBS.
I saw the lecture on UCTV, but I can’t remember whether he uses the Hockey Stick or not. He does have some rather remarkable images from all over the world which show the impacts of AGW, though.
As far as I could tell, and this will be disputed by many here, the science he discussed was pretty much on the nose. Most of you guys here are pretty hard core denialists, you won’t even admit that MBH99 said that (so called) MWP temps reached the mean of 20th century temps and only called out late 20th century temps as exceptional.
We’re not denialists in here. Read around, every single participant in the recent NAS panel, except Mann, of course, stated quite clearly that we cannot estimate the temperature 1000 years ago to within a half degree celsius. Without knowing what the actuals were, any claim made by Mann regarding MWP comparisons to ANY time in the 20th century are specious at best.
Mark
John,
If you think that replication is NOT a required element of good science and that it’s OK for authors of published studies to refuse to provide all their data and methods (code) for the purpose of independant replication, then Mann is right and we are all denialists.
If you think there is nothing wrong with admited non-statisticans, like Mann, to invent novel statistical methods and use them in their studies without first providing a proof of the methods (in appropriate journals), then Mann is right and we are all denialists.
I could go on, but I think these two are enough to make my point. Now go ahead and tell me why I’m all wrong and how we should all just trust Dr. Mann because he’s so much smarter than the rest of us.
I’m not sure that Mann’s methods were all that novel. In MBH98 he cited several papers which clearly dealed with the statistics of climatology. I am really not a statistician and know very little about the methods which MBH used. However the fact that there have been around a dozen papers which have replicated his results, many using different techniques, would seem to indicate that the basic conclusions of the paper were correct.
BTW, for an example of Steve’s dissembling, he complains about Mann not computing the r2 statistic and then crows about how his source code *did* compute the r2 statistic as if this was some remarkable finding of fraud. Yet MBH98 clearly does state that they did compute the r and r2 statistic, but stated the beta (which I assume is RE) had greater validity even when r2 was marginal. He clearly stated this in the methods section of the paper and explained why the beta was mo’beta. Don’t flame me too much if I misinterpreted, I have never taken advanced statistics and it has been a long time since I studied the basic stuff; never have used it BTW, so I have forgotten most of it.
Re #9 – You are convincing us you do not understand what Mann did, but of course he was correct.
Really John S!
If you don’t want to get flamed you shouldn’t come into a place where you clearly haven’t read much of what’s available, admit you don’t know what you’re talking about and then accuse the owner of the blog of lying.
In the first place, Steve didn’t accuse Mann of not calculating the R2. He accused him of not reporting it in the paper except for one place where it was meaningless. Steve explicitly accused Mann of having calculated the R2 but not having reported it because the value was near 0. That’s why Steve had every right to crow when Mann’s code was released and it clearly showed he did a calculation of R2 in other places than where he’d reported it.
Next time you feel like accusing Steve M of lying, it might be nice if you’d actually quote something instead of just making it up.
My understanding is:
* Mann reported that RE and R2 verification statistics were good, in his paper(s), but did not report the actual numbers.
* Steve calculates R2 of his emulation of MBH’s work and finds it’s insignificant.
* When asked about the numbers, Mann later said “Of course I did not calculate the R2 value, that would have been silly” (or something to that effect).
* Steve gets a hold of his source code and sees he DID calculate them, and they WERE insignificant, in contradcition to his claims.
Keep reading Mr. Sully. ALL of your points (in 9) have been addressed and rebutted before, when offered up by previous graduates(?) of RC.org. Welcome to the light, though it may take some time for your eyes to get used to it. Then again
Re: former Vice President Gore — it was reported that he also triumphantly regurgitates the unnanimity of the AGW consensus as proffered by Dr. Oreskes in http://www.sciencemag.org/cgi/content/full/306/5702/1686. I can’t wait for the Director’s Cut DVD where he explains the existence and impending extinction of our species by ManBearPig.
For those that aren’t familiar with manbearpig. Here’s wikipedia.
http://en.wikipedia.org/wiki/Manbearpig
Mr. Sully,
You are obviously and admittedly very uninformed on the subjects involved, and so you’ll forgive me if I don’t put much stock in your opinions.
RE: “the statistics of climatology” – right up there with “The Harvard Dept of Symbology,” eh? Robert Langdon I presume?
Steve M,
When I see this kind of blatant cherry-picking, it makes me ill. This is highly reminsecent of the strip-bark vs. full-bark bcps. Faced with a choice, alarmists always takes the chronology that has the steeper 20th c. slope.
4 Trackbacks
[…] Briffa 2000 and Yamal […]
[…] reconstructions that supposedly “support” the Hockey Stick. For example, in June 2006, I showed the direct impact of a simple sensitivity study using Polar Urals versus Yamal – an issue […]
[…] was also aware that Steve McIntyre had already analyzed this paper, and in this post I found important information on how to contextualize Briffa’s work, as well as his original […]
[…] was also aware that Steve McIntyre had already analyzed this paper, and in this post I found important information on how to contextualize Briffa’s work, as well as his original […]