The relationship of bristlecone/foxtails to gridcell temperature is something that I’ve discussed at length, but, surprisingly, I’ve never illustrated it at the blog. This is a type of relationship that, in some ways, is well suited to blogs. It’s simple to discuss; it’s important. It would be amply illustrated and discussed in business feasibility studies for equivalent issues, but one tends to simply cite the statistics rather than illustrate them in detail in an academic article.
I was reminded of this relationship both by re-visiting Osborn and Briffa and by an interesting recent presentation by John Christy. Despite the claims of Osborn and Briffa, I am simply unable to verify their claims of a significant relationship. Their statistical presentation appears to have neglected the most elementary considerations, such as calculating a t-statistic as a method of assessing significance in light of degrees of freedom.
Read and weep.
Christy’s Presentation
In Christy’s recent presentation sponsored by the George Marshall Institute, he happened to discuss temperature changes in the California Sierra Nevadas, well known to readers of this blog, as the home of the foxtails (the bristlecone cousins) and just across the Owens valley from the most important bristlecone site (Sheep Mountain). As I’ve mentioned on many occasions, the foxtails and bristlecones are not just relevant to MBH, but, together with the Yamal substitution, are the important proxies for establishing HS-ness in 7 main studies (in addition to MBH, also Crowley and Lowery, Esper et al 2002, Mann and Jones 2003, Rutherford et al 2005, Osborn and Briffa 2006 and, almost certainly, Hegerl et al 2006).
Wouldn’t it be remarkable if all of these studies had neglected the simple precaution of verifying that there was a statistically significant relationship of these essential proxies to gridcell temperature?
Here is a location map from Christy et al 2006.. In this case, the mountain sites appear to be on the west side of the Sierra Nevadas, while our interest is on the east side. I’ll try to see if there is some east side information, but for now, I’ll illustrate the west side information.
Christy compares valley temperatures with mountain site temperatures. To put this into context, I’m first going to show the Had CRU gridcell series.
Figure 2. HadCRU gridcell annual temperatures for gridcell 37N, 117W.
If you compare this to Christy’s "valley sites" in the top panel of the figure below, then you see that some main features are common to both: for example, the high values starting in the late 1920s; the sequence of declining values in the early 1960s; the secular upward drift. Christy contrasted this upward trend in valley temperatures with no change in the Sierra sites in the graph below, which he attributed to a land use effect: irrigation.
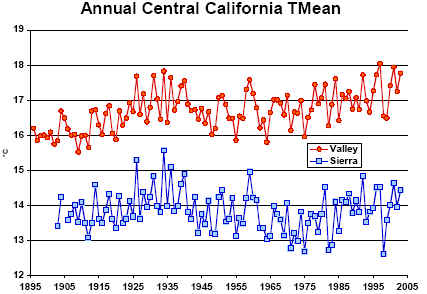
Figure 3. From Christy et al 2006 illustrating difference between valley and mountain temperatures. Time period differs from other graphics.
I’m going to compare this graphic to gridcell temperature series and proxy series using an 1870-2000 period. When I was doing this, I was able to re-size the various figures for comparison. This hasn’t come out very successfully on the blog (and I may re-size this later, but you’ll have to be content with a little squinting back and forth for now. Next here is a plot of the foxtail data over the same period. Even if you compare it to the gridcell data, you notice some obviously different patterns.
Both series have some locally high values in the 1930s, but the foxtails appear to be a little later. In the early 1960s, there is a decline in temperatures and they stay at fairly low levels through the 1970s. In contrast, there is a huge pulse in foxtail growth, with no analogue in the temperature record. In the late 19th century, there is also a pulse in foxtail growth, and looking this time at the gridcell temperature, there is no trend whatever in gridcell temperature.
This is reflected in the basic statistics. Using the gridcell series (and the failures will be exacerbated by the mountain data), the gridcell correlation for the foxtails is 0.048. Quoting simple correlations is a pernicious habit of the Hockey Team: for statistical significance, it’s far more relevant to look at t-statistics (especially when we discuss decadal correlations as we will in a minute or two.) Here the r2 is 0.002; th adjusted r2 is -0.006; the t-statistic for proxy on temperature is an insignificant 0.52 (without even worrying about autocorrelation) and the DW is 0.986.
Below the foxtails, I’ve shown the same plot for the MBHPC1 (used in Mann and Jones 2003; Rutherford et al 2005, Osborn and Briffa 2006 and, I’ll bet dollars to doughnuts, in Hegerl et al 2006. In the long version, this is little more than Sheep Mountain which has about 80% of the weight. This is just across the valley from the foxtails.
Here the correlation is -0.005; r2 is 0.000; adjusted r2 is -0.052; t-statistic is -0.009 and DW is 0.869.
These results obviously re-state the position of Lamarche et al 1984 and Graybill and Idso 1993 (and even Biondi et al 1999) that this growth is not related to gridcell temperature.
The Studies
While I’ve discussed bristlecones primarily in the context of MBH, as noted above, they continue to be used, most recently in Osborn and Briffa 2006, which purports to verify a relationship to gridcell temperature for each proxy. Let’s look at their values and statistical analysis and see how they stack up. Osborn and Briffa report a correlation of foxtails to gridcell temperature of 0.18, whereas I was only able to replicate 0.045. Osborn and Briffa explained the difference as being due to their use of CRUTEM data rather than HadCRU data (although HadCRU was cited in the article). CRUTEM data began only in 1888 while HadCRU data started in 1870. Osborn and Briffa explained by email that the earlier values in HadCRU2 were "spurious" as there were no land stations available (although GHCN has land stations commencing by 1870.) It appears likely that both data sets have not incorporated all available data. Obviously this is a very unsatisfactory "explanation" and raises as many questions as it purports to explain.
Osborn and Briffa did not even do a simple t-test although this is available merely by obtaining the correlation as the regression coefficient between two scaled series, yielding the t-statistic in the process. By at least doing a regression, one can also get the DW statistic which shows extreme autocorrelation in the residuals. These methods have been available for nearly a century.
The situation with the MBH PC1, astonishingly still in use, is even more peculiar. Osborn and Briffa said that they did not test this series, relying instead on previous results from Jones and Mann. How hard would it have been to do this? It took me about 10 seconds. Or maybe they didn’t like the result of 0.00. (Not reporting adverse statistics is again an all too frequent Hockey Team practice.) Osborn and Briffa quote Jones and Mann as having a "decadal" correlation of 0.52 for the PC1.
As a first test, I calculated decadal averages in decades starting in year 6 and repeated the above calculation. Because there are only 9-10 degrees of freedom, one expects that some apparently high correlation might not be accompanied by statistical significance. In this case, I got a correlation of 0.38 (as compared to 0.56 cited in Jones and Mann 2004, quoted in Osborn and Briffa 2006). Looking back, they did their calculation on a 1901-1980 period, while I did it for the full period. I’ve not bothered trying to see what I get for 1901-1980 as I don’t think that it matters anyway. The adjusted r-squared is only 0.056; the t-statistic is a mere 1.29 (not significant) and DW is a ghastly 0.36.
Jones and Mann obtained their results using a gaussian filter of length 13 years. I know that the justification is an attempt to get "low-frequency" results, but then you need to allow for the reduced degrees of freedom somehow. For a size-up, decadal averaging seemed a more sensible way of keeping track of degrees of freedom. Anyway, I then did the same thing using their filtering and still got awful results. The adjusted r-squared was -0.002; the t-statistic was only 0.85 and the DW an unbelievable 0.06. The price of smoothing is that you lose degrees of freedom, the chances of having reportable statistical significance vanish quickly and results are ambiguous.
This is not high or fancy statistics. This is freshman statistics, probably high school statistics. People criticize me for being sarcastic, but here I’m just trying to make a statement of fact. These are about the most elementary statistics that it is possible to conceive. And yet here we have an article prominently featured in Science that has neglected these elementary precautions. Given that Briffa is IPCC lead author for the millennial paleoclimate section, one might hypothetically wonder whether Briffa, like Mann, might take the opportunity to publicize and feature his own results. It’s fun to speculate about these things.
All of these statistics were calculated with the HadCRU data. It looks like Christy’s data would yield similar or lower results, although it’s hard to imagine worse results.


118 Comments
Steve, I assume you don’t have Christy’s temperature series in digital form. If you can get them from him, it might be an interesting illustration to show how much worse the correlation is using his mountain data. It might also be interesting to examine the statistical relationship between his two series and the “official” grid cell series. Finally, if there is a suitable local rainfall series available, it might be interesting to do a multiple regression of the foxtail series on local temperature, local rainfall and atmospheric CO2. In the process, you could also discuss the autocorrelation issue and how to handle it in the multiple regression context (thus making another implicit criticism of the Hockey Team methods). This could be all be written up as a short piece that is motivated by showing how critical the foxtails/bristlecones are to the HS reconstructions.
I know you mentioned you can’t (easily) do it but it would be so much easier to follow what you’re saying if we could see the temperature graph and the proxy graph(s) alongside each other with the same scale and same rendering style. That may be obvious, but I thought I’d point it out.
Steve: I’m aware of this. I don’t have Christy’s data in digital form. I’ll try to get it and then I’ll update this.
Wow. I even understand all the statistics here. It is simply unbelievable that these “scientists” would publish this crap. BTW, I wonder if the growth spurts are somehow related to the irrigation; i.e., more humidity and moisture. I am thoroughly convinced that tree rings almost always show moisture-related signals. Temperature related signals would be far too small to measure.
This one’s going to leave a mark.
A few random thoughts:
* During times when the East Pacific High is dominent, inversions are common, with the altitude typically being somewhere between 500 and 2000 feet. In an enclosed basin such as the San Joaquin Valley, the effect is magnified.
* In Eastern parts of North America, there is often a negative association concerning so called “acid rain.” Whereas, other than some purported claims I read during the 80s, the issue is not so clear cut here out west. Consider the issue of soil alkalinity build up (aka “caliche”). This is an inhibitor to aereation, water ingress and rooting. It might be that acid rain actually helps certain plants, in our part of the world. Given the situation with air pollution in the San Joaquin Valley, acid rain definitely occurs on the Western Slope of the Sierra. “Food” for thought?
* My general observation throughout the Western US, and the Southwestern US in particular, has been that the single most important factor governing tree health is the interplay of moist years and drought years. A tree stressed by drought can incur knock on effects for years after. Conversely, a tree well watered for a couple or three years can continue to thrive for a few years after.
* At the elevations where Foxtails live, the degree of perisistent snowpack (e.g. pack that lasts well into late spring and summer) can have profound impacts on moisture availability during the annual precipitation minimum (e.g. summer). The combination of a healthy snow pack and a summer lacking in significant convective precipitation events can provide a significantly counterintuitive annual growth outcome versus the local precipitation record.
Steve, I think that it would informative if you included figure 5 from Graybill & Idso 1993 in this post. It compares the Sheep Mountain bristle cone tree-ring index chronologies for strip-bark and full-bark. Only the strip-bark shows the pulse.
Steve, I had a question about figure 2, GridCell 733 37N 117W, is this the 5 deg by 5 deg gridcell for 35-40N and 115-120W ?
Steve: Yes. 733 is the number according to my indexing of gridcells
That’s as far as the hockey-team and their cheerleaders would get before crying foul and throwing everything out.
The obvious next step here is to use the gridcell temperature data to take out the non-temperature component of the bristelcones and foxtails. Then, the improved series (which contains only the proven temperature component of the series) could be fed into the Mann-omatic and new and improved (and more robust) results obtained.
Mann (since he is such a serious scientist) would, of course, welcome this strengthening and extension of his method since it would answer those silly critiques put forward by industry-funded shills that the bristlecones and foxtails are not good temperature proxies.
#(. Terry, don’t lose sight of the fact that the bristlecones don’t just affect MBH, but many of the “other” reconstructions.
Regarding Sadlov’s comment #5-
I found this University of California book from 1994 to be interesting. Since it’s from 1994, the catastrophe du jour was acid rain and the hole in the ozone layer, but alarmist content seems to support the possibility that mildly acidic snow pack might be good for trees living in highly alkalai soils:
http://www.ucpress.edu/books/pages/6248/6248.ch10.html
So, the Bristlecones live in soil buffered from the negative effects of acid rain. Is it possible they are being fertilized by our pollution?
I’m looking at the ingredients of a package of Miracle-Groà⣃¢’¬Å¾à⠠all purpose plant food:
Top ingredients:
Nitrogen 15%
Phosphate 30%
Potash 15%
Boron .02%
Copper .07%
Iron .15%
Manganese .05%
Molybdenum & Zinc
Am I being hopelessly Panglossian, or does this appear to be a real possibility?
More brainstorming-
Someone might also want to look into the composition of dust blown out of the Owens Valley dry lake bed:
http://geochange.er.usgs.gov/sw/impacts/geology/owens/
Notice the geographical location of this dry lake bed in relation to the Bristlecones and Foxtails. Considering that dust traps in Nevada show some evidence of this dust, and judging by the satellite pictures of the dust plumes, and this explicit quote:
If the trees are in Alkaline soil, and they’re getting dusted by agricultural runoff dust that raises the soil pH, maybe the trees like it?
IIRC, in 2001 remediation was begun and attempts were made to keep the dust down by watering. (*If I’m not getting my California dry lakes confused. We’ve got a bunch of them.) Not sure how successful the remediation has been, but it would be another possible change to keep an eye on.
Ashby, take a look at this post http://www.climateaudit.org/?p=302. Look at the Bristlecone category on the right tab. I’ve posted up some site information on bristlecones from time to time.
Damn, you totally beat me to it! 🙂
BTW, the section on Acid Rain in The Skeptical Environmentalist (p. 179) lists some trees that showed positive growth correlation to acid rain, one of which was Virginia Pine. I wonder if the study tested other types of pines in various soils?
The source was Kulp 1995:529
Does anyone know how these bristlecone/foxtail pines are doing in light of the recent drought in the southwest that was responsible for the large-scale dieback of pinyon pine?
Click to access article14_2005.pdf
To foreshadow where I’m going with this: if we suppose tree response to temperature is nonlinear, perhaps the ones exhibiting the most negative response to the highest temperatures are lost from the tree-ring record during these episodic decline events (?). i.e. They die off, and are thus unavailable to the modern day dendrochronologist. If so, then the tree-ring record during the MWP might be heavily biased. (I mentioned this in a point last week on northern white cedar in Gaspé, QC. But I hadn’t thought of it in the context of the recent pinyon pine dieback situation, and its possible implications for bristlecone.)
It would be interesting to see a simulation of the effect of allowing for variable survivorship as a function of drought-caused dieback. I’ll bet it boosts MWP reconstructed temperatures substantially, with the degree of bias directly related to the mortality function and the degree of nonlinearity in the tree response.
#15. I haven’t seen anything on bristlecone updates and this is a HUGE beef of mine about the Hockey Team. Hughes did an update of Sheep Mountain bristlecone site, cited here, the MOST important site in the MBH reconstruction, in 2002. It is of great interest. I’ve repeatedly said here that I’d bet dollars to doughnuts that Sheep Mountain has not showed increased ring widths or else we’d have heard about it already. (This is based on experience in mining promotions – if drill results are late, it’s never good news, the promoters are hoping for some new data that will offset the bad results.)
Maybe you could contact Hughes and see what’s happening.
I will consider that. Although I hate to step on anyone’s turf. But I guess that’s what an audit is.
Meanwhile, have you considered the possibility – and this is worded very precisely – that this unusual subset of bristlecones is responding to temperatures in the rooting zone, and that it is just a tiny bit of warming just past some critical threshold that is generating a hugely disproportionate response? i.e. The rooting zone acts as a buffer which amplifies an otherwise weak signal? This would mean the hockey stick might represent relative temperature (i.e. temperature relative to some root development threshold) in that very peculiar circumstance (30cm below soil in alpine areas), and NOT air temperature below treeline. (Gives a new meaning to the term LOCAL response, doesn’t it?)
The hypothesis is based on this article: http://culter.colorado.edu/~kittel/TreelineLat_Koerner98.pdf
And I bet that could explain the Gaspé cedars as well. (NB: It would be very easy to do carefully controlled rooting-zone warming experiments to calibrate this process precisely! You could even do them on both britstlecones and Gaspé cedars.)
Meanwhile, the more I read on BP & PP disturbance ecology:
http://geochange.er.usgs.gov/sw/impacts/biology/fires_SOI/
the more it seems plausible that the nonlinearities of negative response to drought are being truncated (so you only ever see the positive part of the parabola), leading to “survivorship bias” that favours underestimated temperatures during the MWP.
I will look at the chronologies you suggest. Based on what I know already from areas where I work, here is my a priori prediction: bristlecone have responded negatively to the 2002 SW US drought. i.e. If you measure responses in the years immediately following the drought, you see the (-) impact. Corollary: if you measure them ~1000 years later those trees are long dead, and th (-) response is lost to the dendrochronologist.
I will continue to search for some US SW temperature data to use in a simulation test, but if you could point me there 🙂 it might save me a few hours of searching. Then I could show you what I mean about honest Monte Carlo/bootstrap calibration methods, and how they would lead to huge reconstruction confidence envelopes. (Thus putting the HS in its proper perspective.)
That is a very good post bender. I never considered survivor bias and rooting zone temperatures. I look forward to your Monte Carlo results. 🙂
For a 2003 paper on “survivorship bias” see Tree Ring Research 59: 29-36. It talks about insects, but as far the mathematics would go (none of which are shown in that paper), drought would be no different. (The paper shows that there is little evidence for survivorship bias in this system over short, 50y time horizons, but goes out of its way to point out that it could be a problem for longer time-horizons, or in other systems.)
#!7. bender, don’t bother foraging around for data. I’ve already done that and have collated lots of relevant information. I can probably even locate it. I’ve definitely collated CRU gridcell information for the relevant gridcell for White Mountains; I’ve also collated some local temperature data obtained from Goodridge, including data from about 10 miles away from Sheep Mountain from 1951-1980.
There are other interesting biases which don’t necessarily apply to bristlecones, but do apply to Briffa’s chronologies. Many medieval trees are higher than the modern treeline.
Do you want to try some simulation experiments? Here’s a proposal. If you send me a suitable temperature series, I’ll graphically/numerically demonstrate in a report the principle of ‘honest Monte Carlo bootstrap calibration’ using one of the BP series (you pick) and show you why I say it will inflate the reconstruction confidence envelope. If it looks promising, then we proceed further (e.g. bring in other BP chronologies) with the goal of making it a joint paper (preferably with a statistician as co-author). At any point either party can break off the analysis, in which case ownership (i.e. rights-to-publish) of the intermediate products (code, datafiles, report) falls to CA. If all goes well, we consider a second paper on survivorship bias in temperature reconstructions resulting from drought-related dieback stripping nonlinear temperature responses from the tree-ring record.
Steve:
“Many medieval trees are higher than the modern treeline.”
Whiel this is an interesting fact, remember that for a treeline to move upwards, many conditions must be met. Among them, possibly vertical transport of seeds if no seeds have survived from previous groves, and conditions adequate for recruitment and survival of new seedlings for enough years for that to happen. But a grove can (in the limit) die in a year.
Tree line analysis must include recognition of temporal constraints and of differences between conditions adequate for survival and those necesary for recruitment and establishment, and one can not simply compare present and past treelines and make conclusions about today’s climate vs that in the past.
I suspect from what I’ve read that bender knows this better than I, but I like to make sure the basics are recognized when they matter.
All kudos to bender ! Go for it guys, I, for one, look forward to reading any jointly authored papers.
#21. Sure, I’ll contact you offline.
On the idea of temperatures in the rooting zone as the primary factor in producing hockey stick-shaped growth responses in treeline conifers … be sure to read the article mentioned earlier:
Click to access TreelineLat_Koerner98.pdf
Written by a botanist and reviewed by Schweingruber, this paper explains why it is night-time temperature within the rooting zone during the spring and fall – and not global daytime air temperature throughout they year – that is most critical to treeline growth. If Koerner is right, then warming below the 3-5°C soil temperature threshold would produce no effect of increased growth, and warming above the 3-5°C threshold would produce a strong and sudden effect. Sound familiar?
i.e. The steep slope of the BP and other treeline chronologies reflects a thresholded response. Which means these data can not be used as proxies until the threshold effect has been accounted for. Failure to do so would lead to an exaggerated reconstructed warming trend for the 20th century.
There appears to be enough data behind this assertion that additional experimentation may not be required to quantify the threshold effect.
Does anyone have a long-term instrumental record of soil temperatures under tree cover in alpine areas? When you threshold it at 5°C and feed it through a root metabolism response function I bet the result is HS shaped, with the slope of the blade more than three times that of the instrumental record for air temperature.
Would be very interesting & informative to compare North vs. South-facing aspects.
This thread died, strangely enough, when Lee came in. So … can we get those temperature data referred to in #20? I say we try this bootstrap calibration/spaghetti/uncertainty envelope thing using BCP, and we throw in survivorship bias as one of the tastier B&C ‘flavors’ to test. Also, we plot the spaghetti stands with line shading proportional to the width of the confidence interval, so that we can watch Bloom & Hearnden et al. squinting at the end-product, combing it for significance. We give them a turnkey R script so that they can tinker with it all they like – the facts won’t change.
Sorry about that. I’ll try to do it tomorrow.
Steve
I think you’ll find that if you continue on this tack – looking at the very basics as per here, then errors discovered at this level will be far more damning than finding errors in the more complex areas (PCI’s etc) previously uncovered by your sleuthing.
Most of the errors are in the simple initial assumptions which most seem to be taken as given, rather than questioning them on the basis that “it’s so basic they coudn’t have boobed at this level!”. Well they do (RC etc)and, I suspect, the evolving absurdities will continue as they continue publishing papers based on fundamental errors in the initial steps like you have shown here in this thread. It’s the embarrassing errors in the Stats 101 level that will be their undoing.
Keep up the excellent work.
(Incidentally I see you did not get on the hitlist for the California legal case but Ross did. Strange).
re AG Lockyer, State of California lawsuit targets — neither was Dr Essex. Most likely because pulitzer-pretender Gelbspan’s hit list is small for now, but growing as his expands enemies list. I wonder if the usual suspects will rise in defense of these scientists,as they did for Dr Mann? Mr Bloom and Mr Muirgeo are certainly popping the bubbly (CO2) this week, eh?
correction: as he expands his enemies list.
Re #28:
I think Louis Hissink is on the mark. Consider this: calibrations are subect to estimation error, right? (i.e. There’s a standard-error-of-the-estimate (SEE) associated with each of the parameters estimated in the calibration regression.) Well, then why, during the reconstruction step, do they use the calibration regression parameters as though they are NOT subject to error? If you’ve got positive and negative responders in the real world, it suggests to me that the SEE’s in calibration are quite high. It is not correct to ignore them in the reconstruction step. What you should do is a bootstrap reconstruction step where you are iteratively resampling from the calibration parameters. Think what this will do. Sometimes the calibration parameters will be high, sometimes low. Maybe sometimes even negative!
Add a second stage of uncertainty – whereby you vary the mix of chronologies used in the calibration (sometimes the postive responders predominate in the sample, sometimes the negative responders) – and the SEEs are going to skyrocket.
Propagation of error. B&C05 Eq. 1 p.3. Eyes on the prize.
#20. I’ve posted up 3 temperature collations making annual series for the target season for the 14 OB series.
HADCRU2 – http://www.climateaudit.org/data/osborn06/vosb.annual.txt – starts 1851
CRUTEM2 – http://www.climateaudit.org/data/osborn06/crutem.annual.txt – starts 1856
Briffa Email version (8 cells) – http://www.climateaudit.org/data/osborn06/vbriffa.txt – starts 1856
A collation script posted for reference and documentation – I’ve tidied it a bit – but do not vouch that it is turnkey is at http://www.climateaudit.org/scripts/osborn06/collate.temperature.txt
I’ve partially tidied some of my replication script on Osborn-Briffa and will try to post it up in the next few days.
Cool!
RE: #12 – That dust from those lake beds, significantly, often contains borates. Now, what happens when you add water (or melting snow) to a borate?
Some interesting papers based on the abtracts:
Click to access PACLIM%20abstracts.pdf
This a repost from 1 Sept 2006 More Bender on Hurricnane Counts, so the numbers correspond that post. Re #268C and #296, TCO (and Dano), I believe you were referring to Graybill & Idso 1993 paper “Detecting the Aerial Fertilization Effect”. If you would revisit that paper and look at the figure 5 on page 89. Figure 5 compares the full-bark and strip-bark Sheep Mountain Bristlecone pine tree-ring index chronologies. Kindly read the discussion about the differences between the full-bark and strip-bark also on page 89. In particular the statement “The two chronologies are almost indistinguishable until about 1870, when the one based on strip-bark trees begins a sustained, low-frquency trend of radial growth increase. A more limited low frequency upward trend is also present in the full-bark chronology since about 1890.” Please give us your thoughts on which tree-ring series or either you would use if you were doing a temp reconstruction, especially if your calibration period is during the 20th century.
36:
Phil,
Please give us your thoughts on which tree-ring series or either you would use if you were doing a temp reconstruction, especially if your calibration period is during the 20th century.
Of course, knowing what we know now, we have no need to agonize over how best to go about doing a first paper, as that has already been done close to a decade ago.
Thus, we would build upon past knowledge and write our own paper, rather than thinking about the methodologies of something that had hardly been done before.
Therefore, with all the discussion richocheting about, we know we would use multiple proxy indicators to get the widest range of data for init calibration, because there is evidence from Eur and US that CO2 fert might be affecting tree growth and we want the dendro record; altho: 1. my understanding of the literature [1., 2., 3.] is that not all subalpine spp (you want the long-lived ones) are well-understood nor affected by fert – but the Graumlich spp are different phys than Pinus a. and 2. to my knowledge, confirmation of the G&I paper hasn’t a. been done in the field, b. been shown with a subseqeuent paper [nor, BTW, has G&I been audited] or c. whether earlier spring increases degree days. Nor have I seen work on whether drought has been ruled out for Pinus a. sites*, nor have the recent explorations** of temp regime shifts been completed so in my mind touts are limited here due to there being only one paper on the subject. And we know we have been depositing excess N and I haven’t found a paper ruling that out.
Of course, other proxies are affected by man’s pollution as well, thus reinforcing our need for multiple proxies.
I’m sure there are ample opportunities, Phil, out there if one feels the need to look at calibrations for a particular tree species. Have you written to any of the primary dendro researchers with your ideas on how to improve their past techniques to improve the robustness of our knowledge?
Thank you for asking Phil.
Best,
D
* meaning less spring snowpack and longer growing season, but less soil moisture confounding factor if no summer precip.
** Can’t get html to work up there: [1.]
Steve:
Osborn et al:
So, there is a low-pass filter. Finally found it.
#37:
One option is to just ignore all proxy data.
RE: #37 and others – just a quite field comment here regarding the “Southwestern Drought” and “early springs” vis a vis foxtail and bristlecone areas in California. In fact, we’ve not been having a drought this far west at all. We’ve actually been slightly above normal the past few years. Also, spring snow pack has been massive the past 3 years. For example, this year, there were campgrounds in the Yosemite high country which were still not open as of the 4th of July. The “Southwestern Drought” has been impacting only the eastern 1/2 of the US SW. Snowpack has followed suite.
quite? quick…. brain fart …. need coffee ….. 😉
#39,
I can confirm that myself, Steve. I own some timberland in that map at the top of the page in Tulare county. Its been snowed in late in the spring since 2003.
And I often get home via the Owens valley; the mountains surrounding which have had above normal snow packs late into the spring and summer. Don’t know what the precip records are for the eastern Sierra and White mountains but the snow pack has been staying on the ground longer than normal.
Which raises a question. The growth season for higher elevation trees such as bristlecones is essentially after the precipitation season ends. I wonder how much, if at all, growth is dependent on a cool spring and summer providing water for growth as opposed to a wet winter, especially on the east slope of the Sierra.
41:
The growth season for higher elevation trees such as bristlecones is essentially after the precipitation season ends. I wonder how much, if at all, growth is dependent on a cool spring and summer providing water for growth as opposed to a wet winter, especially on the east slope of the Sierra.
This is why you measure degree days* .
Metabolism won’t start until a particular species gets sufficient heat for sufficient time (each spp is different, conifers usu lower than deciduous, which is why they are up at altitude & few deciduous woody spp up there**). The soils up there are generally coarser so water holding capacity is low, and any summer monsoonal moisture or northward-migrating MX hurricane moisture is appreciated by every spp. As long as a cool spring/summer is of sufficient temp to start metabolism but keep some snow around, there
willshould be a longer growth period for Pinus a..The issue is, however, whether precip is the signal indicating Pinus a. growth changes in the Whites & CA (& NV & CO for that matter) in the 20th C, not just lately. I don’t think this has been answered empirically.
Best,
D
* [aside: DDs are essential for efficient agriculture and CA has the CIMIS network for this purpose, and this network is useful for visualizing the extent of the UHIs of GCV cities, BTW]
.
** aspen are a fascinating exception in subalpine zone.
Re #37,
Dano
“Of course, knowing what we know now, we have no need to agonize over how best to go about doing a first paper, as that has already been done close to a decade ago.
Thus, we would build upon past knowledge and write our own paper, rather than thinking about the methodologies of something that had hardly been done before. ”
Thanks for your response to #36, but I wasn’t sure of the proper interpretation of your response (above). My interpretation is that you would use neither the full-bark or strip-bark Sheep Mountain Bristlecone tree ring series chronologies, and even though MBH98 used the strip-bark series, that temperature reconstruction was the first of it’s kind and that the temperature reconstructions have and should move ahead. Close?
Dano, I think it is very important to look at the calibration of a particular tree species ring width that is used in the temperature reconstructions. I wouldn’t attempt a recontruction without a calibration that included the relationship of ring width to temperature and quantification of the other growth factors (noise). Without the calibration of the proxies, it is impossible to get meaningful error bounds or get a good handle on the appropriate signal processing (PCA, RegEM, wavelets, etc) to apply.
Dano, you seem to be well read in the dendro literature, have you seen a paper were the authors demonstrate that tree rings of a particular species are linear (or least monotonicly nonlinear) in temperature. Thanks, Phil
43:
I think it is very important to look at the calibration of a particular tree species ring width that is used in the temperature reconstructions.
Excellent! Then my asking whether you offered to work for some dendro researchers was not in vain.
As to the rest of what I take to be your point, your questions make it appear as if you have an idea & perhaps you are looking at preparing a manuscript. The best way to go about this is either collect your own data or work with someone who has data. Let us know who accepts your manuscript & we’ll be glad to read about how your results pan out.
Best,
D
re 26: bender said:
“This thread died, strangely enough, when Lee came in. ”
You mean, it died when I pointed out an essential fact regarding treeline movements, that is too often not considered.
Phil B:
Dano has been asked this countless times on this blog, and I don’t think he has ever responded with a RELEVANT reference. There probably are not any such references, since the relationship between growth and temperature is an upside down U-shaped quadratic. There are many posts about this in various previous threads.
Dano,
Thanks for the reply.
I know soil temps generally signal growth. I guess my main question, and I know its not directly your field, is how much work has been done to demonstrate that temperature and precipitation combined at particular times of year are the main factors in tree ring width? And considering the intertwined nature of wet autumns/dry springs, cool/hot summers, and other various combos just exactly what they can tell for east side pines.
I know on the west side at medium elevations, I can usually point out wet and dry years within my experience, with only previous logging distorting the rings. I suspect the east side, high elevation/dry climate pines are possibly a lot more complex.
Phil B. See, especially, Bender’s info. here.
Re #46 & 48, Thanks jae, I know about Dano and had low expectations for a thoughtful response.
Phil, I’m stoked to dig into it, but am swamped. Let me get to it next time there is solid leisure time available.
Re #50, TCO, I think if you look carefully at figure 5 and read the associated text on page 89, you might change your mind.
47:
Thank you Barney.
how much work has been done to demonstrate that temperature and precipitation combined at particular times of year are the main factors in tree ring width?
I think it depends upon what ‘particular times of year’ and over what time scales you mean; every possible combination of season/wet/dry/spp, no. A recent paper about water relations and growth mechanisms of a couple of tree spp. sums up it’s particular findings wrt the literature this way:
Note the Rigling and Schweingruber refs in the paper for further investigation.
48-49:
I’m not sure why someone would use that link as evidence for the implied, unless one doesn’t understand the issue (in that particular case, young b’s cite dump in response to my pointing out his cite didn’t support his assertion doesn’t really reflect well on the support for the implication in 48).
And as far as 49 goes, if folks don’t understand the fact that I’m thoughtfully pointing out if folks think they’re on to something that may disagree with some empirical results, this means these folks should share their something with the field to improve our knowledge, then I can’t help anyone here. As willis says, it’s bozo simple: write it up and share.
Best,
D
It would appear difficult to disagree with these summaries that tend to equivocate with qualitative terms like “partially support”.
The statement, “This balance between a positive and a negative response to temperature is expected to reduce a clear temperature-related growth trend in tree rings of P. sylvestris at these sites”, makes sense to the conclusion relative to the earlier quoted statement if it is refererring to a site not at the treeline. If it is at the treeline then I would guess that it is simply showing an exception to the earlier statement and further equivocating.
I haven’t read the article so please tell me whether the site in question is at the treeline or not.
You want to conflate the issues of drought & pines in the West and acid rain and maples in the East? That’s your prerogative, young D. Just don’t piss on me when I am trying to help you with pointers to the literature. You want to ignore the more recent science about factors surrounding forest decline? That’s your prerogative too. It makes you look silly though, posting all your “linkies”, and then accusing me of a “cite dump”.
I know better now than to engage you in a debate on ideas and data. And now it appears you don’t want to read the modern literature either. Your loss.
Bender,
Just so long as you don’t conflate me with young D. 🙂
Do you have any links you could shoot my way regarding drought and pines out west? As a west sloper my knowledge is almost solely related to preciptation as the prime mover in tree rings. Not sure if the east side of the Sierra is different.
Also if I could refer back to a comment you made awhile back about BC; my experience with beetle infestations also points to a very high correlation with drought, whereas you had mentioned high summer temps in BC as causal for their outbreak. Any cites? Here in CA significant beetle outbreaks seem almost completely related to drought not temp.
Sorry,
That last line should have read “…almost completely related to winter drought not summer temp.”
“bender’s info”, linked to by jae in #49 is relevant to #46’s question because it shows why there may be very good reasons why positive responses to temperature are harder to come by than one might expect.
That entire post is admittedly speculative, and I readily acknowledge this [That is why the figure is labelled with “Ho:” right on it]. So #52s slight is hard to understand. #52 wants us to “write it up and share” – except when what’s written up and shared is posted on a blog.
Let me explain this once and once only, #52. Not everything that is true is worth the effort of publishing. Therefore, if you want truth you will have to look beyond the heavily filtered peer reviewed literature, and think for yourself.
Re #55
Nothing I’m wholly satisfied with. (I wouldn’t want to be accused of another “cite dump” when peer-reviewed literature is the only thing that #52 will accept.)
There are three mechanisms by which climate variability is feeding into beetle outbreak dynamics:
1-change in seasonality of life cyle
2-change in overwintering survival
3-change in tree stress response to drought
BC is a cold place: higher latitude, Rockies of very high elevation. Warming is having a strong impact there. CA in contrast is already warm. Drought is a factor in the North, just as in the South, but this is a relatively recent effect. Of all these mechanisms it’s winter-warming that’s really extended the beetle’s range northward, nearly to Alaska.
I could go on at length. (This is a complex system which I understand well.) Rather, I would prefer to point you to this recent monograph, especially chapter 2, and references therein. The issue has not been addressed yet in the “white” literature that #52 insists on, so you will have to make do with what’s in the “gray” literature.
After you’ve read that, I’d be happy to answer any other questions you might have.
53:
Thank you Ken.
If I may clarify, the paper I quoted looks at 2 sites that are not near treeline. The ref’d Rigling et al. was at a different site. The statement you quoted indicates different physiological responses to drought stress among species, which was one of the points of the paper (as they looked at 3 spp), and the particular paper’s findings partially support the literature (but the interannual spp differences was the point of publishing, to clarify the mechanistics behind ring growth). So, there is no exception to previous statement.
Does this help?
54:
If you could provide an example of where I’m doing purported conflation, that would be great, bender. Please contextualize wrt primary and secondary mortality factors & stressors. I anxiously await your reply.
As far as urination goes, you’ll recall* the issue being acid rain and mortality, and your assertion being temperature was the culprit not acid rain, yet the cite you liked so much in my link above didn’t test for Ca++; therefore, your assertion couldn’t stand with cites used. Nor did the other link you used in 9 to “prove” your point, as that link says what I said (multiple factors).
Your cite dump doesn’t help your case either, because as you well know Ca++ issues are a cofactor (as I explained previously). That is: the cavitation issues you raise are separable from Ca++ loss due to acidification) What you want to show (and didn’t in your cite dump, nor did the paper cited in 8) is, say, some papers that tested for what you say vs what I say (acid rain is stressor).
Best,
D
* http://www.climateaudit.org/?p=768#comment-39384 not sure why HTML not working…
I apologize to the CA readership for feeding Dano and I won’t let it happen again. In a weak moment, I thought I could get a relevant answer from Dano about using tree ring width/density for annual linear temperature proxies (sensors). As a person who has graduate engineering degrees and has done modelling, simulation, and parameter estimation for the last 35 years, I have a good grasp of the modeling and mathematical techniques that are being used in the temperature reconstructions. It is clear that Dano doesn’t and is only capable of condescending nonanswers.
Re #59 chemistry vs. climate as a cause of forest decline
As I say, it is not my assertion, but a bunch of other people’s. Disagree with it if you like, I’m not here to argue chemistry vs. climate as a cause of forest decline, as it has little to do with proxy reconstructions. The only reason for bringing it up is I thought people (including warmers like Bloom) might be interested to read some more recent papers that expressed a different emerging perspective on the issue. If you don’t want to read those papers, that’s fine. It looks like you’ve made up your mind on the issue, and I guess that should not be too surprising.
Bottom line: this is a tangent, not really relevant to this thread. If you want to pick it up and run with it, like you did with “Dano on Agriculture”, go right ahead. Ask Steve M for a separate “Dano on Acid Rain” thread. I’ll show you up on that one, until I’m eventually beaten down by your shear abundance of time to kill.
If the purpose of the Dano character is to collate literature on important topics, this character has a remarkable way of shutting down debate by dismissing people much more informed than himself.
60:
Come now. Your initial question was different, Phil, and not directly related to linear stuff (see 37 above); are you claiming all that text is a condescending nonanswer too?
Why didn’t you just ask the question you were trying to get at up front rather than contextualizing whatever you were trying to acheive with implications of inadequate methodology somewhere (after all, what site is this?)?
As you maybe well know, many factors are involved in physiological response that may result in nonlinear response in spp or populations (aspect, soil type, stand density), and perhaps you want better methodologies to raise the r^2s to some level that you want at the aggregated dataset level. Analysis is done at the stand level (it’s not ‘cherrypicking’ as each stand has different characteristics)*.
If you are implying you don’t like the current analysis methods and/or you feel they are inadequate, and you have some special knowledge that you now detail above, you should explain why you haven’t made the data analysis better.
Best,
D
* an aside, I did undergrad fieldwork (and laying on the floor after being outdrunk) with Russian botanists who are trained to work in one place and do data collection with rélevés in order to better understand site characteristics – completely opposite of how western botanists do work.
Re #60
On some issues Dano is objective enough that he can be carefully fed without harm. But on this one it appears Dano simply can’t stand losing an argument to Tim Ball? Can’t see where his argument might be weak. Hasn’t read the opposing literature. Is arguing from an entrenched position. Is relying on textbook theory instead of hard empirical fact. This is wildly inconsistent with the stated goal of “the Dano character”.
Go nuts, Dano. (Steve M, can you please divert the coming rant over to another thread – “Dano on Tree Biology”?)
My goodness, crosspost, it’s already coming! Quick, Steve M!!
RE: #58 – Depends on where in BC. Western BC is warmish (by global standards) and wet. Eastern is cold and drier. Probably 5 or 6 distinct climate types in BC.
Re #65
Yes, I know. I’m talking about 52+°N and the interior, i.e. the area currently under attck by beetles – which I’m sure was clear by context to the person asking a question about how BC compares to California. You don’t expect me to describe a region’s climate in all its infinite varibility do you, when the question had to do with continental-scle variability? With that level of detail we’d never get anywhere. Thanks (but no thanks) for the clarification. 🙂
61:
Disagree with it if you like, I’m not here to argue chemistry vs. climate as a cause of forest decline,
Well, you’re all over the place, thinking I’m conflating stuff and not understanding that your cite dump didn’t support the acid rain point I was making, so who knows what you’re arguing.
Perhaps your colossally informed self just got spun up about Dano somehow and think I’m arguing about something else.
Calm yourself down and reread my simple point that Ball’s assertion about acid rain is incorrect in the context of whatever it is you are trying to get at. You don’t even know what I’m debating to accuse me of shutting it down.
HTH,
D
Re #62 “linkie” on nonlinear response broken?
Dano, the issue was straightforwardness of your reply in #52. See what happens when you decorate with funny language and irrelevant, broken “linkies”? Most people don’t read the crap you write because it’s uninterpretible. Barney Frank asks questions straight up. Why don’t you answer him straight up? That’s why jae referred him to my stuff. Not because it’s gospel, but because it’s readable. Your problem is you’re committed to writing in silly baby talk that is extremely annoying. Change your tone to something more adult-like and people might actually read it.
Re #67
I’ve already told you what’s wrong with your argument on chemistry: the data more strongly support an alternative hypothesis centred on climate. Now when Steve creates a thread for you, you can tell me what’s wrong with the analyses presented in that literature. I’m not going to do your homework for you and read and interpret papers for you online. That’s the part you have to do yourself. You want everything served up to you with a silver spoon. Do some reading on your own for once.
I’ll reply in greater detail if and when Steve M creates a thread for “Dano on Tree Biology” or more precisely “Dano on Acid Rain”.
Phil B: This putative temperature/ring width/density correlation with temperature just amazes flabbergasts me. Here we have countless papers in prestigious journals purporting to show temperature reconstructions based on tree rings; and yet nobody seems to have demonstrated that it is feasible to do this. The basic science is missing!
I’m not “colosally informed”, and I don’t understand why you try to discredit me by characterizing me in this way. I simply know a slight bit more than you do on some specific topics that you happen to be interested in, and I know a heck of alot more than you when it comes to time-series analysis. But instead of being thankful for my contributions, they appear to upset you. For a guy who claims to have no agenda, this seems unusual.
No, you are very wrong. You just don’t realize that you are effectively shutting down debate by decreasing my interest level in engaging with you.
P.S. Your “linkie” to a graduate student’s chemistry experiment in one tiny area is a little bit “flakie” compared to the papers I’ve sent you that do a comprehensive job of modeling the observed decline phenomenon across the entire Eastern region. What do you think of them? Or have you still not read them?
68:
Why don’t you answer him straight up?
You’re trying too hard. Calm down. Maybe less coffee.
I gave a one sentence answer. The second sentence set up the long blockquote, which contextualized.
Broken linky. Apologies.
69:
Whatever.
But you can have your tout if you want.
72:
Whatever. I have here about eight of your cite dump. Specifically, your cite dump is problematic wrt the topic for the main reason (as I said before) as the dump isn’t comparative or controlling wrt Ca++.
One example: the review paper Frey, B.F., Lieffers, V.J., Hogg, E.H., and Landhausser, S.M. 2004 mention For example, point sources of pollution such as emissions from smelters or regional ground-level ozone concentrations may negatively affect leaf function or increase soil toxicity. [footnotes omitted]
The Robitaille, G., Boutin, R., and Lachance, D. 1995 don’t isolate Ca++ either to eliminate causation (merely test for deep freezing – of course this causes cavitation and no one said it didn’t).
Best,
D
Re #70, jae, another important distinction is the tree ring proxies are used as annual temperature proxies. The few papers that I have seen on correlating temperature to ring width/density, only calculate correlation values for summer temperatures, which certainly makes sense for high elevation tree species. So, correlating to annual temp would result in lower correlation cals. Noting that just because you have a sample correlation value doesn’t mean that the response is linear. Once you standardize your proxies by subtracting the sample mean and dividing by the sample std dev, then you have assumed that the proxy responds linearly to temperature.
All the temperature reconstruction methods (I have looked at) ultimately end up calculating NH or Global temperature by a linear sum of weighted proxies where the weights are calculated by the various methods (PCA, RegEm, LS, etc). So in order to get error bounds on your temperature reconstruction, you need proxy noise models so one can create the noise variance on your weights and to propagate the noise variance through to your temp reconstruction. Obtaining good noise models, determining nonlinearities in temperature, sorting out the autocorrelations, obtaining enough calibration data, and identifying other grow factors, to me seems very difficult or impossible for tree rings. In MBH98, using the calibration residual data for error bounds is an obvious mistake and makes the results look very good, but no one in the CS community called Mann on this mistake except for the outsider Steve M.
Jae, you forget to mention peer reviewed and blue ribbon NAS panels.
I am anxiously waiting to see a neural net temperature reconstruction.
74:
The few papers that I have seen on correlating temperature to ring width/density, only calculate correlation values for summer temperatures…So, correlating to annual temp would result in lower correlation cals.
Note that extratropical hardwoods enter dormancy in the winter & don’t make wood during dormancy.
Fig 3 here demonstrates the temp-ring relationship, along with references for the statistics you infer (pp 401-404). Certainly the field would appreciate additional insights.
Best,
D
Dano, which would you prefer: (1) a broad discussion about the causes of forest decline, where we talk about multiple factors which might be relevant to multiproxy reconstruction – or (2) a very narrow one focused very specifically on your pet calcium hypothesis? I am guessing readers of this blog would be more interested in (1) than (2). Ask Steve M for a new thread “Dano on Forest Decline” and we can take it up there.
Is this the point where you offer people again and again $100 to write a paper on tree responses calcium?
Re #74
Note that extratropical hardwoods enter dormancy in the winter & don’t make wood during dormancy.
The point being made here is that tree rings may be useful for reconstructing summer temps, but not annual temps. This is something which the field is well aware of, Phil B, but doesn’t always care to point out. Your observation is 100% correct. The problem here is Dano wants to spin it his own way, to insinuate you don’t know what you are talking about.
Thanks, as usual for the obfuscation and the dismissive tone, Dano. You sure are helpful.
76:
You are confusing me. Perhaps your hand-waving gesticulations and trying so hard to show whatever it is you are trying to show are what’s doing it.
Ask Steve yourself for a new thread on stand decline or Ca++ depletion as it’s not me leading the OT here; if it weren’t for you, we’d be on water relations in pines.
Nonetheless, it’s not my ‘pet hypothesis’, as it is not my empirical findings I’m citing; perhaps you haven’t gotten to this yet – have you asked your advisor for guidance in this area?
So, to be clear, not one byte of bandwidth expenditure you have effected refutes the findings** wrt my comment to Ball, and everyone knows about the multiple causations involved in forest decline. IOW, so what.
The decline issue is intertwined with acid rain as it is a subset, you know it, some of the refs you gave in your cite dump say it [e.g. Frey et al.2004], so give it a rest before I pull up more.
Best,
D
** and: http://www.blackwell-synergy.com/doi/full/10.1046/j.1526-0992.2001.01046.x?cookieSet=1 [html not working above]
Re #73:
I realize that. I read it the first time around. What I am saying is that IMO this “one sentence answer” of yours was not straight up. I won’t bother explaining how it’s practically uninterpretible etc. because I’m sure your response will be like #73’s “whatever”.
Whatever yourself.
77:
Thanks, as usual for the obfuscation and the dismissive tone, Dano. You sure are helpful.
You are trying too hard again (see 73).
The paper I linked to is explanatory rather than obfuscatory and gives helpful refs to expand knowlege, despite your little wish for it to be otherwise.
Best,
D
Re #78
“Give it a rest”. Good advice.
“… before I pull up more”
Am I suppposed to take this as a threat, and be afraid? If you’d like to have a few more references on top of the 8 I’ve already given you then I’d suggest you start asking nicely.
I never claimed that any of those papers examined calcium, so I’m not sure why you would expect them to. Maybe because of the way you expect things to be served to you on a silver platter? Whatever.
Parasite
Re #80
Save your linkies and cartoons for the new thread.
Hey, since you’re so damned needy of other people’s help in locating and interpreting articles, why don’t you start your own blog? I’m sure you’d get a ton of traffic with all that rich content.
#74, Phil B.:
I am surely showing my ignorance, but could you explain how this standardization assumes a linear relationship?
Ta, — Rafe
It’s the calibration (correlation) that assumes a linear relationship, not the standardization.
81:
I never claimed that any of those papers examined calcium, so I’m not sure why you would expect them to.
Yet you presumably offered them as rebuttal to my assertion about Ca++’s role in forest decline**. Why would you provide references that didn’t use Ca++ as part of a hypothesis?
Have you considered changing advisors? This one doesn’t seem to be serving you well wrt performing scientific inquiry.
Best,
D
** Why else waste so much bandwidth?
Dano, I think bender is an (hush) economist…
Re 86:
That’s where I think you’re being presumptuous. These studies, like 99.99% of biological studies, address one alternative hypothesis out of many. They don’t address the full range of hypotheses because that would be quite an expensive study. So, do they offer a complete analysis of the issue? No. Do they hint at the possible existence of compelling alternative? Yes.
Aside from collating a list of pros and cons of the various viewpoints, why don’t you tell us your view, Dano? Oh – right, I forgot – the Dano character doesn’t hold views; he merely collates the views of others. That’s why the Dano character is so DULL (speaking of wasted bandwidth).
87:
That would help explain aceanothus paper in a cite dump about eastern hardwood forests.
Best,
D
88:
Then you admit they don’t refute the Ca++ claims.
Thanks. That explains a ceanothus paper being in the cite dump.
And my view is that it’s clear acid rain can be a component of forest decline. And your cite dump is a decent overview of various components of forest decline, including acid rain.
Best,
D
The cite dump which has Dano so upset was offered in a spirit of helpfulness back when I did not know he was a troll not to be fed. For the record, it was not a “cite dump on eastern hardwoods”, but a quick list of some papers on xylem cavitation.
Apologies to CA readers for feeding this troll. I promise not to list for him the other two dozen papers I have on the subject which he could stand to read.
Re #90
Infer what you like. I’m not going to argue with you on the science because you don’t have an original thought in your head. You are a robotic collating algorithm that is programmed to spit out insults when people refuse to feed you what you want.
Come on, Dano, read the prelude to the “cite dump”
All I was saying is that the jury is still out on acid rain. There is a compelling alternative that I thought you might not be aware of. I was interested in hearing your take. (Of course that was before I knew about “the Dano character”.)
I didn’t say it couldn’t “be a component”. I admit that readily. But that’s not the issue. As with AGW the question is how much is attributable to factor A, B, C. I would put my money on cavitation, you acid rain. The fact is no one’s done the real hard work of doing a proper comparative analysis on what is not a black and white issue.
Hmmmm, No, I’d go with JMS’s #87 “economist” hypothesis. Far more likely that your opponent is a fool than you might have misinterpreted something he said. See how the meme spreads.
74, Phil: you say:
YES. I’ve long held that there is not much hope in using tree rings as thermometers. Too many confounding variables, no way to separate them out. I really don’t think we will see much of this kind of temperature proxy in the future.
91:
You yourself said the cite dump was for decline across the entire eastern region. Them’s your words, not mine.
Yer all over the place.
I claimed Ball was incorrect about acid rain’s effects. They are well known.
The two dozen links I have provided show this. Nothing you have hand-waved about changes this.
Acid rain contributes to forest decline.
Acid rain is among a host of abiotic factors – along with biotic factors – that contribute to forest decline. The jury is in.
Nothing bender has said here changes this fact, despite all the bandwidth expenditure to wish to show otherwise.
Have a nice weekend everyone,
D
As we have reached an impasse, here is my final statement. As the jury is still out on how the different factors associated with forest decline rank quantitatively, I would advise that anyone interested in acid rain in eastern hardwood forests should investigate papers that look at xylem cavitation due to spring thaw-freeze events, and decide for themselves which data are more convincing. No disrespect to Dano’s expert opinion, but the declines of sugar maple, yellow and white birch, and to a lesser degree, red spruce, can be traced back to wickedly anomalous spring temperatures occurring in the 1980s, 1930s, and 1950s respectively. This fairly recent science is a product of a deeper understanding of tree physiology and weather data modeling tools that were not available until recent decades.
Should Steve M care to create a separate thread for this topic, I’d be happy to expound. However it is only tangentially related to the issue of proxy reconstruction, so I don’t expect that will happen. Bottom line: trees are sensitive to all kinds of weather anomalies. They can die during severe droughts. Speculation: there could have been waves of dieback in and around the MWP.
#58,
Thanks for that link bender. The little buggers are ubiquitous in CA, but unless there is a drought and the trees are stressed they just pitch them out.
I wonder how much of what is occurring in BC is global climate and how much is just regional variation of the storm track? From the early seventies until the early ninties my area of CA had quite variable precip cycling from record setting drought in the mid seventies to record setting precip in the early eighties. The last twelve to fifteen years have been pretty uniformly normal to wet. When CA is wet BC is usually dry, and vice versa.
#73
You’re trying too hard. Calm down. Maybe less coffee.
Dano, you have useful info at times, but your rhetoric prevents me from seeing you as anything other than a guy in a Buster Brown suit standing next to a broken window pointing at your neighbor, with a recently fired sling shot in your back pocket.
Re #84 Rafe, let me add to my sentence “Once you standardize your proxies by subtracting the sample mean and dividing by the sample std dev, then you have assumed that the proxy responds linearly to temperature” (when used to perform sample correlation calculations). If you have signal that is a nonlinear function of the temperature than you would perform the inverse function on the signal before you standardized. Of course, assuming that there isn’t too much noise and the nonlinear function is monotonic).
Re 99, Phil B., thank you for your posting. However, I don’t think you’ve thought this problem all the way through regarding trees. You say:
The difficulty is that the tree’s response to temperature is an inverted “u” shape, and thus the function is definitely not monotonic. As a result, there is no way even in theory by which we can retrieve the signal “¢’¬? a narrow tree ring could mean a year that is too warm or too cold, and we have no possible method to distinguish between them based on ring width alone.
w.
The problem with that hypothesis, Barney, is that we are seeing similar types of responses across the continent. I want to preface what I say next by pointing out that the evidence is circumstantial, the analyses are shaky or non-existent, the observational data span less than a century, and so the jury is is still out on all of this. But look at hemlock wooly adelgid in the NE US, or hemlock looper in northern Quebec, or spruce beetle in Alaska, or forest tent caterpillar in the Northwest Territories of Canada. There are many forest insect showing up at high latitudes where they’ve never been seen before, over roughly a century of observation. Insect ranges appear to be changing, just as bird ranges are changing. Maybe this is just a post-LIA rebound, maybe not. But the responses are convincing enough at first glance that they are worth a serious second look.
No one is quite sure why MPB in BC are so aggressive that they are rapidly overcoming the pine tree’s pitch-based defenses. It is true that the degree of “aggression” is unusual compared to the SW US. Maybe this is because the beetles are different (?), or because the trees have not had the selection pressure required to evolve an adequate defense (?). No one knows. But there is no doubt that these beetles are chewing up nearly every pine tree in sight, drought or not (and regardless of tree size, interestingly enough).
One thing to keep in mind. The amount of pine-forested area in northern BC is stunningly huge, millions upon millions of acres … as far as the eye can see. A sight few in California (Sierra clubbers excluded) can possibly imagine. This provides for a massive amount of “beetle pressure” that can be exerted at any time and place of their choosing through the process of pheromone-based aggregation and mass-attack. This keeps the outbreak ripping right along, even if it takes 2000+ individual attacks to drain a tree’s entire pitch reserve.
I have my doubts about the A in AGW; but I do not have any doubt that GW is generating ecosystem-wide responses among the various temperature-dependent biota, including trees and insects.
RE: #96 – “Acid rain contributes to forest decline.”
Uniformly proven for all soil types, all biomes and all climate types? Show proof (agenda driven environmental policy NGO sites and left wing media don’t count, by proof, I mean peer reviewed scientific lit on a university or government server).
Re #100
Exactly, Willis. If you ignore the nonlinearity, it’s a moot point. As soon as you admit the possibility of nonlinearity, you have to ask “how nonlinear?”. Linear approximations can work to some degree if the response is not too nonlinear. But if it is fully quadratic, then you have a serious problem.
Anyone doubting the influence of drought on tree growth can look at the recent data coming from Europe on continental-scale reductions in leaf area and rates of photosynthesis. Observations in westcentral North America indicate the very same thing. CO2 is not being sequestered at the rate one would expect in the absence of drought.
Re #102
Dano is concerned about eastern hardwoods, especially sugar maple, so I wouldn’t bother trying to distort his argument by bringing other regions and species into play.
Any proof has to consider the real problem of scaling from the lab to the field. The experimental work, in my mind, is unequivocal: you pour acid on trees and they wilt, the crowns get thin, they die. So I think elements of his argument have validity. The problem is that this style of lab (or mesocosm) experimentation doesn’t tell you much about landscape-scale responses in the field. The question is whether acid rain delivered in realistic doses could account for the observed scale and severity of decline during specific episodes in specific systems, or whether other explanations are more consistent with the observed data. I put my money on the latter. Where acid rain is a real problem is in northern lakes. But that’s a different, unrelated story.
Re #100, Willis, I agree. Notice I used the word “signal” rather than tree ring width/density, and had my caveat of monotonic nonlinearity. I think you explained nicely why the function has to be monotonic to get a single inverse solution.
Re #101
Forgot to mention the fungi. They, not the beetles, are what shut down the tree’s defense response and actually kill the tree. And they are known to vary tremendously across the range of susceptibles hosts. Even within lodegepole pine there are seven recognized species, plus several other varieties that may or may not be separate species, depending on the taxonomist you talk to. It is quite possible BC MPB carry a more virulent fungus that works effectively even in well-hydrated trees.
Re 105, indeed, Phil, I was agreeing with you. What the tree ring folks seem to forget is the “monotonic” requirement. If it’s just a monotonic curve, a linear approximation still works. But once we get into many-to-one mappings, all bets are off.
The other thing that gets forgotten is that this response (upside-down quadratic) is not just in the long term “¢’¬? it occurs on a daily basis as well. As the day warms, a tree can grow in the morning, and then stop growing when it gets too hot in the afternoon. Even though this may not drive the entire annual record into a non-monotonic response, it still distorts the temperature/ring width response in a way that cannot be removed by subsequent analysis.
w.
Re #107
Yes, integration across larger time scales (hourly-annual) may effectively linearize what is really a fundamentally nonlinear response. If you want to see just how nonlinear the hourly response is to temperature, like Willis suggests, turn up the heat in an hourly monitoring experiment.
How much linearization occurs when you integrate across the whole growing season? That is a good question. In drought years, you are likely past the peak of the parabola, such that the linear models start breaking down.
Were there waves of dieback during the MWP that selected against the most negative responders? Maybe. Major waves of dieback can be inferred from the pollen record. One example I’m familiar with is eastern hemlock 4000-5000 BP. But there are others.
What is needed is a specialist in BCP ecology to get involved in the discussion.
Wish there were a Judith Curry of the bristlecone world.
Re #109: What, so he or she could be inflicted with demands to reconstruct the entirety of climate science from first principles? As Judy said, she came here with a climate scientist’s priors. How does it make sense to spend time defending those priors to people who aren’t really listening? I suspect she found equally unamusing the multiple demands that she justify her characterization of the evolution of Pat Michaels’ views. Note that both she and Pat have been active in the climate field since the early ’80s, so unlike any of the rest of us she has direct memories of what he was saying back then.
Re #110
I hope I wasn’t disrespectful toward her. I thought she conducted herself admirably, and I think her presence was very much appreciated by all, myself included. A bristlecone ecologist visiting the blog might get a rougher ride, but I would do my best to ecourage people to keep it civil. All we want are some answers to some very simple questions.
Speaking of “priors”, which is climatology codespeak for scientific bias … now that you’ve got some free time this weekend, would you care to lecture me on Bayes? No tweaking or bullying. I promise. 😉
Re 110, I am very grateful that Judith Bloom comes here and contributes, and I appreciate her wish not to cover agreed-upon ground.
However, far too many of the “priors” of climate science are in need of replication and critical examination. Michael Mann has “priors”, as does Phil Jones … but they fall apart under examination. While there are parts of climate science that do not need “reconstruction”, there are also large areas that do.
Certainly, one of those areas is the idea that trees make good thermometers. This is one of the “priors” of the paleodendrochronologists, but so what? Doesn’t make it true. So yes, I do think it needs to be examined from first principles “¢’¬? I have not seen an explanation anywhere of how to deal with the upside-down “U” shaped temperature response. I haven’t seen an explanation of why trees should respond to global temperature changes, but not to local temperature changes. I have never seen a coherent justification for choosing some trees as good thermometers, and throwing away the “bad” ones. I have been appalled at the actions, morals, and methods of the leading practicioners in the field, and if they have “priors”, they should bring them out for examination … but instead, they just put them in the CENSORED file.
w.
PS – your claim that someone who was active in climate in the ’80s has direct memories of what was said, and that these memories are preferable to the written record of congressional testimony, strikes me as bizarre … memory is a very unfaithful servant.
Judith Bloom?!
But seriously … a discussion does need to happen about “priors” and what warmers think Bayes means.
#110 — “How does it make sense to spend time defending those priors to people who aren’t really listening? (bolding added)”
One is bemused by the disconnect.
Re #114
Either he’s incorrectly assuming that nobody here is listening, or he is deliberately trying to paint those who are listening as though they’re not listening. Frankly, I think people here are generally pretty patient listeners.
On “defending those priors” – it’s preciesly those priors that are the problem. That, and the possibility (however strong) that there aren’t any independent out-of-sample data coming in to provide the opportunity required to reverse those priors. It’s Bayes. It’s bozo simple.
Listening for my lecture on Bayes. Listening …
112:
Does ‘prior’ in this context mean ‘description of what is known about a variable in the absence of some evidence’? If yes, then I agree..
This situation is far from ideal, but the alternative, using dataafter 1960 and thus incorporating non-temperature- related bias when fitting regression equations as a function of density variability, would invariability produce earlier estimates of past temperature that, to some extent, too warm. (Briffa)
A non-robust analysis of the un-trended series leads to highly questionable inferences that the secular trend is not significant relative to red noise.. (Mann)
..past too warm.. ..highly questionable .. that the trend is not significant…
102:
Show proof [that acid rain contributes to forest decline -D] (agenda driven environmental policy NGO sites and left wing media don’t count &c.)
I thought this was purportedly a science discussion – you want ‘proof’ in a purported science discussion, eh? How odd.
Nonetheless, you must have overlooked the fact that, above, I have provided no links to any such thing as you disparage in italics and it’s odd why you think I did or do. I have, however, already done as you wish and provided at least a dozen links in this thread you should read that provide context (as I stated previously, bender’s cite dump has a couple papers, BTW, that [despite his big ol’ bandwidth-eating wish to paint it otherwise], as there are multiple papers in there that cross biomes &c).
If you want a lit review on this phenomenon, start from this almost two-decade old paper here or just for Canada (newer) enjoy the refs here [in addition to a very new that I included above], or maybe you don’t like CDN so here (or do the easy research yourself to find your own paper you like, as there are plenty).
HTH,
D
bump