Ou (J Clim 2001), " Possible Bounds on the Earth’s Surface Temperature" is an attempt to explain why a climate “not unlike the present-day one has prevailed on the earth since its early history when the sun was considerably dimmer”, a question that Lee was musing about and, IMHO, an interesting question. The tricky thing is how you get both ice age and hothouse periods not only without careening out of control, but going to the other side, again without careening out of control. Ou also has a more recent article on the same topic that I’ve noticed but haven’t read. I’m not vouching for anything here other than I found the article interesting and the question stimulating. Most climate models have very strong positive feedbacks and intuitively one feels that if they were applied to the history of the Earth, they would have projected the Earth turning into either Venus hothouse or Mars icehouse long ago. (I don’t "know" that they would do this, it’s just an impression.)
Ou poses the following question:
How the earth maintains this climate is a matter of speculation, and many possible scenarios have been suggested. The most widely circulated among them is a much higher concentration of carbon dioxide (CO2) in the atmosphere, which has been attributed to external factors, though poorly constrained by observational data. Also suggested but less explored is a reduced cloud albedo that may offset the solar effect. Since there are no proxy data for the cloud cover, which in addition is an internal variable, this possibility may be assessed only through a model that has included interactive cloud covers. Conversely, without a physical closure that contains variable clouds – which directly affect the energy flow into the system- one simply does not have an explanation of the earth’s temperature. It is the desire to formulate such a model to try to address this faint young sun” paradox that motivates the current study.
Ou noted that GCMs are not helpful for studying the effect of low clouds since, even if they have variable cloud formation, Ou says that the relevant parameters, such as threshold relative humidity for cloud formation are “tuned” by GCMs to yield the present observed cloud covers and therefore are of little use for modeling "fundamental changes". He noted that there have been few attempts to determine the earth’s temperature from first principles, mentioning Paltridge’s maximum entropy work as an exception. In this connection, he noted that Paltridge justified maximizing a thermodynamic quantity on the basis that the underlying system contained more degrees of freedom than could be practically constrained and followed this sort of strategy, in Ou’s case, by maximizing turbulent wind at the surface, said to correlate strongly to the kinetic energy dissipation (i.e. internal entropy formation) as follows:
Similarly, since a maximization of the internal entropy production implies a minimized entropy exchange with the surroundings (there could be no change of entropy in the steady state), Paltridge (1978) used the latter to determine the latitudinal distribution of surface temperature and cloud cover and met with considerable success, further underscoring the thermodynamic nature of the system. Since such extremization principles, if operative, are properties of a dissipative thermodynamic system, they should be equally applicable to vertical as to latitudinal models.In the view of the current theory, the cloud covers merely adjust to whatever is required by global balances, and their regulatory effects enter mainly through the internal degrees of freedom they endow upon the system. In other words, rather than a low cloud that cools the surface, it is the surface temperature- somewhat independently constrained by water properties- that determines the cloud covers through global heat balance.
Ou has separate degrees of freedom for high clouds (e.g. cirrus, storm tracks which are characterized as SW transparent and LW black) and for low clouds (stratus etc., characterized as black SW and LW). Here’s a diagram of the components in his system:
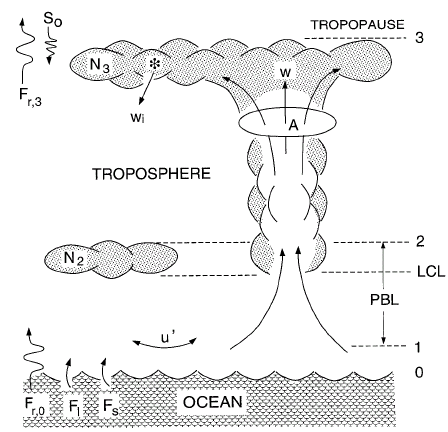
Original Caption: The surface, the top of the air-sea interfacial layer, the top of the low clouds, and the tropopause. Because of the shallowness of the low clouds, no distinction in height is made between level 2 and the LCL. Variables with a numerical subscript indicate global means at the respective level, which may differ from their values in the updrafts. The symbols A, N2, N3 indicate fractional areas occupied by the deep updrafts, the low, and high clouds, respectively; u9 is the turbulent wind velocity at level 1; and w and wi are the vertical velocities of the deep updrafts and the settling ice (both taken as positive), respectively.
Adding some piquancy to the low cloud issue is that these seem to be somewhat problematic in GCMs. It was my impression, although I hasten to say that it is merely an impression, that IPCC TAR GCMs tended to under-formation of stratiform clouds (and this was a systemic bias in the ensemble in the sense that none over-formed stratiform clouds.) I also noticed that, in the climateprediction.net model, one of the frequent causes of "bad runs" is the "cold equator problem" and I recall vaguely that this was connected to clouds and this might be connected (or might not be).
Ou’s most striking conclusion from his model is that a +-50% variation in solar constant results in only a 10K difference in surface temperature. (A 4 wm-2 variation, the standard 2xCO2 forcing, would proportionally yield a 0.11K change in surface temperature.) I don’t have strong views on this. If I’ve said something incorrect here, as I could easily have, it won’t disprove observations that I’ve made about Mann’s proxy methodologies, although I’m sure that some of the lurking trolls will try to use such an eventuality as fuel. In posting this, I’m simply trying to be constructive in response to an interest shown by a reader.
Reference: Ou (2001) Possible Bounds on the Earth’s Surface TemperatureJ Clim 2001, 2976) http://www.earthinstitute.columbia.edu/generalInfo/CEImembers/about/Ou_JournalClimate.pdf


100 Comments
I also recommend an article by Ozawa Ohmura in this context. Anybody wishing to demonstrate their superior knowledge of entropy in a practical situation may do so on this thread. However, any posts discussing Essex and McKitrick or directly related issues will be treated as spam, as will any tiresome continuation of the argument as to whether Tim Lambert or John A knows less about thermodynamics. Anybody with such superiority in knowledge should be able to better deploy it by helping the rest of us better understand Ou and similar articles.
Thanks, Steve; I’ll read it over the next week (I’m off to a party soon).
I can track cites down myself later (and I’ll post what I find), but if you happen to know of and already have cites to any published critiques or extensions of this to read in tandem, that might be useful here as well.
-Lee
The faint young Sun is one of the great questions in astronomy. How could the Earth’s temperature been nearly constant over the history of life with a sun known to have changed it’s brightness so much? Thanks for the article. We really need to understand clouds to understand climate. I think this is a hard problem.
Thanks for the review, Steve.
My “civilian gut feel” is that understanding changes in low cloud cover are a key to understanding whether CO2-driven warming will prove to be a runaway catastrophe or just a 21’st century curiosity. It seems to me that satellites should be able to determine both atmospheric temperature and low cloud cover over the last thirty years, and see if there is a correlation over the short term.
Ou (2001) is a little thin on citations other than this paper and the latter’s further citations here. Ou has a special home page for this topic here, but I couldn’t find a reference to a more recent relevant article (other than the Nature review linked on his home page).
I know there has been quite a bit of work done on “snowball earth,” but if I recall correctly the mechanism for getting out of that is thought to have been CO2 build-up from vulcanism rather than clouds. The PETM is perhaps more relevant for Ou’s ideas.
At a first quick glance at both Ou’s paper and the Ozawa and Ohmura one Steve M. linked, it seems like they should have something to do with each other, and yet they have no cross-citations that I could locate.
I’m out of time for tonight.
Re #5
The Paleocene Eocene Thermal Maximum (PETM) is probably the key to find out if the Earth was following the same climate and thermodynamic laws or if dramatically illogical thermal runaway could occur and could occur again.
The recent three publications in Nature* about an subtropical Arctic Ocean should cast doubt about our combined perception of the PETM, which includes oceanic current reversal, massive clathrate destabilization, large scale volcanism in the North Atlantic, meteor/bolide impact, violent sea level fluctuations and thriving small mammal populations spreading quickly around about the partially connected N America, Europe and Asia continent Laurasia.
But the story starts already in the Paleocene (65,5 – 55 Mya), which places Antarctica and the Arctic basin tectonically already close to the poles. Yet those areas produce a abundance of evidence of moderate to warm climates in the same period. How can you get poles warm, looking at thermal processes: radiation, convection, conduction without boiling the equator. Or perhaps we must accept that the combined specialties of the geologic pasts do not add up, producing a physically impossible world.
If we are to judge which one would be in error, plate tectonics stands a fair change, not the principle but working out the details. When sub-continents like India have swerved over the globe with great speeds, it is perceivable that tropical Arctic’s and warm Antarctica’s have been situated at other places physically than we assume currently.
But this is a reflection for the Paleocene. The PETM is likely to be a completely different story if logic was to prevail.
This is the abstract of our work-progress-paper paper: “Understanding the Paleocene-Eocene Thermal Maximum.
*ref:
Brinkhuis, H. et al. 2006 Episodic fresh surface waters in the Eocene Arctic Ocean. Nature Vol 441, 1 June 2006, pp 606-609
Moran K et al, 2006 The Cenozoic palaeoenvironment of the Arctic Ocean Nature Vol 441, 1 June 2006 pp 601-605
Sluijs A, et al 2006 Subtropical Arctic Ocean temperatures during the Palaeocene/Eocene thermal maximum nature Vol 441, 1 June 2006, pp 610 — 613
The “snowball earth” issue meantioned by Steve Bloom is of special interest for biologists in many ways. One thing is that no land life is known from these or earlier times. There are two (may be more) explanations for that. One is that the oxygen content still may have been quite low. The other is that formation of a protective ozon layer was still not completed or strong enough. I have read somewhere that ozon is produced already at quite low O2 levels.
Steve Bloom, do you have some good references on this issue? I would also be interested in some recent articles about snow ball advances. I know there are quite many articles available, but I am not able to judge which are “good” or “bad”. Many theories are quite quickly corrected although the original article still is mostly cited. I am thinking of what is thought to be fact about the extent of the snow ball independently of how it is explained.
I would have thought that the hotter it becomes, the more water vapour is releases into the earths atmosphere, thus forming a barrier to the suns energy through cloud formation.
Conversely the cooler it becomes, the more water vapour is liquified, or frozen, and taken out of the atmosphere, thus allowing more of the suns energy to reach the surface through reduced cloud cover.
A self regulating mechanism.
Of course, the reflective properties of cloud cover would have to exceed the retentive properties. I’m sure someone will know the answer to that.
there was a session at AGU December on this sort of topic. Other authors in the field include Ralph Lorenz, Toni Pujol, Axel Kleidon plus various combinations. It’s not easy going but it’s interesting stuff.
Well, progressive irreversible sequestration of carbon could explain, quite simplistically, approx. constant temperature with increasing insolation. Recent glaciation might suggest that we were(are) near a tipping point about the carbon cycle, and carbon sequestration.
===================================================
MarkR, it still seems to me that low cloud cover has a large cooling effect on the atmosphere above it.
By keeping sunlight from reaching the earth’s surface, the cloud cover reduces convection (transport of heat from the sunlit surface into the mid atmosphere). The reduced convection keeps the mid atmosphere cooler than it would otherwise be.
At ground level we see a constant temperature, perhaps misleading us to assume that cloud cover is “neutral” with regards to heating the atmosphere.
#7. Your question about “snowball earth” is something that I’ve wondered about from time to time. I get the impression that much/most of the evidence for a Neoproterozoic snowball earth is how diamictite sediments are formed. In a very quick browse, E Arnaud has analyzed a number of “neoglacial” diamictites and could not state that they were of glacial origin as opposed to turbidite or some other form of sediment slump not connected with glacial origin. Some biota seem to be identical throughout the process. Personally, I’d be inclined to rely on biological evidence and, if the only evidence is forms of sedimentation, I’d be inclined to view the idea as still being a speculative hypothesis. I’ve got a friend who’s very knowledgeable about Proterozoic geology and could probably get a more informed view.
I think I’ve never heard so loud,
The quiet message of a cloud.
===================
Ou se trouve la verite
==============
“Heat Vent” In Pacific Cloud Cover Could Diminish Greenhouse Warming
“The authors propose that higher ocean surface temperatures directly cause the decline in cirrus clouds by changing the dynamics of cloud formation and rainfall. Cirrus clouds — high-altitude clouds of ice crystals — typically form as a byproduct of the life cycle of cumulus towers created by rising updrafts of heated, moist air. As these cumulus convective clouds grow taller, cloud water droplets collide and combine into raindrops and fall out of the cloud or continue to rise until they freeze into ice crystals and form cirrus clouds.
“With warmer sea surface temperatures beneath the cloud, the coalescence process that produces precipitation becomes more efficient,” explains Lindzen. “More of the cloud droplets form raindrops and fewer are left in the cloud to form ice crystals. As a result, the area of cirrus cloud is reduced.”
Clouds play a critical and complicated role in regulating the temperature of the Earth. Thick, bright, watery clouds like cumulus shield the atmosphere from incoming solar radiation by reflecting much of it back into space. Thin, icy cirrus clouds are poor sunshields but very efficient insulators that trap energy rising from the Earth’s warmed surface. A decrease in cirrus cloud area would have a cooling effect by allowing more heat energy, or infrared radiation, to leave the planet.
If this “iris effect” is found to be a general process active in tropical oceans around the world, the Earth may be much less sensitive to the warming effects of such influences as rising greenhouse gas concentrations in the atmosphere. The researchers estimate that this effect could cut by two-thirds the projected increase in global temperatures initiated by a doubling of carbon dioxide in the atmosphere.”
The American Meteorological Society is the nation’s leading professional society for scientists in the atmospheric, oceanic, and related sciences.
I didn’t quite get how ‘the coalescence process…becomes more efficient’ at warmer sea surface temperature. But I love the image of a winking Gaia. And that article seems co-operative with Ou’s, at least to my limited understanding.
====================================
Another topic I struggle to understand is the impact of dewpoint on radiative cooling. It seems to me that dewpoint and its various effects put a big brake on nighttime radiative cooling, much greater than the braking caused by higher CO2.
Here in the subtropics, our nighttime temperature drops to several degrees above the dewpoint but then the decline stops as dew, ground fog and low clouds put the brakes on radiation.
Higher CO2 in the atmosphere would certainly slow the outbound longwave radiation. However, the net effect of higher CO2 on nighttime cooling here in the subtropics would be that the dewpoint “braking” of radiative cooling would kick in at, say, 2AM instead of 1AM. Perhaps that means less dew or thinner morning fog, but those are asymetrical conditions with regards to the morning solar heating (dew gets absorbed into leaves so there is no counterbalancing vaporization; subtropical fog is thin and easily penetrated and destroyed by the morning sun).
The effects are similar elsewhere, in my observation. In Siberia, the temperature doesn’t fall to minus 150C during the winter darkness but instead drops to near the dewpoint and hangs there. It seems like the effect of increased CO2, while it slows the outbound radiation, almost falls into a “so what” category, as the dew point effects dominate and are what limit radiative cooling.
If someone knows of an article that examines the impact of dew point on radiative cooling, please let me know. My goal is to learn. Thanks!
Re #17: That’s what Google Scholar is for: http://scholar.google.com/ . That said, it may be that what you’re looking for here is textbook material that can be a little hard to find with GS since there are no recent papers on it.
Re #7: Steve M.’s reply more or less encapsulates my understanding; i.e., “snowball earth” remain speculative. In any case it was a bit confusing for me to have even brought it up since the proposed mechanism by which the earth would have warmed again has nothing to do with Ou’s paper.
Re #15: MarkR, may I suggest that before posting something like that you do a Google Scholar search to make sure what you’re citing is up to date? Note that the linked article is over five years old. If you look at all the relevant material, you’ll find that Lindzen is now pretty much out there on his own with the “iris.” Theory aside, if the iris is correct we should already be seeing a drying of the upper troposphere, and observations seem to be showing the opposite. Since we’re also talking about the PETM in this thread, another major criticism of the iris is that if the climate is really self-regulating to that extent major excursions such as the PETM should look to be much more damped. As well, if it does turn out to be the case that Huybers has nailed the relationship between Milankovitch cycles and the present glaciations, the (apparent) fact that the glaciations are being driven by such subtle forcings would tend to crowd out the possibility of a meaningful “iris.”
Re#18 I did as you suggested and there were no more recent or relevent articles on Google Scholar that I could find.
If you think the authors were wrong, please say why or post a link.
If you think the measurements they did were wrong:
“The study compares detailed daily observations of cloud cover from Japan’s GMS-5 Geostationary Meteorological Satellite with sea surface temperature data from the U. S. National Weather Service’s National Centers for Environmental Prediction over a 20-month period (January 1998 to August 1999). The researchers found that cumulus cloud towers produced less cirrus clouds when they moved over warmer ocean regions. For each degree Celsius rise in ocean surface temperature, the ratio of cirrus cloud area to cumulus cloud area over the ocean dropped 17-27 percent. The observed range of surface temperatures beneath the clouds varied by 6.3 degrees Fahrenheit (3.5 degees C).”
Please post a link.
You say, “Theory aside, if the iris is correct we should already be seeing a drying of the upper troposphere, and observations seem to be showing the opposite.”
They actually used an instrumental measure of the sea temperature, and actual satellite data to measure the cloud cover. If you have access to any better and more recent relevent instrumental records, or satellite data, please post them. “Seem to be showing the opposite” is not really enough.
PS I looked on Lindzen’s Publications, see #207-#210 for more recent papers.
Also here“And then there are the peculiar standards in place in scientific journals for articles submitted by those who raise questions about accepted climate wisdom. At Science and Nature, such papers are commonly refused without review as being without interest. However, even when such papers are published, standards shift. When I, with some colleagues at NASA, attempted to determine how clouds behave under varying temperatures, we discovered what we called an “Iris Effect,” wherein upper-level cirrus clouds contracted with increased temperature, providing a very strong negative climate feedback sufficient to greatly reduce the response to increasing CO2. Normally, criticism of papers appears in the form of letters to the journal to which the original authors can respond immediately. However, in this case (and others) a flurry of hastily prepared papers appeared, claiming errors in our study, with our responses delayed months and longer. The delay permitted our paper to be commonly referred to as “discredited.”
Re #20: I’m glad you were able to find Lindzen’s more recent stuff. Now you need to look at the papers from others. Of course it goes without saying that Lindzen still thinks he’s right. He’s had an awfully long time to convince others, and I noted the specific reasons why. At some point it becomes more and more difficult to get discredited ideas published, and that’s what’s going on here. I’ve read all the papers, BTW. Once you have, I’d be happy to discuss any of the specifics with you.
I want to emphasize that if you look at the publication history of the “iris” you’ll see that it received prominent publication and considerable positive attention when it first came out. That wouldn’t have happened if there was some vast conspiracy to squelch such results.
In any case this reply to Lindzen seems to be the latest specific refutation. You can find the original paper here, but I’m not sure about Lindzen’s comment (although I recall finding a public access version somewhere). Also see this to get an idea of the broader context of this branch of climate science.
…the specific reasons why his ideas haven’t gotten much traction.
There’s also the purely theoretical aspect of the debate, but the nuances of that are over my head.
#17. This sounds like simple thermodynamics. As the water vapor in the air cools down and the air becomes saturated the water vapor approaches a phase transition. Any further cooling requires a transition from water vapor to liquid water. The vapor has to give up a lot of energy, latent heat, to make this transition. If memory serves, it takes about 70 times as much energy per unit mass for the vapor to water transition as it does for the vapor to cool by 1K when it is above the transition. The net result is that it takes 70 times as long to make the transition as it does to cool down that last 1K.
If you want to do the numbers look up the specific heat of water vapor at room temperature and compare it to the specific latent heat of the water vapor-liquid water transition at the same temperature.
Well, Steve B, lets take you up on the request to discuss the responses to Lindzen’s Iris theory. Here’s the first point in the paper you call the “latest specific refutation”:
Now think about what this point means. It’s indicating that the amount of heat being sent north and south from the tropics is 100 times as much as the amount that it’s been claimed that the earth’s heat engine is out of balance. Further, if you’ve ever looked at the Ocean surface temperature anomalies over time you know they vary regionally by similar amounts. So shouldn’t this make us a bit suspicious of the claimed .65 W/m2 figure in the first place?
Years ago I argued that if we trapped more solar energy on earth to do work it would heat the earth. I still haven’t figured out if that is right.
=======================================
Kim,
Assuming you actually trapped more solar energy than is presently captured by natural processes it would heat the earth, but if you just mean that you replace some of the natural capture with a capture which uses some of the energy to do work before it becomes heat then no, there is no additional heating of the earth. In either case, however, the amount of heat released will be small compared to the total solar energy coming from the sun, unless the work done is vastly more than we humans presently use.
Re: #1
Steve M,
Don’t you think it’s a bit unfair to, in one breath state that anyone wishing to demonstrate superior knowledge of entropy, do so on this thread and then without pause exclude Tim Lambert from that category?
One of his main beefs with you (apart from supposed systematic d-l-t-ng of p-s-ts) seems to have been your refusal to host a post discussing entropy. Indeed, you may not think that Tim is an entropy expert, but he has been champing at the bit to discuss the issue for ages and you’ve always rebuffed him.
I know you don’t want this post to descend into another slug-fest, but I assume that you know your comment will simply feed Tim’s paranoia?
He believes he has a particular knowledge about entropy, so if you choose to host a post which opens the door to the subject, you should invite him to display his expertise for all to see. I, for one, would be interested to see how he acquits himself on the issue in a forum removed from his own.
Should he choose not to take up the challenge outside his own walls…well, that would also be interesting.
Re#21
I have looked at the papers, and I think it is fair to say that the matter is still disputed by the parties.
I certainly don’t know for sure which view is correct, but I am surprised that a large number of climate models were produced, and held to be robust, which presumably did not take into account either theory, since they had not then been published.
My concern is that expensive policy decisions have been encouraged based on very incomplete knowledge.
It seems that only uncertain theories that point in one direction are included in the range of modelling, and from these only the most extreme possible outcomes are publicised.
#28. I didn’t exclude the possiblity of Tim being knowledgeable about entropy. I presently have no opinion whatever on his competence in this area. As you said, he seems to have been champing away at being able to demonstrate his superior knowledge. Look carefully at my wording. I simply wanted him to demonstrate any such superior knowledge in the context of this particular question rather than continuing an ancient catfight with John A (discussion of which will be deleted). I myself claim no expertise in this area and, if Tim can use any superior gifts and knowledge to assist the rest of us in understanding the strengths and weaknesses of Ou’s paper, I’d welcome it.
#26:
Kim
The concern about creating artifical energy imbalance was discussed in the 1970s following a proposal to put mirrors in space to direct sunlight onto collectors at the surface. The idea was to create heat and therby energy. It was argued this would create an energy imbalance by bringing in additional solar energy and that without an equal increase in outgoing longwave energy would cause warming. As I recall the conclusion was similar to that stated by Dave (#27). There was also a proposal to bring sunlight into northern latitude cities in winter with similar synchronous orbit mirrors.
The vertical heatflow appears to be one of the significant keys to the system. I view it as nature’s ad hoc tower heat sinks, that get applied to hot spots. Talk about a negative feedback.
The other thing I’ve often wondered is about what I would term quantum design. Are there set states for a planet’s climate, owing to its structure, orbit and initial conditions? For example, was Venus destined from the beginning to be a hot house, Earth to be eden, and Mars to be a hopeless frozen desert?
Re #24: Dave, if I recall correctly from these papers there’s no particular dispute about those numbers. The question is what they signify. Also note that there is general agreement that there is some sort of effect, but disagreement over its sign and magnitude.
BTW, if 1% quantities are questionable on their face, I assume you won’t complain if someone gives you $99 change for $100. 🙂
Re #29: To all appearances Lindzen will carry his belief in the “iris” into his dotage.
Regarding the models, I think you need to read up on them. Climate scientists generally do take a pretty conservative approach, in contrast to professions with a known history of alarmism, e.g. the insurance actuaries who seem to be pretty much in a panic at this point.
As for extreme outcomes, it appears that the AR4 2x CO2 temperature sensitivity estimate (based on an ensemble of models)isn’t going to change much from the TAR, i.e. it will be something on the order of 1.5C to 4.5C. Does this amount to publicizing only the most extreme possible outcome?
IF anyone wishes to do a post on the solidity of the Neoproterozoic snowball earth and, in particular, whether Neoproterozoic diamictites are solid evidence of glaciation, I’d welcome it. Any volunteers?
re: #33
The point is that the Lin et. al. authors were complaining about Lindzen’s Iris based at least in part about the degree of balance needed in the heat transfer out of the tropics while apparently not considering if the same sort of degree of accuracy wouldn’t need to be present to get this .65 w/m2 inbalance in the tropical heat absorption to mean anything.
To make it more targeted. Just why would a short-term inbalance of 1% in a huge flow of heat out out the tropics matter? The linkage of heat-flow from the tropics and ocean absorption of heat isn’t very clear in the first place. Yes, if it gets hotter in the tropics it will create more wind which will let heat flow north or south and ultimately this should result in a balance between heat in and heat out, but with gigantic oceans to modulate the heat flow, the time constant for such equilibration is very large. If I recall the time over which this .65 w/m2 inbalance was measured was only 10 years. This isn’t long enough to decide if we’re seeing part of a cycle, a random fluxuation, measurement error or AGW.
Re #35: My understanding is that the shortness of the period of accurate measurements isn’t very important since the iris should have no lag. Also, with the amount of warming that’s taken place thus far, the effect should still be relatively subtle, so those small quantities are important. Again, there doesn’t seem to be a debate over the satellite data itself in terms of either the length of the record or the measurments, but rather over the interpretation.
Steve B, I’m not talking abut the Iris theory. I’m rather agnostic on it. I’m talking about what sense there is in worrying about a .65 w/m2 anomaly when the heat outflow from the tropics north or south is 100 times that?
Re #37
Allow me to attempt a simplified laymen’s answer. Suppose I achieve my ideal weight at age 20. There are some 3500 calories in a pound of fat. If I consume an extra 10 calories per day by consuming a single carton of chocolate milk instead of no fat milk, by the time I am 90 years old, I will be seventy pounds overweight, and as a result may have contracted diabetes and be on the verge of several organ failures.
That said, I believe that a few strategically positioned motivated scientists with their thumbs gently pressed on the scale in some convoluted fashion, could mislead the entire scientific community. These tiny amount things work both ways. 🙂
The Ozawa article appears to me to be a. fairly limited and b. fairly obvious. They specify systems in which all energy transport is in the same direction, and thus they exclude solar radiation. This is perfectly valid for treating core dynamics, but I have doubts you can decouple the oceans from solar input and I would wonder about tidal forces on the core
Re #37: As best I can tell (without re-reading everything), Lindzen had pointed to that .65 w/m2 quantity as his evidence for the iris, so of course all of the authors were very worried about it. If Lindzen is correct about the iris, then that .65 w/m2 could be expected to grow much larger as the warming advances and ultimately balance much of the warming effect. If Lin et al are correct that it’s primarily natural variability (and I haven’t followed their citations on this), then Lindzen has no leg to stand on. The relevant cite seems to be Levitus et al (2001). Offhand, assuming such a degree of stability in the face of things like ENSO and THC variations does seem like a big step.
Re #38: Let me repeat, Doug: They’re not arguing about the data, they’re arguing about what it means. So unless you think Lindzen and Lin are conspiring together…
Another article by Ozawa that’s more detailed than the short Eos article linked above is: THE SECOND LAW OF THERMODYNAMICS AND THE GLOBAL CLIMATE SYSTEM:
Click to access Ozawa%20etal%20(2003).pdf
Without the hex blanks:
http://homepage.mac.com/bradmarston/Papers/Ozawa etal (2003).pdf
Re: #30
Fair enough, Steve. Now, if Tim Lambert doesn’t take up the challenge, he as no further cause to whinge about this site’s policies. [Apart from his Spam Karma alarma.]
Re #48
You can obtain more enlightenment here:
http://www.weathermatrix.net/phpBB2/viewtopic.php?t=1623&start=90&sid=1e1da9dc8850a1d040417b551e2682a1
He used to be a major contributor to Yahoo Groups Climate-change which no longer exists.
Best I can tell, It’s some sort of cult speak. Reminds me of a Scientology book I briefly scanned 25 years ago. Apologies if I am mistaken or otherwise offensive.
Re # 42
Figures that S. B. couldn’t resist using the word “conspiracy”, and put a totally unexpected spin on what he responded to.
fix the weblog
A bit OT, but there’s an interesting study on arctic tree-lines here on Pielke Sr’ site:
Click to access Nichols.pdf
Shows a temp max ~ 5000 yrs ago, gradually declining and the MWP & LIA. Present treelines are moving poleward, but still not near where lines existed previously. Jives w/a alot of other proxy studies.
Re #55
It would seem to make sense that the longer the growing season and the higher temps earlier in the year, the more likely it would be that tree seed germinate. So treelines appear to be a genuine if rough approximation to the variability of climate. I’m not so sure that you could fix it to a particular mean temperature in a particular year though.
Tree line proxies sure make a lot more sense than the nonsense of trying to relate tree ring growth to temperature (which could possibly be done, IF one knew how to select those trees which were affected only by temperature changes).
Tree lines and stuff are nice but how about we discuss the actual subject of this thread? I’ve now read OU and both of the Ozawa papers. The second one is presently linked in message 44 by Steve M; though you have to copy and paste to get it to work since the link doesn’t include the “(2003).pdf” part. This paper is quite useful since it is a survey article and includes a primer on entropy and then develops the whole Maximum Entropy Production (MEP) concept in detail. I’m surprised it doesn’t include the OU paper discussed at the top of this thread as it would have been a couple of years old by the time Ozawa2003 was printed.
It does appear that Ozawa is more supportive of AGW than OU though that may not be the total story. In any case, either the Ozawa or OU perspective should pretty much eliminate the scarier scenarios of AGW from consideration.
It appears that Paltridge did a 2 dimentional box model of the world climate system as early as 1978. Is this sort of MEP analysis used in any / some / all of the present climate models?
At this point I’m interested in hearing from warmers, modelers, etc as to what the present status of MEP is in the climate science world. Is it, for instance, discussed in the IPCC TAR?
I have not finished reading the papers, but it’s clear that they demonstrate, again, that water is a miracle substance, and it serves to moderate climate on Earth and to prevent extreme changes in climate. IMHO, minimal forcings from CO2 are easily moderated by water. Of course, this is just a gut reaction, and I can’t prove any of it…
Peter K, additional to other constraints, blogs have to have a Methane Mike policy. I realize that you feel strongly about your theories, but I’m not going to have you take over every post to discuss your own theories. If you want to discuss the topic of the thread, fine. Otherwise, you’ll have to be patient and wait until a relevant topuc comes up. Sorry about that.
Modeling and calculations of global circulation and climate are given in:
Adrian Bejan and A. Heitor Reis, Thermodynamic optimization of global circulation and climate, INTERNATIONAL JOURNAL OF ENERGY RESEARCH, 2005, Vol 29, pp. 303–316, DOI: 10.1002/er.1058.
A. Heitor Reis and Adrian Bejan, Constructal theory of global circulation and climate, INTERNATIONAL JOURNAL OF HEAT AND MASS TRANSFER, June 2006, Vol 49, Issues 11-12, pp. 1857-1875, DOI:10.1016/j.ijheatmasstransfer.2005.10.037.
For theoretical background see Bejan’s books cited in the references for the papers listed above, and:
R. C. Dewar, Information theory explanation of the fluctuation theorem, maximum entropy production, and self-organized criticality in non-equilibrium stationary states, J. Physics A, 2003, Vol 36, pp. 631– 641.
For everything you ever wanted to know about entropy ( and most likely much much more) see Clifford Truesdell (Amazon and other book sellers) and publications of E. T. Jaynes at http://bayes.wustl.edu/etj/etj.html.
Truesdell and Jaynes do not discuss global climate change.
Dan,
Thanks for the references, though I don’t have ready access to them. Are any of them on-line?
Question about principal component analysis.
Principal component analysis looks very similar to factor analysis which I studied in graduate school. (I was a Political Science major, but took a lot of courses in statistics, philosoph of science and research methodology. That was in 1969-1974 so please tolerate my old way of stating things!)
Two important facts to know was the amount of variance each factor accounted for and the loadings of the variables on each factor.
Have Mann and his colleagues provided such data? If so where could I find it. I desperately want to know what variables (series) comprise their PC1 and if it can be considered a valid temperature proxy.
Thank You
re: #59
Have you looked at the links in the sidebar to try to find what’s already been posted here on the subject? I’d susggest looking under Categories – MBH98 and also under Categories – Statistics – Principal Components.
Solar-ouput/clouds/climate 🙂
A tenuous excuse to post a link to:
Click to access harrison2006.pdf
Empirical evidence for a nonlinear effect
of galactic cosmic rays on clouds
BY R.GILES HARRISON AND DAVID B.STEPHENSON
Department of Meteorology,The University of Reading,
OK: so its co-authored by the NAO:Wheat quality man, but if you have your bucket of salt to hand you should be OK.
J Prochera,
Factor analysis is conceptually very similar to principal components analysis (PCA). Your references to the amount of variance explained and the loadings of the variables on each factor shows that you are on the right track.
However, MBH’s implementation of PCA is “non-standard”, and there is a dispute about how many PCs to retain.
You should read both the 2005 MM papers to get a handle on this. Your questions are good ones, and remind me to ask Steve, what are the eigenvalues associated with the first four PCs where the bristlecones are relegated to PC4?
Gentlemen!
Thank you for your suggestions.
When I was facile in the use of factor analysis it was very important to know the loadings of variables on a given factor. Put another way, how highly did variables correlate with a given factor? This would give us a clue as to what was going on, and more importantly, suggest a name for the factor. Put another way, when a Political Scientist would analyze US Supreme Court decisions using factor analysis, he/she would not just name them factor 1, factor 2, … but would be expected to give each factor a dwscriptive name. The names for the three factors which explained most of US Supreme Court voting behavior from 1932 to 1974 ( which is when I stopped analyizing this data) were Freedom, Equality, and Government intervention in the economy. Therefore if instead of referring to PC1 as PC1, but as, for example, North American Bristlecone pine and Giant Sequoias, a great deal of information of how that PC created proxy weather measurements.
It seems to me that most (if not all) of the analysis that Mann et. al. perform require more statistical than climatological skill. Therefore to say that someone is an outsider because he/she is not a climatologist is irrelevant.
That which is relevant: understanding measurement (validity and reliability), understanding the construction of multivariate indices(basically what have you come up with), understanding how to apply statistics, and understanding what the the results mean.
I find the story of the missing r^2 very amusing. I suspect it is missing because it is vey trivial.
I also found the presentation of the infamous “hockey stick” in the IPCC 2001 Executive Summary very uninformative. I doubt that 1 in 1000 people who look at the chart have even the vaguest notion of what the horizontal axis represents. Furthermore, when one examine the grey confidence intervals, which seem to disappear when the chart gets reproduced, an interesting question emerges. What good is a value that is expressed as .2+-.7? That is equivalent to stating the average hight of a modern human is 4 feet+-6feet!
I became interested in this issue because of an issue of USA Today which had a reproduction of the “hockey stick”. I immediately became suspecious because this went against everthing I had read concerning the history of that period. Shortly thereafter, I purchased, and read, the “Green” Vanity Fair issue. I’m not a climatologist, but I know enough about science, statistics, and research methodology to know when something was very bad science. A friend of mine, who reviews books for a local newspaper, wrote a rave review of Elizabeth Kolbert’s FIELD NOTES FROM A TRAGEDY. He was nice enough to lend it too me. I skipped most of the human interest content, but read the “science” segments carefully. It was horribly bad. I then went to the Amazon website where I read the lead review which was a “puff piece” by her friend for SCIENTIFIC AMERICAN and the readers’ reviews which were universally favorable. This led to my crash effort to lean about the field of climate change. I found that in two weeks I knew much more about the discipline than Kolbert did. So I wrote a very negative review for Amazon. The last time I looked, only 2 of 20 readers found my review useful. This is expected since I doubt that anyone except a committed Greenshirt would look to buy this book.
John
John P,
Welcome. It looks like you’re catching on to the games played by the warmers pretty quick. There is, of course, a bit of truth in the core of their theories. CO2 is a greenhouse and doubling it will have some minor effects on earth’s climate. But the warmers won’t let it go at that. It has to be the worst danger ever on earth. That’s why I’m interested in this thread. If the findings of OU are reasonably correct then the chicken-little cries of alarm can finally be put to bed and some sanity can return to the subject.
I.e. if earth’s temperature can be certain not rise more than a few degrees no matter how much CO2 we add to the atmosphere, we only need to worry about a few transient and relatively minor problems.
Dave:
“I.e. if earth’s temperature can be certain not rise more than a few degrees no matter how much CO2 we add to the atmosphere, we only need to worry about a few transient and relatively minor problems.”
We know we can get temp deltas sufficient to get us into and out of ice ages and glaciations. Those are pretty serious alterations of earth’s climate. On its face, a simplistic statement that we cnat chnge temp enough to have serious climate changes is nullified by just this one simple fact. Any reasonable mechanism or theory msut be able to readily account for that degree of temp/climate change, at least.
i knwo that we are talking potential changes outside that range, but unless ther is a good argument for why the temp/climate damping mechanisms kick in *here* and not at lower temps, then they seem suspect on their face.
I think the two things that support the AGW position most are:
1. That CO2 is a GHG.
2. That temps have risen in 20th century so much (while CO2 was rising).
I think it perfectly reasonable to follow and cheer on Steve’s attempts to cut through the Mannian tendentious science (every now and then keeping a check on Steve when he skews things himself), while still believing as a “betting Bayesian” that the climate is being warmed by CO2 (significantly).
#34 you asked:
…Neoproterozoic diamictites are solid evidence of glaciation, I’d welcome it. Any volunteers?
My husband says it is hard to answer that. And “probably not” because glaciars destroy and scramble everything as they flow (forward and backward) and distinguishing all the deposits is a problem. He is not up on the what the current understanding is though.
I found this:
http://www.igcp512.com/nodes/nodecontent.htm
and her main site:
http://www.uoguelph.ca/%7Eearnaud/research/research.htm
Under her list of papers:
Arnaud, E. 2005. The paleoclimatic significance of diamictite in Neoproterozoic glacigenic successions. International Association of Sedimentologists Conference on Glacial Sedimentary Processes and Products, University of Wales, Aberystwyth, Programme and Abstracts: p. 4. Oral Presentation.
–My husband also said he’d prefer to look at that Austrian stalagmite: example of clean data. Then way on another spectrum..said he had a professor in school who’s work consisted of digging random holes in the ground; sampling the sediments; then examined the shape or wear of individual granules or particles of soil (sand/crystals) (the mathmatical calcs were over the top and gnarly)
#71 Peter K, I happen to think you’ve got some valid thoughts but please don’t go overboard disrupting the topics at hand on this blog. Steve (the owner) is doing good important work auditing the famous climate models at the statistical level. He and we all want the same thing here I believe: the truth.
Take care!
re #67
The thing about ice ages is that a necessary precondition to their occuring is that the polar areas be blocked. In the present era this is from the Antarctic continent lying smack-dab over the south pole and the continents blocking in the Arctic ocean except for a few areas. This means there isn’t as free a flow of heat from the tropics northward and southward as “usual” and thus heat can’t be vented as well as normal.
However, according to how I read OU, this doesn’t matter too much on the up-side since much of an increase in temperatures will produce more low-level clouds which will block sunlight and thus limit temperature increase. And the important thing is that this mechanism doesn’t care if it’s CO2 causing the initial temperature increase or something else. It’s just the surface temperature which matters. (SSTs are actually what his paper’s concerned with so that land temperatures can rise somewhat more until “cool breezes” from the oceans overwhelm them.)
#72, 62I’d noticed Arnaud from googling as well and it was a comment of heres that prompted my question. In one of her posts, she mentions that certain diamictites (in Scotland, I think) could be construed as sediment slumps. I also saw a paper which noted that the biota before and after a diamictite were about the same, which seemed inconsistent with glaciation. How do we KNOW that these diamictites are not just sediment slumps and not glaciogenic? Some of the Neoproterozoic earth theory is very recent. One of the main promoters was Daniel Schrag, who was a presenter at the NAS Panel about corals of all things. The genesis of the theory seems to be in 1992. It smells very faddish. I don’t know this, but it would be interesting to really see what the diamictite evidence is when you disentangle all the string.Re #67:
That’s a red herring, Lee. Dave specifically was talking about the amount of warming that can be caused by raising CO2 concentrations. Your implicit assumption that ONLY changing CO2 levels could have caused the ice ages is not supportable. A number of different mechanisims have been theorized to have caused the ice ages to come and go, however the truth is that at the moment we really don’t know which one is correct. You have not nullified Dave’s argument.
RE: #68 – I know that some here have complained about your writing style and that some of what you purport is certainly speculative. That having been said ….
I also strongly suspect that land use changes have a much greater impact on the so called “global climate” than the partial pressure of CO2 in the atmosphere. This is not to say the PP CO2 is not impacting things, but is to say that yes, PP CO2 has an impact, and in all liklihood, land use changes have a far greater impact. Anyone who has ever done real work on real heat flow / removal problems will immediately recognize just how likely this may be. A “hot spot” can be an immensely disruptive thing – far more disruptive than a small increase in bulk thermal resistance at large. Accumulate the hot spots owing to human population growth, the amazing proliferation of man made energy dissipating sources, and, the conversion of vast tracts of land from wild to cultivated, managed and built / paved, and it immediately becomes clear that the atmosphere has to react to it all. You can’t create numerous hot spots and not have a significant effect. This should be non controversial and in fact, merits intense study. But in reality, it is barely inspected and in fact, is considered a “don’t go there” item by the “climate science” orthodoxy, by and large.
RE: #76 – By the way, what I have attempted to treat here goes far beyond so called “UHI.” What I am describing in the network of hot spots accumulated due to the global sum total of all land use changes. A shack in the middle of Antarctica is a small hot spot. A cleared area in the Taiga is a small hot spot. A newly paved road in Tibet is a hot spot. Etc.
What you say is correct to some degree, Steve S, but there are complications. First we need to consider albedo both before and after a change. Thus some rocks will reflect much more light than say grass and trees, so turning a bit of meadow into a concrete parking lot might actually create a cold spot. And I know if you look at typical older suburbs from the air you mostly see trees, not pavement. Trees confuse me a bit. They typically have a low albedo but they do photosynthize which removes energy. And transpiration from trees and vegetation in general which makes forests act more like oceans in terms of convective ability. Then there are reflective roofs. Anyway I think UHI is underestimated as an input to measured temperatures and the whole surface temperature measurement regime is sorely in need of a Steve McIntyre who has time and desire to dig to the bottom of it.
Lee: Couldn’t the Sun (or changes in orbit) account for these changes? Water can moderate climate only to a certain degree.
RE: #78 – good comments. Also, bear in mind, I am interested in both the albedo / reradiative effects, as well as, the effects due to man made dissipation – for example, space heating, lighting, equipment, motors, electrical current transport, etc. Spot on about the need for a Steve McIntyre to delve into it.
re 73:
Dave,
Sure, I get that the mechanisms and feedbacks going up-delta from current temps are likely to be different from those going down-delta, or even from past up-delta shifts starting at lower temps. But this is potentially true at nearly any temp; we did warm substantially from the last glaciation, even with the circumpolar geological conditions remaining as they are, and we are reasonably sure that the planet has been much warmer in past eras.
My point is that if OU is arguing that this mechanisms is capping potential positive-delta right now, he somehow has to explain why it is operative at this time at this temperature threshold, but was not operative during the warming from the last glacial, or in past warmer geological era. In particullar, why did geological forcing, or milankovich cycle forcing not get restrained to that degree, but CO2 forcing will? Those observations dont mean that OU’s mechanisms isnt operative, but they strongly imply that it isnt determinative at least in a fairly broad range of conditions and several kinds of forcings.
Re #76: Steve, the influence of land use changes on climate is a very active area of research and is very much factored into the models.
In general on this subject, I would suggest that everyone have a look at this. This is the paleoclimate work that reallt matters. Milankovitch cycles do seem to drive the glaciations despite being relatively small in terms of w/m2. The key point is that this small forcing drives a CO2 feedback which in turn drives a water vapor feedback that actually does most of the work (and of course the details are complex). What we are doing now is ramping that middle term far beyond the peak it reached during any of the recent interglacials. Can it reasonably be expected to just go away by itself without driving the water vapor feedback as it has done so many times before?
Re #82, Steve Bloom
What, like MBH98 ?
First off, we don’t know know that anything’s operative now. Just that if it’s needed it will be active. But I see no reason that such feedbacks wouldn’t start being active even at smallish forcings. Think of a standard sort of thing; it starts off slow picks up speed becomse exponential and then levels off. But even during the exponential stage something can reverse direction, sometimes abruptly. We don’t know where we’re at temperaturewise.
Second, OUs mechanism applies to the ocean portion of the earth and gives good results as long as the predominent portion of the earth’s surface is ocean, as it is now. Therefore what we need to look at are the SSTs. They’ve risen some, but not a huge amount. A lot of warmers worry about the ocean being able to absorb CO2 or heat, but in OUs picture that’s not important. The important thing is how warm the surface becomes. If it starts warming considerably this is what will trigger the MEP to start changing the cloud cover which will counter the rise. Note that since we’re talking reflecting incoming solar energy, this isn’t affected by the CO2 content of the atmosphere. IOW,
1. SSTs become higher
2. Low cloud cover increases
3. SSTs become lower
Now 1. can happen because of a CO2 augmented greenhouse effect (and there could even be a positive H2O feedback of the CO2 effect), but the MEP doesn’t care, it just adjusts to minimize the increased temperature and will become stronger the further out of balance things get. Actually, of course it’s not minimizing temperature increases but instead maintaining maximum entropy production. One way of looking at that is to realize that entropy is heat divided by temperature. So the lower the temperature at which you’re shoving out heat, the more entropy it’s taking with it. So whatever lets the earth surface get rid of its excess heat at a low temperature will be favored. Moving it to the poles where things are cool to be sent to space would be an example. Keeping the surface cooler by reflecting away visible light is more complex though since sunlight has lots of energy. But when it’s reflected away, it’s never really a part of the system and further is fully capable of being degraded to heat elsewhere. If I recall one or more of the papers expressed that last somewhat better, but I’ll have to wait until I get time to reread them to find it.
RE: #82 – I must ask you, do you understand what I mean by “hot spot?” Let me try this. Assuming you have, at some point, taken apart a computer (or even seen someone else do it) you might have noticed what appear to be precision shaped metal bits, mounted on top of some of the electronic devices. What do you think they are for?
Re #85: I think it’s fair to lump infrastructure into land use changes since as a practical matter it would be rather difficult to separate them. One could back into such a calculation by taking energy use figures, which would probably give a more meaningful number than hot spots as such. I faintly recall seeing something like that, and if I remember right it turned out to not be a significant factor globally. Try googling for it.
RE: #86 – So here are some things for you to consider since it does seem that you sort of comprehend some of the basics regarding heat flow. Let’s say that I create a model. In this model, I set forth what is known as an infinite half slab (essentially, a mass of rock with a flat surface of infinite breadth and depth). I can then refine it by messing with the surface characteristics and probably come up with a reasonable approximation of a small area of the Earth’s surface in its “natural” state. Based on that, and based on things like the energy coming from the Sun, the heat flow coming from the Earth’s interior, and an assumed set of atmospheric characteristics – thermal resistance, Reynolds number (a measure of how the air might physically flow) and others, I can then begin to create what is known as a “finite element” that models a tiny bit of thermal behavior. There are some really nice sets of canned software, Flowtherm being one of them, which are used for things like modeling heat flow and thermal characteristics in electronic equipment – so that you can design the correct heat sinks and fans such that the silicon devices (which are typically hot spots) do not overheat and fail. Unfortunately, at the scale of the earth, there is no canned software to do anything really similar. Therein lies a challenge, but not an insurmountable one. I digress.
Let us postulate that we take our idealized, “natural” small area of the Earth, and put Man there. He might clear the forest, start a farm, and eventually there may end up being a really nice farm with a McMansion on it, temperature controlled outbuildings, electric deicers, and all sorts of things. Or, perhaps this small piece of Eden ends up as part of a connurbation, or maybe a strip of development along an interstate highway. Clearly, in addition to the “natural” sources of energy which were there before, there will be new, dense and highly localized additional sources. Imagine each of these sources to be modeled as a node. As one models reality in this way, we end up with a vast network of nodes, superimposed on a surface whose albedo has been altered. As expected, the impact of all this will difer dramatically depending on how far above one makes a measurement in the atmosphere. The net of it is, for each node, there will be invoked a thermal gradient. For gradients that are of a certain degree, movement of the air may be incited. Taken in sum, across the entire Earth, a whole additional component of energy will be induced. Rather than viewing this, however in an integrated fashion, it is better to look at each small area, and to witness the local effects of each node. What should be integrated is not the sum of the nodes, but the sum of their second and third order effects.
One of the still frustrating issues with global climate models is their generally bulk approach. The algorithms and computing power to allow a finite element sum of second and third order effects (such as the many small turbulent flows resulting from what I’ve described above) are not yet there. In order to have a truly effective GCM, a really good finite element analysis, along the lines of a global Flowtherm, but inclusive of many, many more variables and degrees of freedom than Flowtherm, would be needed.
What would it yield? I wish I knew.
RE: #88 – One thing to demonstrate what I have written – as a child, I used to ride in a glider with my father. At the time, there was a lot of open land not far south of where you live – namely, in Fremont. We’d be towed from a now built over airstrip and be released at some point. We’d be in a slow descent until we’d near the big GM (now Nummi) plant. Then, presto, we’d hit this amazing thermal which would give us enought altitude to be able to make it over to Mission Peak. Without the albedo modification thanks to the GM plant, we’d not have been able to do that.
I’m challenged statistically on the level of this blog, but I understand heat-systems pretty well. What I’ve gotten from the Ou paper is that the scale of the earth “heat-engine” is so large, the overall sum of the global climate processes should tend to a relatively stable state according to MEP (this would be an overall negative feedback). I remember the one thread here that showed a long geological record (billion of yrs?) where the climate looked like it had upper-lower preferred bounds & the global temps oscillated between them. That kind of behavoir could be a manifestation of the MEP principal.
Well duh, it’s the Ozawa Ohmura paper that concerns the MEP, not Ou. But perhaps Ou’s model is demonstrating where the “negative feedback” is coming from.
re: #92-93 Well, if you read section 1 carefully you’ll see Ou is describing the same thing, though he calls it Maximization of Internal Entropy Production. This is perhaps actually a better term since when clouds reflect solar radiation they’re “avoiding” the chance to degrade such visible light into IR / heat.
But it is the Ozawa Ohmura paper which provides a good discussion of the subject. You’ll note that Lorentz is one of the co-authors and he’s the one OU starts out discussing.
That bounded temperature graphic is indeed called to mind in this case.
Now I’ve been familiar with Entropy for decades but have always had a bit of problem visualizing it in a way my mind could retain. But When I started reading the OOLP paper (to abbreviate the authors) and looked at the familiar and fundamental equation, dS = dQ/T I suddenly was able to internalize the basic concept that Entropy was larger the smaller the temperature and that therefore a “desire” to maximize entroy with a given amount of heat was equilivent with dispersing at as low a temperature as possible. So, since we have a relatively fixed amount of heat energy which reaches the earth’s surface, the MEP concept is that the preferred pattern was for it to be sent off as low-temperature heat or as long-wavelength radiation, both of which have high entropy.
If a situation arises where the surface temperature will rise, this will send more of the heat off in lower entropy forms. So if there’s a method available which will prevent this, it will be preferred. The OU MEP solution is that the Earth’s heat system will find that producing more clouds that reflect external low-entropy energy (i.e. solar radiation) will keep the temperature lower and thus heat will be able to continue being dissipated in a high-entropy way.
So the question is, as I asked earlier, is this a correct analysis and is that indeed what the earth will do? I’m looking for someone who is willing to discuss this situation.
Peter
While it’s true that clouds send the solar light back into space via refraction rather than the sort of reflection seen in a mirror, the result is much the same (execpt that refracted light is diffused while a mirror can reflect an image. The energy for the most part doesn’t enter the earth system either via absorption in the clouds or by the surface.
Clouds absorb IR radiation from the surface and convert it into heat (kinetic energy). Yes, a lot of surface energy is transported to high in the atmosphere via thermals, but that’s a different process. More importantly my quote doesn’t refer to energy that ever made it to the earth’s surface but to energy which was sent back into space (whether you allow it to be called “reflected” or insist on “refracted” makes no difference.)
Gibberish! I defy you to state that in a form which anyone except yourself can understand. Same goes for the rest of your message.
Dave, I think his point with that last sentence you quoted, is that in any given system at any given time you have energy in two major forms, radiation and kinetic energy. And I think his point is that the energy in the form of radiation does not contribute to the overall entropy of the system. However, I suspect he’s wrong about that, but I don’t know enough physics to say for sure.
When you’re talking about the energy in a system you certainly do want to be considering all of it, even that which is “in transit” in the form of electro-magnetic radiation and not actually busy moving any matter at any given time. Does the concept of entropy take that into account?
Of course he’s wrong. The entropy of a “gas” of radiation can be determined just as that of a gas of molecules can be. Here’s a link to a classic article: http://www.pubmedcentral.nih.gov/pagerender.fcgi?artid=1084969&pageindex=1#page
In the case of radiation the equilivant of the temperature is the frequency so that the lower the frequency the lower the radiation temperature and therefore if a given amount of energy is removed from a system via IR vs UV light, for instance, the entropy production will be much higher.
“Although carbon-14 decays into nitrogen-14 through beta decay, the amount of carbon-14 in the environment remains constant because new carbon-14 is always being created in the upper atmosphere by cosmic rays.” Link
Do the climate models take into account the armospheric creation of Carbon?
Mark,
Answering your rather old message which apparently was missed earlier,
Why would a GCM need to consider C14 levels? That only enters into the picture in the data-acquisition phase of things. If you’re feeding in data to a model, you’d better be feeding in data that’s been converted into the things the model recognizes and that doesn’t even include the age of things, only of events. So if you used C14 dating to determine the age of a volcanic eruption you’d indeed have to calibrate your instrument based on things like solar activity but a model wouldn’t know anything about such things, it’d just know that a particular forcing from the eruption occured a particular time.
Re #85, I don’t know much about this so I’ll ask.
Why is it that the C14 ratio in the atmosphere remains constant? Half the carbon in the atmosphere, added in the last 100 years should be almost C14 free. Seems C14 ratio should be lower than a couple hundred years ago. Could we try to use this to figure out how much of the CO2 in the atmosphere was from fossil fuel sources?
The mid ocean rifts are active often for hundreds of miles along their lengths. The amount of carbon they dump into the ocean must be substantial. That would throw a monkey wrench into the calculation as activity a hundreds of years ago might only reach the atmosphere today.
How constant is rifting?
re: #87 I don’t believe the C14 ratio has remained constant, but it’s been measured quite accurately both directly from the atmosphere and from datable tree-rings for a long time so the adjustments to be made for an object with organic carbon are well known. Here we’ve been talking about adjustments to the known adjustments because of local conditions. Those, obviously can’t just be looked up in a table but must be calculated based on objects of a known age in an area.
(Comment moved to here, I’d misposted it, it got copied to the temp thread, and after I asked SM said it’s OK to add it to this thread.
Request for those contributing to help new readers out because most of the recent cross references are numbered wrong — either numbering’s broken or a lot of responses went missing?
But if folks can make sense out of the conversation, and recreate who wrote in reply to what, so it can continue, that’d be great.
It might be safer to quote a bit more of what you’re responding to, rather than the unreliable topic number?
—–
That thread appears broken “¢’¬? weblog software corrupted? The number sequence falls apart halfway through it –indexing that broke?
Look at what’s left for references in it:
44 is a reply to 48
47 is re 55
55 is re 59
63 is re 67
64 is re 72
65 is re 67
66 is re 68
67 is re 76
71 is re 73
72 is re 76
73 is re 82, and 82 is attributed to Bloom
75 is re 82
76 is re 85
77 is re 86
78 is re 88
81 is re 92-93
82 isn’t by Steve Bloom, it’s re 87, and written by Dardinger, dated 8/28
92-93 do not exist.
This is broken, not possible to tell what refers to what. Is it possible to fix the thread so it is readable?
Hank, some nasty comments were deleted. That’s why the references are no longer correct.
I’d say this makes a good argument for leaving at least one word of each posting, to preserve the numbering sequence — so innocent cross-references don’t suffer from the deletions, next time.
Well, if the surviving people want the conversation to go on, I hope they’ll reconstruct the sense of it. It looked interesting for a while til the numbering fell apart.
ping – for people discussing climate on geologic scales, this article is worth considering.
This is very interesting. Reading it all at once, I get the impression that basicially the Earth is a big self-regulating self-healing machine powered by the sun. Almost like it’s alive or something.
But as I’ve said before “We don’t know.” is a perfectly good answer at times. Seems like it just does what it does.
Noticing the talk on the Iris Effect, is it now at least somewhat vindicated? Made me think of something Pat Frank said in “SPM released”
Does anyone know what the clouds were doing a couple hundred thousand or million years ago? Ah, yes. Models.
It will be obvious to most people, especially the physicists and engineers, but perhaps worth stating explictly for people not experienced with dynamic systems. A nonlinear negative feedback will not reveal itself until the system is really given a good push beyond the threshold where linearizations fail. It will lay hidden, dormant, waiting to spring into action. A lot of talk about negative feedback from clouds seems to forget that nonlinearities do not emerge as readily as linear responses. They are shy. Not as amenable to experimental parameterization. I am not a climatologist. But I know feedback.
The Ou paper that starts the thread cn now be found at http://ams.allenpress.com/perlserv/?request=get-document&doi=10.1175%2F1520-0442%282001%29014%3C2976%3APBOTES%3E2.0.CO%3B2
It’s basically theoretical, but has some interesting points and refs. I’d like to see a thread started on empirical evidence for paleoclimate stability, and hence low climate sensitivity, as I requested over on Unthreaded #29.
As far as “Snowball Earth”, my impression is, the hypothesis is holding up pretty well, but this was a long, long time ago… Wikipedia’s intro http://en.wikipedia.org/wiki/Snowball_earth is a reasonable place to start.
Best for 2008, Pete Tillman
My impression of Snowball Earth is that much primary evidence, when cross-examined, admits a less exotic interpretation e,g, the recent Eyles and Januska 2007. It looks far from proven to me.
96, Steve
Do you have a complete cite handy? I haven’t seen this one, & Google can’t find it.
Also see http://www.sciencedaily.com/releases/2007/03/070323104746.htm
for another Snowball skeptic. No real ref here, bah.
Cheers — Pete Tillman
You can currently link to the pdf from the home page of snowballearth.org
#96, Snowball Earth (con’d)
Here’s another recent “pro”:
http://www.pnas.org/cgi/reprint/0504878102v1
The Paleoproterozoic snowball Earth: A climate disaster triggered by the evolution of oxygenic photosynthesis
2005, Robert E. Kopp *, Joseph L. Kirschvink, Isaac A. Hilburn, and Cody Z. Nash
“… oxygenic photosynthesis could have destroyed a methane greenhouse and triggered a snowball event on timescales as short as 1 million years…”
Read the Summary (at end), darn PDF won’t let me copy text. Speculative, of course, but thought-provoking.
Cheers — Pete Tillman
#98, Snowball Earth, Eyles & Januszczak
Thanks, got it. Yeah, long time ago… I have no idea of how to resolve a dispute over field interpretation in a place that I haven’t been within a thousand miles of.
Also see http://www.snowballearth.org/pillars.html
“Snowball Earth on Trial”, an interesting conference report from 2006.
Obviously still an open question, and not one that’s high on my list of things to resolve 😉
But Steve’s skepticism is certainly appropriate.
Cheers — Pete Tillman