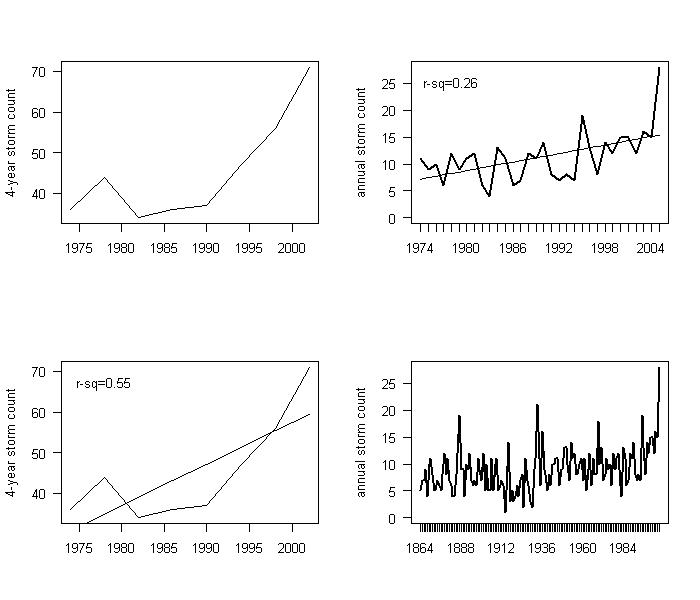
Here’s bender’s plot of the number of hurricanes, showing the difference between plotting on an annual and boxed basis. There are statistical issues in fitting trend lines to spiky data like this, which bender is well aware of and pointed out in the predecessor thread. If Curry is unaware of these issues, what does that say? If she is aware of these issues and ignored them, what does that say?


241 Comments
Dang, I can’t see all the spikey graphs because of the sidebar. Is there a way to fix this, or do I have to wait a few days?
Hah!…look it here…some more hockey sticks!
A question: are the data for the left-hand graphs four year running averages, or block averages?
Re 1
Widen your window dude.
The problem with categorized data couldn’t be clearer than that …
Which is why I came up with my power dissipation index, which I find was already pre-invented by Emanuel. That avoided the same problem w.r.t. “Category 5, Category 4” etc. hurricanes.
w
I think this is complicated by a lack of accurate records pre-1950 or so. Prior to modern recording methods, they found out about hurricanes when they either hit land, or interrupted shipping. This qualifies as major sampling error in the early records.
So, in short, no gballela, no HS w/o better records prior to 1950 (ballpark).
Mark
Why not show a plot of only the hurricanes that struck the US mainland between 1854 and 2006? That would give you a more homogeneous data set, since many of the earlier hurricanes that were only out at sea were missed.
Even that would be lacking due to minimal population on the lower coastal regions at the time (as well as an inability to accurately measure true hurricane strength). I agree, however, that it would be “better” in some respects.
This brings up a question, do we really know, pre-1950, how strong each of the known ‘canes was? The benefit to today’s nifty hurricane technology is that a cat-X is a cat-X based on its peak. However, pre-1950, a storm could easily have been stronger before it was recorded (ignoring measurement error in the first place).
Mark
A brief comment about “extraordinary events”, such as last year’s total number of storms. In January 1998, we had a major “ice storm” here in Quebec. There was freezing rain for about 5 days in a row, with little interruption. Ice built up on transmission lines, to a thickness of 2-3 inches, whereas they’re designed to withstand something like half an inch. And sure enough after a few days of this regime, pylones started collapsing as if they were made of matchsticks (right next to where I live, a very impressive sight!), and an entire section of one of the main 735kV lines was entirely destroyed, leaving about 400,000 people without power for 3+ weeks, in the middle of January, where temperatures can typically fall below -20C. This could have been a major katarina-like catastrophe, with dozens of casualties, but fortunately there was an immense and well coordinated relief effort, and only a handful of people actually died of indirect causes.
My point is that, at the time, the event was blamed on, you guessed it, global warming! And we were warned that there would be more like it in the future. For a couple of years, whenever there was a tiny risk of freezing rain, the media got all excited. But of course, nine years later, there has been nothing remotely similar, and we have had quite ordinary winters, some warmer, some cooler.
Somehow freakish weather always attracts a lot of attention, and we have that reflex of always wondering if it’s not a sign of things to come. Flooding here, drought there, hurricanes, tsunamis. It seems like there are more and more of it. But read 30 year old newspapers and you’ll find the same. Only there wasn’t CNN at the time, and most catastrophes went by unnoticed. There was a time when a heat wave was just a heat wave, and we knew we’d get one every summer. Now it’s the prelude to the end of the world!
2005 was a freakish year for hurricanes and tropical storms and that’s it. People who try to link it to global warming will look like fools if there are fewer storms over the next couple of years.
Now on to statistics: what’s the trend if you remove 2005? How reliable are the data pre-1970?
If Curry is unaware of these issues, what does that say? If she is aware of these issues and ignored them, what does that say?
What did Judy say when you asked her, Steve?
Best,
D
This is great. The annual data plot obviously gives you a much clearer idea of what is really happening.
It shows the 2005 season as an outlier (which 2006 may be on the other side of the graph) and it also shows some longer-term cycles (not substantial) which is what the weather forecasters and the National Hurricane Centre have been saying all along.
Now, we see that the data selectors are trying to distort the record and they are trying to pressure the weather forecasters into tying global warming into a naturally variable cycle of tropical storms.
There is not a complete record for the early years of the dataset (as noted above) but there does appear to be a slight upward trend in storm numbers which we should acknowledge as well.
Based on Willis’ data and terminology (thanks Willis for the very interesting idea), it’s easy to figure the # of storms per year, the power dissipated by the total of all storms per year, and the average power dissipated per storm.
One can argue about the validity of the data; I’m just taking it on face value. The number of storms and total power dissipated both show an upward trend. As others have noted, this could be because storms were missed in earlier years or maybe there really is an upward trend; I’ll leave that argument for others. 2005 really is unusual for sheer numbers. But what particularly interested me was the average power dissipated per storm (ie average storm intensity); it’s dead flat over the entire length of the record. There is nothing remarkable about the past couple of decades. 2005’s average PDI per storm of 12.8 is pretty much spot-on the long-term average and just over 1/3 of the average for 1915, which had only 5 storms but an average PDI per storm of over 33.
The data’s listed below; I can email the spreadsheet to Steve if anyone’s interested.
Regards;
Ken
PS; it’s possible I’ve made an error in collating the data. But I can assure everyone that any such errors are irrelevant, the spreadsheet formulas are locked and hidden so it’ll take you a while longer to figure out, and by the time any mistakes are spotted I’ll have moved on to something else.
Year #Storms PDI/Storm TotalAnnualDissipatedPower
1851 6 6.57 39.39
1852 5 17.43 87.17
1853 8 14.66 117.25
1854 5 7.95 39.75
1855 5 4.55 22.75
1856 6 10.21 61.25
1857 4 11.60 46.42
1858 6 8.21 49.25
1859 8 9.76 78.08
1860 7 10.40 72.81
1861 8 6.68 53.46
1862 6 8.86 53.14
1863 9 6.16 55.41
1864 5 5.30 26.52
1865 7 7.96 55.75
1866 7 16.50 115.53
1867 9 7.55 67.93
1868 4 10.36 41.43
1869 10 6.07 60.72
1870 11 9.96 109.51
1871 8 12.87 102.93
1872 5 13.87 69.33
1873 5 16.96 84.78
1874 7 6.99 48.95
1875 6 13.29 79.73
1876 5 12.90 64.50
1877 8 9.86 78.89
1878 12 19.30 231.58
1879 8 9.10 72.81
1880 11 14.83 163.18
1881 7 9.09 63.62
1882 6 11.92 71.51
1883 4 25.36 101.42
1884 4 22.21 88.83
1885 8 7.89 63.15
1886 12 17.34 208.04
1887 19 12.16 231.01
1888 9 12.48 112.35
1889 9 12.41 111.72
1890 4 10.54 42.18
1891 10 14.13 141.34
1892 9 14.95 134.51
1893 12 26.37 316.46
1894 7 26.23 183.60
1895 6 13.72 82.35
1896 7 25.59 179.11
1897 6 10.04 60.22
1898 11 12.09 132.96
1899 9 23.13 208.20
1900 7 15.40 107.83
1901 12 7.94 95.24
1902 5 8.16 40.80
1903 10 11.96 119.55
1904 5 4.66 23.30
1905 5 6.59 32.95
1906 11 18.09 199.01
1907 5 1.81 9.04
1908 10 10.98 109.84
1909 11 10.24 112.68
1910 5 18.52 92.60
1911 6 5.78 34.69
1912 7 8.86 62.05
1913 6 5.54 33.25
1914 1 2.07 2.07
1915 5 33.21 166.06
1916 14 16.07 225.04
1917 3 24.39 73.16
1918 5 5.75 28.75
1919 3 23.86 71.59
1920 4 9.52 38.10
1921 6 16.53 99.17
1922 4 24.47 97.87
1923 7 10.45 73.12
1924 8 14.66 117.28
1925 2 3.04 6.09
1926 11 29.38 323.13
1927 7 12.00 83.98
1928 6 18.08 108.47
1929 3 19.51 58.54
1930 2 28.30 56.60
1931 9 3.54 31.89
1932 11 17.36 190.92
1933 21 12.63 265.31
1934 11 5.12 56.30
1935 6 22.06 132.37
1936 16 8.18 130.82
1937 9 7.52 67.71
1938 8 12.69 101.55
1939 5 7.30 36.48
1940 8 6.21 49.68
1941 6 10.75 64.53
1942 10 6.88 68.83
1943 10 12.16 121.57
1944 11 10.80 118.78
1945 11 7.56 83.12
1946 6 4.46 26.77
1947 9 17.43 156.87
1948 9 15.63 140.65
1949 13 9.43 122.54
1950 13 28.03 364.40
1951 10 19.32 193.18
1952 7 17.08 119.56
1953 14 10.08 141.10
1954 10 14.65 146.51
1955 13 23.32 303.16
1956 8 8.89 71.12
1957 8 15.36 122.88
1958 10 16.99 169.93
1959 11 9.44 103.80
1960 7 20.68 144.78
1961 11 28.37 312.07
1962 5 8.91 44.57
1963 9 18.23 164.08
1964 12 20.59 247.03
1965 6 18.93 113.60
1966 11 18.14 199.58
1967 8 19.81 158.45
1968 8 5.90 47.17
1969 18 11.83 213.01
1970 10 4.61 46.10
1971 13 8.42 109.52
1972 7 5.49 38.46
1973 8 6.68 53.41
1974 11 7.88 86.67
1975 9 10.23 92.04
1976 10 10.22 102.22
1977 6 5.72 34.34
1978 12 6.25 75.04
1979 9 15.12 136.08
1980 11 9.85 108.36
1981 12 9.56 114.69
1982 6 6.54 39.23
1983 4 4.36 17.46
1984 13 6.79 88.32
1985 11 10.06 110.69
1986 6 7.36 44.18
1987 7 3.11 21.78
1988 12 12.85 154.15
1989 11 17.13 188.39
1990 14 7.33 102.60
1991 8 5.56 44.52
1992 7 16.86 117.99
1993 8 5.81 46.46
1994 7 4.41 30.90
1995 19 15.48 294.11
1996 13 17.61 228.92
1997 8 6.18 49.41
1998 14 18.65 261.13
1999 12 19.63 235.52
2000 15 9.81 147.10
2001 15 9.27 139.02
2002 12 6.32 75.80
2003 16 16.20 259.19
2004 15 23.11 346.65
2005 28 12.81 358.66
Average 8.73 12.55 111.16
This is so annoying; it is Mann’s figure 7 all over again. How much more is buried out there?
Re #9
Coefficients:
Estimate Std. Error t value Pr(>|t|)
Intercep -353.4 126.4 -2.79 0.00913 **
t i m e 0.18310 0.0636 2.88 0.00742 **
—
Signif. codes: 0 ‘***’ 0.001 ‘**’ 0.01 ‘*’ 0.05 ‘.’ 0.1 ‘ ‘ 1
Residual standard error: 3.167 on 29 degrees of freedom
Multiple R-Squared: 0.2223, Adjusted R-squared: 0.1954
F-statistic: 8.288 on 1 and 29 DF, p-value: 0.007423
Re: #10 She said nothing, Dano, when she had the opportunity to respond over at RC. Yet she chose to respond to other questions. Maybe she was pressed for time.
Oh, and this model assumes white noise structure and independence of observations. If you adjust for the noise structure being ARMA(1,1) then the effetive sample size drops, the degrees of freedom will be cut by ~2/3, and significance may drop to p=0.01 or p = 0.05. Who knows?
Anyone wishing to tinker with these data is free to do so:
year count
1864 5
1865 7
1866 7
1867 9
1868 4
1869 10
1870 11
1871 8
1872 5
1873 5
1874 7
1875 6
1876 5
1877 8
1878 12
1879 8
1880 11
1881 7
1882 6
1883 4
1884 4
1885 8
1886 12
1887 19
1888 9
1889 9
1890 4
1891 10
1892 9
1893 12
1894 7
1895 6
1896 7
1897 6
1898 11
1899 9
1900 7
1901 12
1902 5
1903 10
1904 5
1905 5
1906 11
1907 5
1908 10
1909 11
1910 5
1911 6
1912 7
1913 6
1914 1
1915 5
1916 14
1917 3
1918 5
1919 3
1920 4
1921 6
1922 4
1923 7
1924 8
1925 2
1926 11
1927 7
1928 6
1929 3
1930 2
1931 9
1932 11
1933 21
1934 11
1935 6
1936 16
1937 9
1938 8
1939 5
1940 8
1941 6
1942 10
1943 10
1944 11
1945 11
1946 6
1947 9
1948 9
1949 13
1950 13
1951 10
1952 7
1953 14
1954 11
1955 12
1956 8
1957 8
1958 10
1959 11
1960 7
1961 11
1962 5
1963 9
1964 12
1965 6
1966 11
1967 8
1968 8
1969 18
1970 10
1971 13
1972 7
1973 8
1974 11
1975 9
1976 10
1977 6
1978 12
1979 9
1980 11
1981 12
1982 6
1983 4
1984 13
1985 11
1986 6
1987 7
1988 12
1989 11
1990 14
1991 8
1992 7
1993 8
1994 7
1995 19
1996 13
1997 8
1998 14
1999 12
2000 15
2001 15
2002 12
2003 16
2004 15
2005 28
David Stockwell posted up a link to a paper suggesting that hurricane count were poisson distribution. I wonder what that would do to trend calculations?
Having said that, given that it’s warmer now than in the 19th century and hurricanes are connected to SST, why wouldn’t there be more hurricanes? I wonder what the hurricane counts were like in the MWP, the RWP and in the Holocene Optimum.
The partial autocorrelation coefficients at lags of 5 and 10 years are highly significant and positive. That explains why a 5-year window *really* seems to “do the trick”. (Use the function pacf() in R to compute these.)
Re #17: It should be a poisson process – just as the number of ducks on a pond, the number of hikers on a trail, the number of trolls on a blog …
Changing the distribution of errors to do poisson regression is easy. I’m out of time though.
#16 was posted before reading #12. Nice to see Wills & I got the same counts. Speed-math in public is a risky undertaking.
For those of you who aren’t following what’s going on here, read Bender and Steve Blooms comments, there numerous, in the UCSCCSP Atmospheric Temperature Trends thread. Thanks Bender! Your graphic illustrations are quite dramatic and very persuasive.
I was pondering what the 140 year annual storm count graph would look like if we had weather satellite data throughout the entire 140 year period. Since there is no question that the quality of tropical storm counting data decreases rather dramatically as we go back in time from the present, and Bender’s annual storm count shows only a slight increase over time with the exception of an outlier, one might ask if warming reduces the annual storm count.
This is a good question. I think. Uncertainty and bias in time-series analysis are my favourite subjects.
RE: #22 – The other thing to ponder regarding the older records is what they are based on. For the ones that never reached land, presumably they are based on ships’ records. Two considerations here. Firstly, without the benefit of modern navigation and radio technology, I would reckon that prior to the late 1800s there were a far greater number of, shall we say, very unfortunate ship – hurricane encounters vs today. Certainly there are no logs in such cases. Secondly, even for surviving ships, one ships “hurricane” may have been another ship’s somewhat downplayed “dirty weather.” I seriously doubt that “dirty weather” would be counted in the “official” records as a hurricane even if it was one. The only ones counted amongst the ones that never made landfall were probably ones where multiple ships both survived them and specifically logged them as “hurricanes” or specifically made enough actual meteorological measurements and wrote them in their logs, that we can recognize them as such after the fact. Let’s be real – prior to the 1900s, how many ships had both the instrumentation and discipline to do that?
Steve S – Not disputing taht this is an issue, but a bit of clarification.
Hurricanes make a very unique signature, in the form among other things of a long-period swell, that has been recognized (and feared) by mariners for a very long time. Clearly reporting in past times can’t have been as reliable as today, but the ability of mariners to recognise that there was a hurricane out there was likely much better than you imply.
I havent read it in many years now, but the chapter on hurricanes in American Practical Navigator (more commonly known simply as Bowditch) is quite good, and quite terrifying.
Anyone interested in plot that power time series Willis put together on another thread? Now that would be interesting.
RE: #25 – I seriously doubt that the 140 year record includes anything in the count where the only indication was indirect, such as long period swell. BTW there are extra tropical events well capable of producing a similar effect. You said you’ve sailed on the Pacific, you know what I am talking about.
26. definitely.
Steve S, Ive read old ships logs – I once owned a set that I later donated to a maritime museum.. Indicatins such as a long period swell from an unsusual direction were carefuly noted as indicating possible storms. Staying out of such things was a vital part of staying alive, hurricane seasons and locations were well known,a nd ships in seasons and areas ttha twer a risk paid very close attention. It was their business to do so.
I was once in the trades on the way to Hawaii when there was a tropical storm / borderline hurricane south of us. The long periods swell from the south, substantially longer period than the trade swells, was very noticeable and unique.
Remember also that the waters in which the atlantic has hurricanes were well traveled by naval vesssels – and naval vessels were (and still are) extraordinarily anal about noting adn reporting such things.
RE: #29 – I’ve read them too. My point is, just because a ship’s log (or even a few of them) may have alluded to the typical warning signs / warning waves, I doubt that, lacking other more specific records of actual direct enounters or meterological records (extreme low pressures, wind field records, significant wave heights, etc), these sorts of logs alone would have resulted in a hurricane being counted in those pre 1900 records. I guess that is an important question that needs to be answered – just what, specifically, is the operational definition of a hurricane in the pre 1900 data used for that time series? Yet another case where “show me the data” rings true.
First, thank you Ken Robinson. People who make data available are fellow co-conspirators are good scientists, model citizens, and generally helpful souls.
Second, I haven’t read Dr. Cury’s paper (I searched for statistical results and finding nothing in the standard summary left the paper unread). My comments here only refer to the data that Ken kindly provided.
Third, I repeat an earlier caveat: searching for trends in problematic (in both the modern and old fashioned used of the term). But that said, I went ahead and offer these comments.
With regard to regression without accounting for serial correlation:
Grouping the hurricane frequency in groups of 4 years is, while unnecessarily reducing the degrees of freedom, NOT the issue in the trend estimation. Running the regression from 1851 to 2005 on ungrouped annual frequency data gives a trend slope of 0.036 more storms per year. (This is significant in the context of that regression, but that regression shouldn’t really be used for trend analysis.) Running the same regression for the post 1969 data gives a slope of 0.21 more storms per year — illustrating the importance of the last period. Doing the same two regressions with grouped data ending with 2005 gives essentially the same slopes.
Regression (increase in # hurricanes per year)
Annual 1851-2005 0.036
Grouped 1851-2005 0.036
Annual 1970-2005 0.214
Grouped 1970-2005 0.209
The effect is all from the reduction in the pre 1970 sample where the slope is about 0.027. If that is period to which she speaks, then the data organization is not the issue. (Regarding the effect of the last two years, it is significant: the 1970-2003 slope is 0.137, or 35% lower although still much higher than the pre 1970 period.)
With regard to regression accounting for serial correlation
First if the data is grouped, the number of observations is sufficiently reduced that there is no significance to the trend estimation. With regard to the annual data, the hurricane frequency appears to fit an ARMA(2,2) fairly well, and this form gives a significant trend estimate of 0.037, essentially the same as the naàÆà⮶e form. However, for the post 1969 data, the estimation falls apart, and no significant trend can be concluded (the estimate is a very large 0.7 but the standard error is an even larger 0.9). Looking at first difference in that period produces the same inconclusive results. Also to the extent that it bears, there is a positive trend in Total Annual Dissipated Power, using a ARMA(1,1) model, of about 0.5% per year, which has a 0.09 significance (i.e. just significant at the 10% level, a level usually not considered as “significant” for academic results).
Now all these estimates are conditionally on the time series model I used being correct or nearly so. Timothy Vogelsang, who has been mentioned in these pages before, has given us a much wider test of significance of time trends. The trends need not be linear and the time series model need not be a specific form or ARMA or ARIMA. I took the data and ran Vogelsang’s DAN (for “Daniell kernel nonparametric zero frequency spectral density estimator” — yeah, I only have a rough idea of how it works) and PS tests (from “Trend Hypothesis Testing in the Presence of Serial Correlation” Econometricia, 1998) . Both tests are based on estimates of the covariance matrix (or the regression estimates) that account for heteroskedasticity [non-constant variances over the time period] and autocorrelations — the so-called “HAC” estimates. The following table gives the test results, significance levels and critical (absolute) values for the significance level.
critical values for t-DAN 95% 97.5% 99%
t-DAN critical values: 1.710 2.052 2.462
hurricane frequency: 3.527 3.076 2.534
PDI/storm: -0.069 -0.065 -0.059
Total Dis. Power: 2.203 1.933 1.607
critical values for t-PS 95% 97.5% 99%
t-PS critical values: 1.720 2.152 2.647
hurricane frequency: 2.180 2.011 1.738
PDI/storm: 0.185 0.178 0.166
Total Dis. Power: 1.375 1.273 1.107
(Estimates for the 1851 to 2005 period)
You can see that there is estimate of a significant trend for hurricane frequency (the trend is expressed as a ninth order polynomial for which we may be better off using the linear approximation), clearly none for storm intensity and a questionable significance (yes for the DAN but no for the PS) total power.
Where this vindicates or contradicts (or a little of both) Dr. Cury’s conclusions, I leave to you.
Re 19, further analysis reveals that the number of hurricanes does follow a Poisson distribution … but it is a “fat-tailed” one, even without the 2005 data.
In other words, there are more years with less hurricanes than expected, and more years with more hurricanes than expected, than you’d predict.
What is it about climate, that it tends to extremes? My own guess is that the climate tends to be multistable, rather than random … your mileage may vary …
The actual distribution looks more like a two-humped camel, with peaks at about 6 and 11 hurricanes/year … which inspires me to go calculate … hang on a second …
OK, back again, thanks for waiting. The best match is to an average of two poisson distributions, one with a mean of 6.5, and one with a mean of 10.3 …
w.
RE: #32 – Fascinating. Almost as if, there are two distinct regimes, one of which favors TC formation. Sort of ENSOesque, in an odd sort of way.
RE #7 I will look at the number of storms which made landfall in the U.S., from 1855 to 2005, by 5 year intervals, and post it here, if my kids give me a break tonight.
I think the results will be interesting.
Re 34, been there, done that, data at http://www.aoml.noaa.gov/hrd/hurdat/ushurrlist.htm. Here’s the breakdown of landfalling hurricanes.
Year Count
1851 , 2
1852 , 4
1853 , 1
1854 , 3
1855 , 1
1856 , 2
1857 , 1
1858 , 1
1859 , 1
1860 , 3
1861 , 3
1862 , 0
1863 , 0
1864 , 0
1865 , 2
1866 , 1
1867 , 2
1868 , 0
1869 , 4
1870 , 3
1871 , 3
1872 , 0
1873 , 2
1874 , 1
1875 , 1
1876 , 2
1877 , 2
1878 , 2
1879 , 3
1880 , 4
1881 , 2
1882 , 3
1883 , 1
1884 , 0
1885 , 1
1886 , 7
1887 , 4
1888 , 4
1889 , 1
1890 , 0
1891 , 2
1892 , 0
1893 , 5
1894 , 2
1895 , 1
1896 , 3
1897 , 1
1898 , 3
1899 , 3
1900 , 1
1901 , 2
1902 , 0
1903 , 2
1904 , 2
1905 , 0
1906 , 4
1907 , 0
1908 , 2
1909 , 5
1910 , 2
1911 , 2
1912 , 2
1913 , 3
1914 , 0
1915 , 3
1916 , 6
1917 , 1
1918 , 1
1919 , 1
1920 , 2
1921 , 2
1922 , 0
1923 , 1
1924 , 2
1925 , 1
1926 , 3
1927 , 0
1928 , 2
1929 , 2
1930 , 0
1931 , 0
1932 , 2
1933 , 5
1934 , 2
1935 , 2
1936 , 3
1937 , 0
1938 , 2
1939 , 1
1940 , 2
1941 , 2
1942 , 2
1943 , 1
1944 , 3
1945 , 3
1946 , 1
1947 , 3
1948 , 3
1949 , 3
1950 , 3
1951 , 0
1952 , 1
1953 , 3
1954 , 3
1955 , 3
1956 , 1
1957 , 1
1958 , 0
1959 , 3
1960 , 2
1961 , 1
1962 , 0
1963 , 1
1964 , 4
1965 , 1
1966 , 2
1967 , 1
1968 , 1
1969 , 2
1970 , 1
1971 , 3
1972 , 1
1973 , 0
1974 , 1
1975 , 1
1976 , 1
1977 , 1
1978 , 0
1979 , 3
1980 , 1
1981 , 0
1982 , 0
1983 , 1
1984 , 1
1985 , 6
1986 , 2
1987 , 1
1988 , 1
1989 , 3
1990 , 0
1991 , 1
1992 , 1
1993 , 1
1994 , 0
1995 , 2
1996 , 2
1997 , 1
1998 , 3
1999 , 3
2000 , 0
2001 , 0
2002 , 1
2003 , 2
2004 , 6
2005 , 6
#35. The record year was 1886. Given that the 19th century was colder than at present, it seems weird that there should have been so many landfall hurricanes back then.
A trial of graphics …
We’ll see if it works
w.
Dang … tie me kangaroo down …
w.
The folks who study hurricanes for a living think the attempts by some to link storm activity to AGW are pretty bogus. Check out William Gray’s work. There is a nice paper here by Klotzbach: (http://meteo.lcd.lu/globalwarming/Klotzbach/trends_in_tropical_cyclone_activity_2006.pdf), which shows pretty convincingly that there is not a significant increasing trend in tropical cyclone activity, at least over the last 20 years. I think its pretty clear that the GW alarmists are trying to draw straight lines along any upward turn of a cycle they can find to support their end-of-life-as-we-know-it predictions (be very worried).
Let me add a couple other graphics to the site …
This shows the power dissipated annually by hurricanes in the North Atlantic. Note the cyclical nature of the power dissipation. That’s why I was curious about why Emanuel only showed the results post 1950.
This shows the power dissipation of the individual storms. As you can see, there is no particular trend to the strength of the storms over time.
w.
No particular trend in landfalling hurricanes either. I get a downward trend of -0.00196 hurricanes/year with a standard deviation of 0.00261.
You would expect the land-falling hurricane data to be a much more accurate representation of the facts given many storms in the middle of the Atlantic may have been missed in the early years of the record.
I can not think of a reason (logical or climate-specific) that would indicate land-fall is not the best measure (the only one might be that more hurricanes avoid land when it is warmer which makes no sense whatsoever.)
Hence, I conclude the global warmers are completely full of it when they conclude there is increasing hurricane frequency.
So say we all? Now post it at RealClimate and watch the sparks fly.
Re 32 and 35
The distribution of landfall hurricanes looks more like a binomial of 10-15 trails with probabilities .2 -.1 range. Dies out a little slower but the hurricane count has the classical binomial pattern.
What little I understand of the physics of hurricanes argues that it should be a poisson, but poissons don’t produce the shape of the hurricane count — not enough zeros.
I posted before Willis’ latest graphs. This is data that has never been shown before. I think this really needs to make it into the record somewhere where it will be seen and appreciated by more people (than us.)
Re #22 & 24,
More eyes or better eyes would make for more found storms and stronger storms at least when eyes are initially few or poor or both. It is obvious that we should expect storm frequency and strength to show increases over time as population and technology increase up to a point. Now if we saw a decline in storm strength and or numbers we’d have good reason to suspect it real as the trend is for more eyes and better eyes.
So with this adjustment does any sort of trend rise out of the noise say at 95% confidence? What do these sort of plots look like with no real storm trend but changes in the number of observers and or their skill over time? Does this in any way match the historic record?
#43 A binomial distribution with that many trials is pretty close to a Gaussian distribution.
http://mathworld.wolfram.com/BinomialDistribution.html
Filtered distributions tend to Gaussian by the central limit theorem. So if we apply a low pas filter to a poison distribution it should start to look Gaussian. Perhaps if the time constant of the filter isn’t that long it looks more binomial then Gaussian. Just guessing.
Actually, I just thought of the mathematics further. Say you choose a short enough time interval that the probability of one hurricane being created in that time interval is 1/p and the probability of two hurricanes being created in that time interval is vanishingly small. Then you can take n multiples of that time interval and apply the binomial distribution to find out roughly how many hurricanes you get in n multiples of that time interval. The Gaussian distribution is obtained by letting the multiples of the time interval get arbitrarily large well the poison distribution is obtained by letting the time interval get arbitrarily small.
So we are seeing no power increase or frequency increase of storms or hurricanes. Have we looked at rainfall yet? Wills mentioned how the tropics stay at the same temperature because of increased evaporation. Well, if that is true there must be more rain even if not more storms or fiercer storms. Could it be that if we count sun showers that the results will be different. Could it be that there is more evaporation but less convection? Could night time condensation explain the cycle? What keeps tropical water temperature constant.
RE: #48 – an interesting thing to test would be the total energy flux at / through the tropopause owing the tropical thunderstorms. The major components would seem to be plain old heat flow and work done by air movement at that interface. Once energy is out of the troposphere, it is out of play for the purposes of this particular test case. Imagine the energy sink that might be in play.
Re #45,
In the 2nd line I was thinking “observed storm frequency and strength” and left out the “observed” :(. It doesn’t read well the way I wrote it. All old hat anyway.
ATLANTIC HURRICANE DISTRIBUTIONS
First, the landfalling hurricanes …
Pretty clearly Poisson. Next, all Atlantic hurricanes …
This is the one that seemed like a split distribution. I have shown a simple Poisson, as well as a mean of two Poisson distributions.
w.
For the distribution of all Atlantic hurricanes fit it to a Gaussian or binomial distribution. I bet the fit will look pretty much the same as the poison fit. In math world we see that the poison distribution like the Gaussian distribution can be derived by the binomial distribution. Look how symmetric the poison distribution is when the mean is that large. If you do a box car average over two or three years it should look even more Guasian.
http://mathworld.wolfram.com/BinomialDistribution.html
Maybe we should generalize this and say that a poison distribution with a large mean is equivalent to a Gaussian distribution where the mean is equal to the variance. This is nice because it lets us know the noise which is a luxury that we don’t always have in statistics.
Jeez, imagine how important all of these conclusions would be if they were based on valid data or were in any comparable to the work of Emanuel or the Webster group. Below I’ve pasted a couple of RC comments from a hurricane scientist listing some (but by no means all) of the data interpretation problems. Note that he’s perfectly willing to hold the Webster group’s feet to the fire where he think it appropriate. The point is that you guys will never have much to show for all of the lovely work above; i.e. GIGO.
First comment:
I must admit I’m a little disappointed in the discussion of Table 1 in the Curry et al. paper. They don’t discuss the data quality issue for the 1945-1955 era at al. From HURDAT, the number of US landfalling hurricanes is the same in both periods (26) and the number of category-3 or greater US landfalling hurricanes is the same (10). As a result, in the 1995-2005 record, 40% of all North Atlantic hurricanes reached category 3 status (45 of 112). 55% (41 of 74) did so in 1945-1955. If we break it down by US landfall vs. non US landfall, we get
1945-1955 (US) 10 of 26 hurricanes were major (38%)
1945-1955 (Non-US) 31 of 48 (65%)
1995-2005 (US) 10 of 26 (38%)
1995-2005 (Non-US) 35 of 86 (41%)
Now, it’s possible that hurricanes away from the US became less likely to reach Cat 3 or higher in the last decade compared to the period 50 years before, but that seems unlikely to me, at least, and I think would be inconsistent with the Webster et al. work.
There is a large change in the location of identified “things” in HURDAT between the two periods. Looking at the first time something is identified in HURDAT, there are only 20 tropical entities identified east of 50 W that move west to at least 60 W in the 1945-1955 period and 5 that never move west of 60 W. In contrast, there are 35 and 20, respectively, in 1995-2005. In total, there were 30 more features in the eastern part of the tropical Atlantic. It’s possible that there’s a physical change, but the data quality concerns should have been addressed.
I don’t find Curry et al.’s final bullet point on p. 1032 convincing at all. A lot of the difference has to do with the observational capabilities.
Second comment:
You can’t just plot the number of tropical storms per year without considering the inhomogeneities in the data. The Hurricane Research Division cautions against doing climatological studies of even the US landfalling data prior to 1900 in most of Florida, for instance. After that, there were large changes in data collection, most notably recon flights starting in the mid-1940s.
Even in the recon flight era, some significant changes occur. If you look at the location of maximum intensity for each storm in the HURDAT database, since ~1962, the fraction of storms reaching their maximum intensity east of 60 W has been 0.6. Prior to that, it’s 0.8. It’s possible that there was an abrupt change in behavior then, but it’s also likely that changes in observational strategy took place. One hypothesis would be that the westernmost storms have been relatively consistently observed for a long time, but that the easternmost ones haven’t. If so, that would increase the number of storms in the mid-40s to early 60s by about 30%, compared to the official record. I’ve already noted in this thread (#23) that there are differences in the database around 1950 compared to now-Atlantic storms that don’t make landfall are much less likely to be rated Cat 3 or higher than they were 50-60 years ago.
It’s important to know the limitations of the observational data sets for events that depend on special efforts to collect the observations, such as tropical storms. For instance, even today, in the absence of recon flights, different groups will get different intensity estimates. At one point during Cyclone Monica’s life near Australia this year, the US Naval Research Lab estimated the central pressure at 879 mb, associated with winds of 180 mph, while the Australian Bureau of Meteorology had it at 915 mb at the same time (Jeff Masters’s blog). Both groups were using mostly satellite information at the time. I have no idea what truth is in that case.
So what are you saying? On real climate they say the data is not good but they still want to make conclusions from it? Or are they saying you must be a member of the hockey stick team to interpret it the right way?
Re#53
For a moment I thought you were going to go on and refer to Tree Rings, Ice Boreholes, or….well all the climate proxies.
Re #54: Ah, so all climate scientists are part of the hockey stick team. Well, that is a very, very large conspiracy. Good luck with your continued efforts to uncover it.
Re #55: For a moment I thought you were paying attention, then I realized you thought *I* had said something that was clearly identified as a quote from someone else. But your comment does feed right back into the point made in #54, doesn’t it?
re: #53
This seems to me to be just what has been discussed here. That in the past not as many of the small hurricanes were discovered. That is, only the strong non-US-landing were noticed accurately while half of the weak ones were missed.
Re #57: Dave, it is exceedingly unlikely that any Atlantic storms were missed that recently. The issue is whether their intensities were accurately recorded.
#56 I said a subset of them is playing for the same teem, I didn’t say they have an effective coach. Mann I tell you is quite the puck hog.
To clarify, Steve B (#53) was quoting comments made by Harold Brooks (in the comments section) at RC. They were comments by a guest, not a moderator. And it looks like people think Steve B said all that. Brooks is at the National Severe Storms Laboratory (NSSL), and has among his many publications, co-authorship of two papers that set the current standard for US tornado and nontornadic severe thunderstorm climatologies (or “climatographies”). Both of those papers deal extensively with data problems in both time and space. It is a matter of fact in climatology, that when recording and reporting procedures change, the data change too. So, I think what Steve B is getting at, is while Willis has put in a lot of effort here, you can’t just start building your conclusions from his output. You first have to address the problems mentioned in the Brooks comments (among others). That would take much more time and effort than is needed to make the plots.
#60 it is funny you say that because I don’t see any kinks in the plots. Where oh where can the hockey stick be.
61: If it’s funny, then it’s funny because it’s true. Are you saying you do not believe the comments about inhomogeneities because the plots don’t reveal kinks?
Of course. If the new methods changed the data significantly shouldn’t see it?
re: #58
And why would the old ones both be rarer and more powerful on average while there’s a bunch more hurricanes recently but they’re weaker (as long as they don’t run into the US?) That certainly doesn’t sound like GW causing stronger hurricanes.
Re#60
The point I was trying to make was that the problems with data selection are applicable to many of the climate proxies. Bloom is trying to devalue the conclusions above for reasons which he fails to apply to studies which are favourable to the warmers.
RE#53
Exactly Mr Bloom. Please apply these thoughts to papers which use Bristlecones and other dodgy proxies for temperature as their basis.
Kenneth, it is quite clear that my work is not the last word. I am aware that the data has issues. However, I have used the best data to hand, which is the NOAA Hurdat reanalysis data. They’ve removed all of the inhomogeneities that they know about …
My point is that, once again, the AGW folks are into the INCREASED DESTRUCTIVENESS, EVERYBODY PANIC mode. In fact, the changes are so subtle that it takes very careful analysis and reanalysis to even determine if a trend exists …
I am under no illusions that my analysis will settle the hurricane question. I put it out there to highlight that if there is a trend … there’s not much of one.
w.
63:
You might not be able to “see” the inhomogeneities, which is exactly why you should try to get a handle on the nature of the data, before you analyze them.
Re #66: Willis, the HURDAT site says their data still has problems; i.e., they haven’t removed the inhomogeneities. Even the satellite-period data has remaining consistency problems.
Both the Emanuel and Webster group data are available, which I pointed out on the other thread before everyone went galloping off on this pointless tangent.
Willis,
Here is a little background Emanuel’s position within the hurricane/GW debate.
Re 68 … Steve Bloom, perhaps you could point to a climate dataset that doesn’t have problems? … My point is simply that generally we work with the best data we have, which of course is always subject to revision.
What is unusual about Emanuel’s work is that he has picked the data he likes, and thrown out the rest. Perhaps, while you’re finding a problem-free climate dataset, you could also find an example of someone other than Emanuel working with half a dataset …
w.
Re #71: Willis, working with tropical cyclone data in particular isn’t easy. It’s a full-time job for a number of people just now.
Regarding Emanuel, bear in mind that only the North Atlantic basin has much data at all prior to 1950, so global comparisons cease to be possible prior to that. He did back up his North Atlantic analysis to 1930 in response to criticisms tha he had cherry-picked the 1950 start date; see part 5(6) of his essay for the results. Adjacent parts of the essay have a lot of other discussion of data issues.
(Kenneth, thanks for pointing out Kerry’s skeptical background.)
Steve Bloom, could you answer #54?
Thanks
Re #34: A quick look at the number of hurricane landfalls reveals nothing but white noise. No trends; no time series structure (and particularly no LTP; might be something at lag 14 years, though likely not). Are we confident that this dataset is legit? It seems remarkable to me that it should be so uninteresting.
The Hurdat series (take a look at the data) took a great deal of resources (staff, time and money) to put together. Thousands of ship records, local small town weather records, and hundreds of other sources would have been researched. This is the best dataset you will get.
I’ve seen some other reports that go back to the 1500s etc. where it is noted that many Spanish gallions were sunk in periods where it is assumed that hurricane intensity was probably higher than today, but Hurdat is as good as it gets.
Nevertheless, this data shows the global warmers have been feeding everyone another line of garbage. They are producing “data selection” studies and pressuring the weather forecasters and even the National Hurricane Centre to conclude hurricane intensity is increasing because of global warming. The (good) data does not support those conclusions (once again.) And yes, Steve Bloom, you are one of those people trying to distort the record.
Yesterday, RealClimate posted up a poll which showed 71% of the public believe hurricanes are increasing because of global warming. I absoluted hate it when people are misled over something which can very simply be shown to be true or not. This is very cut and dried. Misleading people is deliberate here.
The data being discussed are just for Atlantic hurricanes. What about Pacific storms? What’s their frequency and PDI? Do the numbers reflect the ENSO cycles? If its a global energy budget in question, then leaving the Pacific out is rather like ignoring night-time temperatures.
Just as I side not if my memory of statistics is correct I think the average power of hurricane’s should be roughly a gamma distribution. I’ll have to look this one up but if memory serves correctly a gamma distribution is a continuous extension of a poison distribution.
RE: #58 – You are showing a slight inkling of understanding regarding why your earlier finger counting analogy is way off. There are definite measurement system errors possible when attempting to assemble a hurricane related metric. Firstly, mere detection becomes more and more of an issue the further into the past one samples. Secondly, the issues regarding stratification / classification of intensity is a generic issue pertinent until very recent times.
I have a small statistics question with regard to the landfalling hurricane database.
My recollection is that I have seen a plot of time vs “C”, where “C”, for each year, is the cumulative number of storms above or below some average value. For instance, if there were 4 landfalling cyclones in 1906, and the average was 3, then the data point for 1906 would be 1 point higher than 1905.
My recollection is that this tends to show a rise and fall of cumulative storms, with perhaps 20 or 30 years of a rising total and 20 or 30 years of a falling total, sort of multi-decadal cycles.
Anyway, I have not plotted the data, so i don’t know if this is what a plot would show, but I am curious as to whether this cumulative technique can give valid information from data.
Thanks
This multi-decadal cycle, btw, is the North Atlantic Oscillation.
Yes, it can provide valid information, but it is subject to the same problems as looking at totals. Your method requires estimating a mean with insufficient data, and subtracting the mean from the totals. The same information is there, however, whether you look at totals or differences from the mean.
Mark
Bloom: are you not essentially saying that, since there is so much uncertainty in the hurricane data, we can draw NO conclusions from the data? LOL.
Re #79 Thanks, Mark.
When I look at the plot in #37 of landfalling hurricane count, I see no rise and fall. (When I look at power dissipation, I see a rise and fall, by the way). I’ll plot the cumulative numbers tonight and see if I get the trendless plot like in #37, or a rise and fall. If the information content is the same, then I should see a trendless plot.
Re #77: That argument was over whether there was some inaccuracy in the total count of hurricanes during the satellite observation era. There still isn’t.
RE: #82 – not entirely. It was also about the classification of them. Measurement system error is definitely a factor influencing classification.
I remember reading somewhere on this blog that the AGW hypothesis predicts LESS hurricane intensity, because of a smaller delta T/delta latitude. If this is so, the AGW priests here are arguing both ways!
re 84:
yes, jae, I suspect it is corect that you read that here.
Re: 71 Steve Bloom
It seems that you are saying that the Hong Kong Observatory (founded 1883) and the Japan Meteorological Agency (founded 1875) contributed no significant data on tropical cyclones in their first 70 years.
Re: #76 John, the Poisson and Gamma distributions are linked through the Poisson Process. The number of arrivals by a given time is distributed Poisson (a discrete distribution); arrival and interarrival times are distributed Gamma (a continuous distribution). That may be what you’re remembering. Of course, the Central Limit Theorem guarantees that the distributions converge to Gaussian as time/count gets large.
Re 87, say what? Is it true that the Poisson distribution converges to Gaussian as N increases? Seems unlikely, since the Poisson distribution can’t handle negative numbers (there is no such thing as minus 3 people arriving per hour), and thus is inherently asymetrical …
w.
Re #86: I was quotng Emanuel on that. I’m speculating, but I think the reason may be the relative lack of observations from the area of origin in the Pacific. I’m sure you’re right that there would be plenty of data from the landfall zones.
Are Willis and Bender using the right raw-data? Yes or No? Yes.Or.No?
If no, what IS the right raw-data, and what would the graphs posted by Willis and Bender THEN look like (using their statistical methods)?
If yes, it’s obvious that, at this point in time, nothing meaningful can be concluded about possible connections between AGW and hurricanes. Case closed. Move on.
As I see it, Steve Bloom is in some marvellous way trying to have it both ways. When we were flooded whit papers speculation that possible connections between AGW and hurricanes were starting to show, Steve Bloom certainly didn’t questioned those speculations on basis of poor underlying data / raw data. Nor did the mass media, by the way. Now, when someone subjects the raw data to nothing but standard statistics, and gets no trends at all, he’s suddenly channelling the argument that “For instance, even today, in the absence of recon flights, different groups will get different intensity estimates”. I agree. Buy why didn’t he open up that discussion a year ago?
As a student, postgrad, employee and employer, the principle has always been:
1. Plot the raw data.
2. Plot the modified raw data, and tell exactly how, and why, the modified raw data were made.
3. Plot the processed raw data, and describe exactly the method used, and why that method was chosen.
Then everyone is able in a clear and concise way to evaluate any conclusions made, and also to pinpoint were disagreements might arise from.
#87 Correction: “count/time” was intended to mean “count or time” (not “count divided by time”, which converges to a constant known as the arrival rate).
#88 Willis, sorry about the confusion. Without getting too precise about what we mean (the general topic, modes of convergence, consumes several weeks of a graduate level probability class), because both distributions have finite moments (i.e. mean, variance, skew, kurtosis,…, etc.), they both “converge” to Gaussian in the sense that the moments of (Sum(Xi-E[X])/(Sqrt[N*Var[X]]) converge to the standard normal moments (whic are 0,1,0,3,0,15,…, etc.). (There are other types of convergence; see previous cite). There is one more leap here: The reason we can apply the Central Limit Theorem is because each of the interarrival times are independent Gammas. Therefore the arrival time of the k-th event is just the sum of k Gammas. Therefore it converges to Gaussian by the the Central Limit Theorem. A similar argument applies as to why the count also converges to Gaussian.
Thanks, TAC, but it doesn’t answer my question — does the distribution, which is Poisson for small numbers, converge to Gaussian for large numbers as you said in # 87?
w.
#93 I’m going to try and prove this later but I see why it is not obvious. I am looking at the Sterling approximation:
http://ece-www.colorado.edu/~bart/book/stirling.htm
and the posion distribution:
http://mathworld.wolfram.com/PoissonDistribution.html
If I make the sterling approximation to the poison distribution then differentiate with respect to n, a Gaussian distribution doesn’t jump out at me. I think the next step would be a change of variables where we want to replace n with (x-mu)/sqrt(mu) and we would do this by knowing that the probability density function is an integrand thus our rules of substation for integration would apply. I think the resulting expression wouldn’t look Gaussian so the best we could do is show that all of the central moments or Taylor series coefficients converge to those of a Gaussian as N gets large.
When I was assigned to the Joint Typhoon Warning Center during the 80s, we used the Dvorak Method for intensity estimations and classifications. The Northwest Pacific was too big, and the number of Typhoons, tropical storms and depressions too high for air recon only. The DOD has used DMSP and NOAA polar orbiting satellites for decades for tracking tropical systems. Most of the tropical storms in the Western Pacific are derived from the Objective Dvorak Technique (ODT) I would expect a spike in the number of global tropical events beginning in the mid 60s. It would be interesting to see a combined global study on tropical storms and above since 1976. I say tropical storms because this would include the lower intensity storms which for whatever reasons never fully developed. I would think researchers would be interested in the total number of tropical storms and not just the Hurricanes.
Here’s are a few links detailing the Objective Dvorak Technique
http://tinyurl.com/k3tnx
http://tinyurl.com/hnzsl
”
the US Naval Research Lab estimated the central pressure at 879 mb, associated with winds of 180 mph, while the Australian Bureau of Meteorology had it at 915 mb at the same time (Jeff Masters’s blog). Both groups were using mostly satellite information at the time. I have no idea what truth is in that case”
Steve,
Both agencies were probably using the Dvorak method which I cited earlier. There is a large room for error if you don’t know what you are doing. As I said earlier, most tropical storms in the Pacific have derived intensities using Dvorak. From my own expierence, this method isn’t error proof, and it takes at least 2 full storm seasons to get good at it.
The NOAA Hurdat reanalysis data was discussed above. I’ve been working with this data (downloaded last September from here [warning: very large file]) and have found some errors/omissions, particularly in 1915. If anyone has been using this data and/or wants to see what I’ve got, let me know here.
#93 and #94 I think I now see the source of confusion, and I apologize for my lack of precision in #87. The correct statement is that for large values of its parameter (usually denoted , which is equal to the expected number of arrivals (not the number itself; mea culpa)) the Poisson distribution converges to the Gaussian. Specifically, if X is a Poisson variate with parameter
  , then (if the value of
  is sufficiently large)
  will be approximately standard normal.
Re #90: The data used by the Webster group and Emanuel are available on their websites, plus I think there’s a new reanalysis from NCEP/NCAR that is getting used more recently. Unlike HURDAT, to my knowledge none of these are available in easy spreadsheet format, and bender and Willis wanted results in an hour or two.
Re #95: Is the Dvorak technique (as) accurate for TSs, and what about TDs?
Re #97: I had the impression from the documentation that they had only updated the reanalysis through 1910, although possibly it’s the documentation that’s out of date. From what you can see, how far have they gotten?
Steve Bloom #53
You have inadvertently come up with a slogan for this site
“Conclusions based on valid data”
You also provide
“Data interpretation problems”
You looked at the graph and thought”This can’t be right”
So gratifying to see the reversal in Bloom’s point of view, based on an objective analysis of the data and a sober consideration of statistical and methodological uncertainties. Maybe he is a gem after all. (You guys are all doing a great job with these data. Keep it up.)
bender on vacation
#99
Steve,
Most of the info concerning weaker tropical “distrubances” come by way of satellite analysis. Overall, this technique is very subjective, and without additional “hard” information (air recon, and surface observations), I would take this information with a grain of salt. Your previous example concerning the Austrailian Typhoon is a good case in point.
Re #102: Apparently for some people denial is just a river in Egypt. See, bender, I’m not qualified to critique your tree-ring stuff, but I have to seriously question it given the way you approached this hurricane discussion.
Lots of interesting, technical discussion going on in this thread, so I’m here to lower the tone a little bit…
Just for a bit of fun*, I copied out some of the data above and generated a few plots. I’ve done some manipulation of the data according to a set of rules made up by me, and produced some hockey-stick shaped graphs. I’ve also turned the axis labelling off so it isn’t (completely) obvious what I’ve done. Anyone take a stab at what rules I’ve applied? Here’s a clue: it has nothing whatever to do with eccentric PCA.
*NB: OK perhaps “fun” was the wrong word
Graph 1:
Graph 2:
Graph 3 (cheated a little here):
I don’t have time to do hurricanes right now although I hope to come back to this at some time. The differences between the middle and bottom panel look a lot like an adjustment that you see in tree ring chronologies though when you apply negative exponential age adjustments. If some kind of declining trend or negative exponential is fit to the middle series and the "anomalies" taken from that, you’ll get something like the bottom series, which accentuates the 20th century. This is embedded in tree ring raw data. Cook and Peters 1997 pointed to potential problems resulting from this citing two particular examples which proved to be somewhat prophetic – Campito Mountain from Mann’s PC1 and Gaspe.
Steve, my playing above isn’t particularly serious or contain any deep statistical insights – so I wouldn’t spend too much time on it! However, you’re a little wide of the mark… the answer is much simpler than that.
Anyone of the other commentators on this thread interested in having a guess?
Spense, I’d guess it’s just the first difference scaled to match them.
Interesting idea Dave, but not quite right..
I’ll post up what I did tomorrow if nobody guesses it.
I suppose I need to offer a prize for guessing right… I’ll buy anyone who guesses correctly a beer, but they’ll have to come over to the UK to get it! 🙂
Re #104 Have you added the detrended annual data back onto the trend of a filtered ‘low frequency’
component -I fear that your pint is safe!
Wow, I just spotted this, unfortunately no time to really digest right now or respond at any length. For plots of the North Atlantic HURDAT data since 1851 using a 11 year running mean, see my congressional testimony at:
Click to access GT%20-%20Curry%20Testimony.pdf
A trend isn’t meaningful through this data owing to nonlinear variation in global forcing as well as the AMO. Looking at the NATL plots, you can see my rationale for comparing ca 1950 with the last 10 years
For a serious statistical analysis of the global hurricane data since 1970, see hoyos et al. science paper
http://www.sciencemag.org/cgi/content/abstract/312/5770/94
and on Webster’s web site if you are not a subscriber to science
http://webster.eas.gatech.edu/onlinepapers.html
Note, the U.S. landfalling data is very confusing, since HURDAT may include multiple landfalls. Also, the U.S. landfalling data shows little correlation with total NATL stats, can’t really be used to infer anything about AGW or causes of basin or global hurricane/TS stats (this is discussed in BAMS article)
The situation with data quality is very frustrating; the NATL time series back to 1851 is discussed in testimony. Outside the NATL, the data quality is quite uncertain, and prior to satellite there is little useful data outside the the NATL
Judy Curry
Re #109
Thanks for the reply Chas, your second comment is correct – it seems the pint is safe!
#110 looking at the paper in your first link it looks like the number of named storms is increasing significantly but not the number of hurricanes. What are the criteria for naming storms? Have we started naming a greater percentage of the storms? If so why should we conclude anything from these graphs?
I don’t see how anyone compiling a database could make such an error. It would be like saying Katrina is 2 hurricanes, one in Florida and one in Louisiana. Just a little thought would lead one to conclude that, given only the dates and positions, they are so close that it is one hurricane.
Where is there an example of a possible multiple count? It must be rather rare, I would think, if the data compiler was doing his job properly.
And to just follow up on my last message, for 1852 to 1930, there are only 86 pairs of landfalls that one would need to check to see if a single hurricane was counted twice. It would take only a few hours, at most, to do the data quality check.
Even if 10% of the 86 were double counts, it doesn’t effect things very much.
Re 112: the distribution of tropical cyclones is changing. we are seeing an increase in the number of tropical storms, and also an increase in the most intense storms. my understanding of this is that the increased number of TS is associated with longer season length (lots of TS in late fall, but no hurricanes) and mor cat45 associated with increased SST during peak season (sept)
My understanding of the NATL data quality: Since 1900, the total number of named storms is the most accurate number (relies least on any intensity measure). Prior to 1900 the number of hurricanes is most reliable (apparently some tropical storms were missed in the 19th century; if you do the ratio of hurricanes to total named storms, the 10 yr averages since 1900 are remarkably constant, but increase significantly in 19th century, suggesting missed tropical storms).
Re dip ca. 1915. at first i thought this was due to missed storms, but when you plot total named storms against NATL SST, they track each other almost uncannily, so the dip ca. 1915 (at least in a 10 year average sense) seems assoc with cool SST. Would appreciate any further insights on the year 1915 that someone mentioned in a previous post?
Re #113 and the landfalling stats: we have counted up to 9 landfalls for an individual storm, and even storms crossing florida get counted as 2 land falls since they cross both the east and west coast. We’ve had to go back and look at every track to try sort out “one storm, one landfall”.
The tropical cyclone data really is rather a mess, the NATL is definitely the most reliable, so I am focusing on that data set (with all its warts) until the global satellite data is reprocessed and reanalyzed. This has already been done back to 1983 (paper in review), they should be able to go back to 1977 with alot of hard work, then before 1977 it will be a bit dodgy since it is not clear what kind of shape some of that data is actually in. The problem is that until very recently, people have not been using the hurricane data as a climate data record (mainly used for regional damage estimates etc), so there hasn’t been much incentive until recently to try to get this data in shape.
How could that be when the maximum recorded number of US landfalls is 7 in 1886?
For 1851 to 2005, there are a total of 244 US landfalls. The trend in landfalls is -0.00196 hurricanes/year with a standard deviation of 0.00261. Following my suggestion in comment #114 and eliminating 8 hurricanes, one each in 1851, 1861, 1871, 1881, 1891, 1901, 1911, and 1921, and re-doing the regression gives -0.00087 hurricanes/year with a standard deviation of 0.00262.
In both cases, there is no significant trend. One would think that the number of US landfalling hurricanes would be a fairly homogeneous time series since the events are large and the counts are easy to do.
I found the comment about increased hurricanes seasons resulting in more tropical storms interesting. I am not sure why it doesn’t result in more hurricanes. It would be interesting to plot hurricanes per time against parameters like water temperature, surface air temperature, high altitude air temperature and see if we can see any obvious relationships. Although hurricanes don’t seem to correlate well with temperature there is at least a range of temperatures that we know we are more likely to get hurricanes in.
Re #110 – In your presentation, you indicate that Knutson et al (2006) specifically attributed the increase in global tropical sea surface temperatures to greenhouse warming(and therefore the increase in hurricanes)
Can you clarify if this was scientifically measured or was this statement a result of a computer model or simulation?
Re: #115
Judith,
Total speculation, but I wonder if WW1 might have something to do with it, in respect of changes in patterns, routes and volume of shipping, therefore reporting of storms? There might also have been changes in priorities of meterological institutions.
Re 118: Knutson paper was computer simulation
Re 117: We are working on this, Peter Webster is about to submit a paper that is relevant to this
Re 116: the HURDAT data base is a moving target (moving in the right direction), but the designated landfall data set has numerous inconsistencies with the best track data set. sounds like at 244 total storms you have a decent version. people use it in different ways re landfalls, i saw some plots last fall that that made no sense
Re 119: re 1915, my first suspicion was WWI effect, but the data may be real given the SST
We have a question. Why are they naming tropical depressions now? And they brought this up on cable news last night as a question and talked about it a little bit with no answer.
Here’s an example:
http://www.nhc.noaa.gov/refresh/graphics_at4+shtml/084724.shtml?hwind120
“Latest advisories and graphics for Tropical Depression DEBBY en-us Tropical Depression DEBBY Public Advisory Number 23 Issued at 500 AM AST SUN AUG 27 2006”
And then from information online:
Tropical systems are classified into four categories according to its degree of organization and maximum sustained wind speed.
Tropical disturbance, tropical wave: Unorganized mass of thunderstorms, very little, if any, organized wind circulation.
Tropical depression: Has evidence of closed wind circulation around a center with sustained winds from 20-34 knots (23-39 mph).
Tropical storm: Maximum sustained winds are from 35-64 knots (40-74 mph). The storm is named once it reaches tropical storm strength.
Hurricane or typhoon: Maximum sustained winds exceed 64 knots (74 mph).
Are these classifications correct or have the catagories been changed under our noses to fit into the promotion of the AGW senerio or what?
RE #121 Debbie was given a name because it (she?) reached tropical storm strength for a while. A system retains its name even in the dissipation (depression) stage, as Debbie does now.
I’ve followed tropical systems for many years and, while the detection of weak systems has improved, I don’t think there is any effort to support the catastrophists by reporting more storms. I suspect that most tropical specialists are “lukewarmers” (some warming, but not catastrophic) like me.
Judith, could you assist me the following unacknowledged inquiry to Peter Webster to whom I was referred by Tim Killeen:
Thanks for responding #122. good to know. 🙂 They were calling it Tropical Drepression Debbie on the news, as did the website and that it didn’t seem ok to us.
#122 maybe the motivation isn’t to try to make the effects of global warming look more catastrophic. However, if the public expects to see more storms as a result of global warming and people start naming a greater percentage of the storms what is the consequence? This is taken a step further when people write papers about how trends in the number of named storms are evidence of how global warming results in more tropical storms.
Re #103
Bloom is doing it again. Posting off-thread in an obvious and pathetic attempt to discredit two of my arguments for the price of one. Instead of dimissing my arguments, and trying to discredit me, why doesn’t he just refute the arguments by appealing to fact? The answer is because he is not able to.
I have read Ken Fritsch’s request to avoid personal confrontational postings, but what is one to do when being attacked like this? (I see from Bloom’s postings and replies at RC that he is known to the community for following this tack.)
To summarize very quickly, what Bloom has come to learn is that (1) hurricane count is indeed a random variable subject to sampling error, such that (2) different pre-treatments of the time-series data have a strong influence of the statistical significance of the analysis. i.e. Whether or not you believe there is a strong increasing trend in hurricane occurrence depends sensitively on how the data are manipulated prior to analysis. Taking moving averages, summarizing across multi-year windows, making incorrect assumptions about error distributions – all these things influence one’s perceptions of a trend. Bloom did not understand this a week ago – but I see he has not gained any humility in learning these valuable lessons.
My argument – the one Bloom, and even Dr. Curry, is not addressing – is that policy people need to know that these analyses are somewhat flaky. Instead, what happens is that this lack of robustness is suppressed and policy people are fed watered-down analyses that overstate their conclusions by not disclosing statistics and not showing error bars on graphs.
I do not have time to continually defend myself from attacks like this. If I do not respond in the future I hope blog readers will understand it is purely because of time pressures and because of Ken Fritsch’s request.
If Bloom’s unsubstantiated attacks continue, I will be forced to quit posting.
#126. bender – your contributions here are extraordiarily welcome. I don’t have the time or energy to weed out all out-of-line comments and generally have to trust to the goodwill of posters. Given the difference in calibre between your posts and less-informed critics, I don’t think that you need to worry unduly about picking every spitball off the wall. I’ve long since given up doing that and mostly just ignore unsubstantial and uninformed comments.
Steve Bloom – bender’s contributions are extremely well appreciated and I request that you be on good behavior. You can vent at me if you need to vent.
#126 Bender you should not be the least concerned that you are being discredited. You are not! One only has to review what you have presented in this thread and Willis and Ian Castles responses and elaborations in the CMIP Control Runs thread to be absolutely pleased and grateful for what you are teaching the rest of us.
Your Student
Apologies, then. And thanks. Being removed from the discussion (I don’t have time right now to follow every post) makes me fearful he’s getting away with pulling a fast one. I’ll try to be more patient about those spitballs.
Re #123: The person that has been conducting the analyses of the tropical cyclone forecasts by the European coupled seasonal prediction models (ECMWF, UKMO, METOFRANCE) is Frederic Vitart at ECMWF F.Vitart@ecmwf.int. No journal publications on this yet, but if you search the web you can see the talks that he is presenting. Peter Webster came across this research accidentally while visiting ECMWF. It does not seem that these forecasts are made public yet? I will be at ECMWF the week of sept 4, i will definitely try to find out more about these forecasts (and particularly their availability and any documentation).
Re # 127 this is a really interesting blog, relatively free of b.s. and full of real content. i will definitely be checking in on a regular basis (and will also try to digest more of the statistical content of some of the posts after i get back from ECMWF)
#130. Judy, thanks for visiting and look forward to future visits. I was in the audience for your presentation at the House Government Reform Committee (I’d had my turn at the House Energy & Commerce Committee the day before.)
Judith, this is an excellent website and your posts are adding to that excellence. I (a casual reader with nothing profound to offer to the dialogue) look forward to reading what you have to say.
If I may, let me ask a question i asked from several days ago. It seems to me that the models show a significant warming of the mid tropical troposphere, which would make it more stable, not less. That would tend to shrink the amount of moisture-rich air in the tropics, I would think, and thus act to suppress tropical syslone formation. Is there anything I can read to help me understand more about what the GCMs say about changes in the mean tropical atmosphere? Thanks.
Re #126: Steve M., I think I need to respond to this, but will do so one time only.
If one reads through the entire thread, substantive contributions from me can be seen in 53, 58, 68, 71, 82, 89, and 99. These were interspersed with various nasty and mainly content-free attacks on me, the hockey stick, proxies or “global warmers” generally in 54, 55, 59, 61, 65, 72 and 74. (BTW, these drew no remonstrance from you, which I would point out has the effect of encouraging more of the same. But it’s your blog.) Of those, I only responded in kind to 54 and 55 (in 56); the rest I ignored. On the whole, I think I exhibited considerable forbearance.
Then, in 101 bender wrote: “So gratifying to see the reversal in Bloom’s point of view, based on an objective analysis of the data and a sober consideration of statistical and methodological uncertainties. Maybe he is a gem after all. (You guys are all doing a great job with these data. Keep it up.)”
Was it fair for me to see some attempt at insult in that? I think it was. So I responded in 103:
“Apparently for some people denial is just a river in Egypt. See, bender, I’m not qualified to critique your tree-ring stuff, but I have to seriously question it given the way you approached this hurricane discussion.”
The reference was to the fact that Bender had been told (by me) that the data did not support such an exercise and precisely why it didn’t. He did it anyway, and then you (Steve M.) not only featured his work in a thread (this one) but wound up your own comment on it by asking: “If Curry is unaware of these issues, what does that say? If she is aware of these issues and ignored them, what does that say?” IOW, you were inferring incompetence or dishonesty on Judy’s part. Where was: “If bender is completely wrong and has made this up from whole cloth, what does that say?” What, indeed.
Tone aside, my problem with Bender isn’t that he did it but that he knew it was an invalid exercise and sought to proclaim it as something else. I think both of you owe Judy an apology.
Finally, I would like to point out that this entire discussion started with Bender baiting me (twice) into a debate. He has exhibited a snarky, superior tone throughout and having received just a little bit of it back has now resorted to threatening to take his ball and go home. That seems to me a less than mature response.
Steve (Bloom), I’ve been trying to warn you that if you continued with your unsubstantiated attacks and your lack of citations, you were going to get your vote cancelled.
Let me give you an example. Several times you have attacked me for something I wrote in Coolwire 13. You have refused to say what it was. I invited you to tell me what was wrong, saying “Heck, if you think something is wrong with my Coolwire 13 article, cite us chapter and verse.”
You did nothing … except that later on, you repeated your claim, this time saying
I responded:
I also said:
Your response now is to claim that you are being treated unfairly … dude, you can’t say I haven’t tried to warn you about the likely consequences of your actions. For you now to complain that someone is showing a “less than mature response” is one of the funniest lines in this whole thread …
w.
Enough maudlin discussion about hurt feelings. Next one gets deleted.
There was an interesting article in yesterday’s London Financial Times on this topic. The bottom line of the article was, the older data are suspect and the general conclusion by many in the field of hurricane study was cyclical variation could explain the uptick since ~1980 just as easily as AGW. Coming from the usually “pro-AGW” times that was significant. They had consulted the UK Met.
Re #130
Judith, along with others, could I extend a warm welcome to the blog, and I look forward to your contributions when you get back from overseas.
Re #136: FT or T? Link? Thanks.
I try to keep up/follow all of the discussion here on CA, RC, the Pielkes(and occasionally have a look at Tim Lambert’s site just for fun). Bit of a struggle, to be direct, for this layman. But what I do see from this site is a high quality of open discussion; little censorship; little tolerance of ad homs; a stimulating, fact based discussion (for the most part).
What becomes blindingly evident is where people are coming from. Many contributors to this site are clearly objective seekers after truth, skeptical in orientation, but generally interested in finding truth. Others (you can see clearly who they are if you lurk here for a while) clearly are convinced that AGW is the greatest problem facing the planet, and we must do everything that we can (including permit misrepresentation and exageration as Al Gore and Stephen Schneider have so eloquently confessed) to get the community/governments to address the situation.
The wonderful thing about the blogs is that lurkers like me (well I can’t resist the occcasional post) soon can see where the truth lies. And it sure doesn’t (at least to me) seem to lie with those for a propensity for calling all of us CA participants “AGW DENIERS” engaged in “AGW DENIALISM”.
Great credit to you Steve Mc, and all who patiently contribute good science here. Keep up the good work!
It seems to me that those who so fervently accuse us of AGW Denialism are themselves discredited as endorsing junk science.
Re 138. Link is here, in the FT
http://www.ft.com/cms/s/78e18f88-349f-11db-bf9a-0000779e2340.html
Seems like my little bit of analysis has hit the buffers due to tinypics somewhat unreliable hosting. Still, at least it saves me buying anyone a beer 🙂
For those that saw the plots before they disappeared into the ether, they were supposed to be an illustration of the “extreme value” fallacy. The rules on which I based the plot were to simply follow the hurricane season count, and every time a record year occurred, plot the data up to that point. (I skipped the first decade or so as that would have produced many very short graphs). This is a great way of generating hockey sticks, from any time series. It just makes me wonder if it is coincidence that everyone wants to talk about hurricanes just after a record season; had it not been so, would it have got so much press? Or would we be talking about some other data set that had hit record values instead?
This observation on its own is fairly weak and doesn’t add a huge amount to the science (it has more to do with how the media promotion of record data can give misleading impressions, rather than the scientific literature, which handles data more robustly and therefore is less prone to these kind of errors). However! It did lead me to a thought which may be appropriate to the scientific analysis. Having plotted the graphs, and comparing them to Steve’s above, on different time scales and for different sections of graph, one thing that struck me was the remarkable similarity between the charts irrespective of changing scales.
There isn’t really enough data to make a clear determination of this, but just looking at these charts makes me wonder if the hurricane data exhibit properties of self-similarity. Many natural systems – particularly complex systems such as weather and climate – display self-similar properties. If this is the case, the problem of identifying trends is even more onerous than under the assumptions of a Poisson distribution.
So my question is – has anybody in the scientific literature tested the hurricane data for self similarity (I suspect there is insufficient reliable data to perform such a test) – and if not, would it be fair to say that such an assumption should not be ruled out of any analysis?
Spence, could you email me the graphic and I’ll relink. Actually I’ll probably put this up as a post. I’ve previously posted up on Mandelbrot on self-similarity and also on Klemes’ criticism of Mandelbrot as applied to hydrological systems – all large and interesting topics.
141:
Related to this, statistics for record times are discussed in many papers, for example Allan Gut, Precise asymptotics for record times and the associated counting process, Stochastic Processes and their Applications, Vol. 101, Issue 2, Oct 2002.
With one i.i.d. series we get (on the average, approx.) log(n) records in n years.
With respect to accuracy of data – while the last number of years may have very accurate counts of actual numbers and maybe even intensities, there must still be an acknowledgement that any analysis done covering any time up to the last half century is incomplete. Most researchers acknowledge some degree of an oscillation or cycle which spans about 70 or so years. Therefore any study covering 35 to 50 years has not covered a complete cycle and must lack some degree of completeness. A study shorter than a complete cycle may also show a trend which is not realistic.
Re #144 – What I meant by last half century is the last 50 years.
Speaking of self-similarity, here are the trend statistics if one were to cherry-pick 1914-55 as start and end dates:
Coefficients:
Estimate Std. Error t value Pr(>|t|)
Intercept -313.2 90.962 -3.44 0.0014 **
t i m e 0.16619 0.04702 3.53 0.0010 **
—
Signif. codes: 0 ‘***’ 0.001 ‘**’ 0.01 ‘*’ 0.05 ‘.’ 0.1 ‘ ‘ 1
Residual standard error: 3.694 on 40 degrees of freedom
Multiple R-Squared: 0.238, Adjusted R-squared: 0.2189
F-statistic: 12.49 on 1 and 40 DF, p-value: 0.001048
Slope not as steep as 1974-2005, but similar level of significance.
Were there papers published in 1956+ arguing in favour of an increasing trend in hurricane frequency?
Steve M., your speculation on an average Atlantic storm season is looking on-target. Five storms so far (four is average by the end of August) with only one hurricane, which was a hurricane for less than a day. (In fact, I will not be surprised if the one hurricane gets downgraded in the post-season review.)
The longer-range weather models show atmospheric conditions typical of early and mid September, but with greater than normal upper winds (= weaker storms and a tendency to turn them out to sea) along the US coasts.
So, perhaps we’re headed towards a season of about average numbers and somewhat below-average strengths.
RE: #147 – “The longer-range weather models show atmospheric conditions typical of early and mid September, but with greater than normal upper winds”
I suspect it to be hemispheric. On the Pacific Coast we are unmistakealy into our typical early Fall pattern now. I also note that flora appear to be taking the cue – leaves are turning 4 to 6 weeks earlier than normal.
If you are paying attention to the media coverage of Ernesto, however, you’d think it was the end of the world. Heck, it’s not even a strong TS (45 mph winds). My buddy in Melbourne, FL, is at home today as everyone is all freaked out. Bastard.
Mark
Media coverage is rediculous. I’m up in Boston and we’ve actually had a rather cool August, it hasn’t been out of the 70’s much at all. Its been very pleasent.
Colorado Springs is back into the normal “monsoonal flow” which means lots of rain in the summer (after an unusually dry spring). Of course, rain in July was several inches above normal, and temps have been 10-15 F below normal highs. August has been stormy, but the official numbers have us at normal rain (the airport is 800 ft. below my house, which has been getting pounded). Very nice. Very nice.
When I lived in Florida (1995-2002), a 45 mph TS wasn’t even enough to mention in the news. Everyone is freaked out. I just got off the phone with my buddy and he’s enjoying the day off (no rain there, yet).
Mark
re: #149
I think the reason for the excessive media coverage is a combination of “Katrina envy” and political maneuvering. The first is that the news media was all set for another season of bad storms and can’t stand that so far it’s been a bust. The second reason, for a few who want to push the connection of increased storminess and AGW, is to prep the public so that when the regular bad storms do appear they can seem part of a continuing series of extreme events rather than just a normal season.
re: #151
The monsoon weather here in the Phoenix area is also “back to normal” after a number of years of reduced storminess. I haven’t heard how well the storms have filled the resevoirs but I expect they’re doing ok. It will be interesting to see how the winter snow pack turns out.
Hey, Farmers Almanac is calling for a very cold winter. I think they use a Sunspot formula and claim to be 80-85% correct! It should be interesting to see how it plays out.
“I suspect it to be hemispheric. On the Pacific Coast we are unmistakealy into our typical early Fall pattern now. I also note that flora appear to be taking the cue – leaves are turning 4 to 6 weeks earlier than normal. ”
Same on the East Coast. Noticed it coming out of Montreal this weekend. The low lying, lakeshore trees (stressed) are turning already. Pretty uncommon for August when peak foliage is usualy the 1st or second week of October.
THe heat wave of last month lasted for ~2 weeks. THere has been no period greater than two days that has had anything approaching normal tempratures, all below normal.
Lots of rain.
It must be Global Warming.
Well, last I looked, which was a couple of weeks ago, the long lead forecasts seem to be calling for a warmer than normal winter over much of the US. I think I’ll go with the long lead forecast.
re 149: Yes, Dave, that is exactly why. Also why I made the post. It was sort of a “hint, hint, nudge, nudge” joke. 😉
If I’m not mistaken, most of the weather we get in the Springs comes up through Pahonix, so I’m not surprised. Phoenix is odd, sort of like Vegas, in that all of the resevoirs and surrounding population have actually created a condition in which it now generates its own weather.
Our resevoirs, btw, are overflowing. We were up at 11-mile canyon a few weeks ago and the spillway around the dam was essentially a class-5 river with the bottom of the dam opened up full bore. This is a result of 1) recent heavy rains and 2) way above average winter snow.
Mark
If you’re right, then coupled with the hurricane long-lead forecasts you’ll be batting .500.
Mark
Well supposedly Steve Bloom has info that this season is turning out particuarly “terrible” but refuses to post any link to such information.
I think it may possible be stealth hurricanes that the news media is not telling us about.
Or this season is not turning out as bad as everyone thought it would. Much like Ernesto. Rarely have so many words been written and spoken about something so insignifigant.
The positive 5th order PACs in #18 – if they are meaningful – suggest 2010 may be the season to watch, not 2006.
And the positive 10th order PACs in #18 suggest 2015 may be the season to *really* watch out for. Insurance anyone?
If the Climate in Utah is anything to judge Global Warming on then I want some more of it. After almost a decade of below normal rainfall and above normal temperatures we have been showered with the kind of weather that I remember from growing up here. A solid spring rain and then weekly to bi-weekly thunderstoms in the summer. The drought that we had was going to take years to recover from and yet in a year and a half ALL of the resevoirs in northern Utah are at or near capacity (at least all the ones I have been to)
As far as the Hurricanes go I am glad people have been traking down the information. I hate to take snapshots and attempt to draw a conclussion from the data, because I have found I am always revising my asumptions as I receive more data. Hurricanes became Big news last year because it was a really active season. When I read six months ago what the prediction was for this year of hurricanes I laughed because I was fairly certain based on the limited data I had been able to collect that they were WAY over (limited vindication) because the NOAA back on the 8th of August lowered it huge prediction of 4 to 6 MAJOR hurricane storms down to 3 or 4.
I will be suprised if we even see three this year.
All Hype and no Science is becoming all to common and it hurts the scientific community because over time people catch on. You can fool some of the people all of the time, and some people some of the time, but you can not fool all the people all of the time. I am tired of being fooled. I am now very sceptical of most claims made by the scientific community when they are all dancing to the beat of the same tune. I would rather see true science where you attempt to disprove theories rather then shore them up with shoddy reasoning and flip-flop data pandering. (This does not only apply to Global Warming – which very well may be occuring but my guess is not ONLY because of CO2 + Methane emmissions as on many other boards cite as the only possible cause)
When you have imperfect datasets all conclusion is suspect. If over the next decade the world went through a stabalization in temperature rather then an increase WHAT WOULD IT MEAN?!?!? In statistical analysis of anything a short term trend ( which is all we have in temperature ) means nothing. The same holds true with our Hurricane anylisis. We don’t know. So when it comes to the climate lets all say the following before we claim to know what we are talking about. In 1980 The projection for population growth was logorithmic, which IF CURRENT TRENDS continue will be TOTALLY wrong, but it was the rallying cry that the human race was going to explode so fast that resources could not possibly keep pace. I have an old textbook that said we would be at 10 billion people by 2010. Current projections are that we will not even hit that by 2054.
Sorry for ranting, I am just tired of the news media. I am tired of not being able to trust the information presented to me. I am tired of knee-jerk reactionary calls of doom and gloom. One film I watched in highschool in 1995 made a STUPID set of predicitions that by 2005 the Mid-west would not even be able to produce a fifth of what it was able to produce in 1995 due to it all becoming one giant desert.
If you correlated a stupid game like video poker to years of temperature, you would find the same result in your payback that the Hockey Stick does (yes I know it is not a perfect correlation). If our life times were mesured in days rather then years, and we were born in spring would we be freaking out that each day is getting warmer then the last?
Again thanks for letting me rant, I know that is what it was, It is not meant to be intelligible, just something I wanted to get off my chest for the cathardic effect. Thanks all good thead.
Re #159: Western Pacific, Sid (and I haven’t checked the stats, but I believe the Eastern Pacific is also performing above expectations).
Re #160/1: Next step, astrology.
Re #162: If you look at the behavior of Atlantic hurricanes over the last ten years, and in particular the last two years (recalling that 2004 was a very nasty season), it becomes obvious why everyone in the hurricane biz expected another one. The reasons why it wasn’t are clear and mainly have to do with it being windier. Now the wind is dying down and the SSTs are close to where they were last year, which is why there is still an expectation for intense activity in the next two months. Like any long-range weather prediction, of course none of this is very certain. Consider, e.g., that an otherwise very “promising” tropical wave can be killed off by a well-timed intrusion of a relatively small amount of dry, dusty air. A handful of unpredictable events like that can turn what would have been a bad season into a mediocre one.
Your own description there is exactly why blaming GW for any hurricane development patterns is an invalid argument. Also, early season inactivity is attributed to cooler than normal Atlantic, not wind.
Hehe, “unpredictable” w.r.t. anything climate seems awfully ironic coming from you.
Mark
2006 to date.
Total storms: 12 (official)
Typhoons: 6 (official)
Super typhoons: 4 (unofficial)
2005
Total storms: 24
Typhoons: 16
Super typhoons: 7
2004
Total storms: 29
Typhoons: 20
Super typhoons: 7
2003
Total storms: 27
Typhoons: 17
Super typhoons: 5
2002
Total storms: 24
Typhoons: 16
Super typhoons: 8
2001
Total storms: 26 (29 JTWC)
Typhoons: 16 (20 JTWC)
Super typhoons: 3
2000
Total storms: 23 (26 JTWC)
Typhoons: 13 (15 JTWC)
Super typhoons: 5
1999
Total storms: 23
Typhoons: 11
Super typhoons: 1
1998
Total storms: 18
Typhoons: 9
Super typhoons: 3
1997
Total storms: 29
Typhoons: 24 (including Paka and Oliwa)
Super typhoons: 11
I can go further. But it is fairly obvious that 2006 is not a harrbringer of a terrible season in the Western Pacific. In fact it looks to be about average.
Fatilities are high, but they just aren’t high for the season, they are high for the amount of storms, and is probably indicitive, again, of more people living or visiting in storm prone areas.
But then again, the 2006 Storm season could be like the 1986 Celtics, and they could rally in the 4th quarter. But there is no evidence to date that they are.
Re #163
I do not interpret hurricane data; I merely report on it. It is up your fertile imagination, Bloom, to interpret these high-order autocorrelations. We all know that only certified climatologists like yourself are qualified to speculate on periodic variability attributable to highly imaginative teleconnective periodic forcing processes, such as ENSO, NAO, etc. I will just stick with the facts.
Re #164: “Your own description there is exactly why blaming GW for any hurricane development patterns is an invalid argument.” Yeah, and without the scientific studies demonstrating that it’s valid, I’d hardly have a leg to stand on. Looking at those papers is ever so much more boring than disporting oneself with excel work-ups of flawed data, though. “Also, early season inactivity is attributed to cooler than normal Atlantic, not wind.” Higher winds earlier in the year cooled off the sea surface. These are distinct from the high-altitude shear winds that impede hurricane development.
Re #165: That’s not a meaningful exercise without looking at the distribution within the season, Sid.
And if willis or someone can come up with to the same date for previous seasons, we can look at that (He has better sources, I could do it by hand but dont have the time).
But it is irrelevant. The total number for mid season gives no evidence towards anything “terrible” no matter your definition of the word.
We are past mid season, and the numbers do not in any way look out of the ordinary. Terrible would be out of the ordinary.
Sorta like all the HS studies. No leg to stand on.
You define irony well, Mr. Bloom.
Mark
Re #167:
Bloom: Point taken, but that’s really not a very nice way of describing Judith Curry’s efforts in that Fig. 1 of her BAMS article. She gave it a pretty good shot.
Either way, Steve B., you missed my point. That the climate is unpredictable is OK in some contexts, but not others. Sort of like having your cake and eating it too, you, and others like you, only apply appropriate logic (and scientific means) when it suits your cause.
Mark
Re #166: Bender, if you had bothered reading the HURDAT documentation carefully before excitedly downloading that spreadsheet and leaping to those unsupportable conclusions, you wouldn’t have found yourself having to emit that cloud of ink. Don’t say I didn’t warn you.
Re: #171
That makes 7 double-standards since I started enumerating them 3 weeks ago.
Re #172
Not biting, Bloom. My analysis is of Curry’s data, nothing more, nothing less. Any problems you have with “my” analysis are in fact hers. Go talk to her over at RC.
Not biting is the appropriate respone. Bloom is leading us in circles. What else is new?
Bender, I’ve always felt that double standards are easy to spot – there’s two of ’em.
Mark
#162: Forrest, you have to realize that the people who make the forecasts at the NHC in general are doubting of the AGW/Hurricane connection. Bill Gray, who also lowered his prediction is an AGW denier of the first order. Both NOAA and Gray called for more active than normal seasons this year. Neither of these entities are dancing to the tune called by the AGW drummer, to mix my metaphors…
Willis’s data for landfalling hurricanes in #35 are pretty interesting. Anyone want to guess what the 1974-2005 trend is? (Or would this also be an invalid analysis, Bloom? Please tell me now, *before* you see the results.)
Re #174: Hmm, I seem to recall you analyzing some graphs derived from the data, but refusing to look at the data itself since it had not been served up to you on a nice xls platter.
Re #178: You haven’t let that type of merely scientific concern slow you down so far, bender, so why start now? But rather than taking my word for it, have a look at Kerry Eamnuel’s FAQ.
Re #110:
Ironically, Figure 1 in that paper uses five-year moving averages, which are problematic for reasons discussed previously at RC. Reasons, incidentally, that were dismissed by Bloom’s post #234 in the UCSSCP thread here, where he argued:
I guess my comment on moving averages wasn’t so far off the mark, after all.
Re #179
Thanks for the tip. Does this FAQ answer the question why influential papers in climatology tend not to report trend statistics or graph confidence intervals? Because that’s the topic of this thread. Oh, never mind.
Emanuel FAQ referred to in #179.
Re #182:
Some interesting quotes from Emanuel’s FAQ and essay (recommended by Bloom, link provided by bender in #182):
“It is now widely recognized that improvements in understanding and predicting climate hinge largely on a better understanding of the processes controlling atmospheric water vapor and clouds.” (Amen)
“Global climate models produce conflicting results on tropical cyclones” (intensity and frequency) (Not a surprise to me)
“Doubling CO2 would yeild a tropical sea surface temperature increase of only about 0.5C and a barely perceptible rise in the potential intensity of tropical cyclones.” (Interesting – later, Emanuel says that a 1C increase would produce a 5% wind increase. I imagine that the effect of a 0.5C increase would be hard to see in the data and would take someone very skilled in statistics to detect it.)
His first FAQ states that there is no evidence that global warming has caused an increase in the number of worldwide tropical cyclones.
Emanuel also mentions that the GCM models generally predict a lowering of the tropics-to-pole temperature gradient (=lower wind at the surface) and an increase in the upper-level temperature gradient (=greater wind and wind shear at the very important upper levels). I believe he mentions a possible 30% increase in upper wind shear, which is a significant number with regards to tropical cyclone formation and intensity.
I admire a person like Emanuel who acknowledges the limitations of his science.
Steve B., if I have misstated any of Emanuel’s views, please let me know.
David S.
Further comment on the profile of the future tropical atmosphere: what I’ve pieced together is that
1. the pole-to-tropics temperature gradient is lower in the low levels (probably resulting is less wind and consequently less mixing at the sea surface, resulting in warmer sea surface temperatures and higher humidity). Directionally, this favors greater cyclone development and intensity.
2 the mid-troposphere warms more than the tropical ocean surface, which tends to stabilize the atmosphere. Directionally, this favors lower tropical cyclone development and intensity
3. higher upper-tropospheric winds due to a greater temperature gradient. Directionally, this inhibits cyclone development and intensity.
My guess is that #3 is the most important of the three effects.
RE: #156 – I supposed it has not occurred to you that the same flaws in the GCMs that result in all the alarmist projections also impact the long lead “weather” forecasts in the direction of AGW extremism?
RE: #165 – In China, people quite literally live on mud flats. A Cat 1 storm is a big deal in such neighborhoods.
It’s pretty pathetic the way the media are trying to overstate barely-a-Tropical-Storm Ernesto today.
Speaking of storm counts I found this rather funny 🙂
http://www.nuclear.com/environment/climate_policy/default.html
#187 you can say that again! I couldn’t help but laugh out loud… the national (NBC?) newscast at 10am (MDT) said something like this:
They didn’t notice what the local “color” quote actually said?!!?
I had to think twice about what I’d just heard, to be sure they really did that 😉
Dr. Gray is scheduled to issue his seasonal update today. Should be a downward revision.
Re # 163 – **Consider, e.g., that an otherwise very “promising” tropical wave can be killed off by a well-timed intrusion of a relatively small amount of dry, dusty air. A handful of unpredictable events like that can turn what would have been a bad season into a mediocre one.**
But, but, but – last year, Steve B and Steve B and others were stressing the role of Global Warming causing the high number of tropical storms in the Atlantic including the Hurricane off Brazil a few years ago. Using that analogy there should be more storms this year?? So now we are getting excuses and the causes of hurricanes??? Maybe you can check my posts in RC last year. Now we are seeing “unpredictable” being used!!! C’est la vie!!
Dr. Gray’s team has issued its September 1 updated forecast.
As expected, the numbers have been revised downwards. The forecast, as I read it, now calls for a near-normal year. the intensity aspect, in fact, looks a bit below normal.
On physical causes, they note the presence of unexpected amounts of dry air and dust across the Atlantic, as well as several other anomalies. I believe that the mid-atmosphere dust actually has a sunlight-reflecting cooling effect, too, as well as snuffing out disturbances.
As mentioned before, I think the best way to look at tropical cyclones is that they are machines / heat engines, where all the moving parts need to work properly for a cyclone to form and strengthen. The fuel supply is only one aspect.
link.
OK, I think I understand the link thing now. For #192,
link
#193, DS
I’ve very disappointed in the reasons given as to why they have had to reduce their estimates downwards in this report. In the clearly superior UK we would have blamed this lack of skill on “leaves on the line” or “the wrong type of snow”. Thankfully these people are not runnung our UK railway network otherwise our trains would clearly not run (as everyone knows they do) perfectly on time.
KevinUK
Some notes from the forecast:
If it were truly GW causing this, then it would be consistent. Obviously, it is not.
Guess these guys should be dubbed “deniers,” too.
Interesting. Another common claim by those of us in “denial,” yet apparently we aren’t degreed appropriately to make this decision. Dr. Gray is, however.
You won’t see things like this reported in the media, however.
Mark
Bill Gray, Neil Frank (longtime director of the U.S. National Hurricane Center) and others who are “skeptics” have been ridiculed, and I imagine you’ll see that again. I doubt that you’ll see much mention in the press of Gray’s revised forecast.
I’ve been reading some of Kerry Emanuel’s work on tropical cyclones – he is a “warmer”. What I find interesting is that, once one gets beyond the headlines and into the body of the work, he’s a reasoned person and is unabashed about acknowledging limitations in his area of expertise. I agree with most of his reasoning and conclusions.
I’ve just started reading some of the Georgia Tech people’s work. I think they would mostly be classed as “warmers”. Unlike Emanuel, some of what I’ve read from them is weak. But, maybe that is an unrepresentative sample.
RE: #192 – Ah yes, dust and cooling. And there is another infamous dust maker, besided the Sahara. The Gobi (and points to the East of it). Gobi dust + Northern Pacific Ocean = ????
Pretty picture of a tropical cyclone’s satellite-derived temperature. This kind of visual aid gives little additional info., but looks nice nevertheless.
link
I actually experienced a hurricane when I went to Puerto Vallarta Mexico with my family when I was an older teenager. It was pretty spectacular, don’t know what catagory it was, but no one at home even cared or knew about it. So in other words, the local media here in So California, is making a huge deal about hurricane John as if it’s unprecedented–you can tell it is acted out with drama and a totally insincere broadcast because it is “new territory” for them–interviewing the locals and travelers about Mexico. I guess it’s good the Mexican weather forcasts will now be on the news more often, but I’ve lived here all my life, and it’s never been an everyday practice in the local news to mention Mexican weather at all and it’s just a few hours away.
#197 My husband never fails to mention, when we visit his birthplace the island of Oahu, that all that red soil the pineapples and coffee like to grow in; rides across the Pacific on the wind from China. And then, I think, he goes on to say.. the red soil of Atlanta, GA where his sister lives and the peaches grow, comes from South America, right? I don’t always keep my facts straight!!
Re #196: What you’ll find is that the hurricane climatologists (the theory people) are pretty much all “warmers” at this point, but as with Emanuel most were not until recently. A key point to bear in mind about Bill Gray and most of the NHC staff is that they are meteorologists rather than climatologists. Looking at this purely in debating terms, it’s not particularly surprising to see the side with nearly all of the climatologists and many meteorologists winning against the side that has some metorologists. This difference between the two sides has been reflected in the papers published in the last couple of years. It’s also unsurprising to see meteorologists ridiculed when they attempt to speak authoritatively on climatology.
Posted for bender.
#199 WLR
The red soils of Georgia are a result of wind transport from across the atlantic. The source is western africa, part of the Sahara I think.
Re #201:
From Emanuel’s FAQ:
“7.) Q: Does this mean that we are seeing more hurricane-caused damage in the U.S. and elsewhere?
“A: There is a huge upward trend in hurricane damage in the U.S., but all or almost all of this is due to increasing coastal population and building in hurricane-prone areas. When this increase in population and wealth is accounted for, there is no discernible trend left in the hurricane damage data. Nor would we expect to see any, in spite of the increase in global hurricane power. The reason is a simple matter of statistics: There are far too few hurricane landfalls to be able to discern any trend. Consider that, up until Katrina, Hurricane Andrew was the costliest hurricane in U.S. history. But it occurred in an inactive year; there were only 7 hurricanes and tropical storms. Data on U.S. landfalling storms is only about 2 tenths of one percent of data we have on global hurricanes over their whole lifetimes. Thus while we can already detect trends in data for global hurricane activity considering the whole life of each storm, we estimate that it would take at least another 50 years to detect any long-term trend in U.S. landfalling hurricane statistics, so powerful is the role of chance in these numbers.”
From the current NOAA seasonal prediction:
“The conditions that produce hurricane landfalls are very difficult to predict at these extended ranges. As a result, it is currently not possible as part of this outlook to predict the number or intensity of landfalling hurricanes, or whether a given locality will be impacted by a hurricane this season.”
But it would be unfair to exclude the possibility that with just a few hours effort amateurs could spot a predictable pattern using HURDAT.
So Steve. I can assume that we will not expect anymore comments from you laying the blame for increasing hurricanes on Global warming.
Is this correct?
Re #204: Sid, you won’t find me making hurricane *landfalling* predictions based on anything. Overall hurricane activity is of course a different story.
Re#205…
steve bloom, will you be making more statements about how “terrible” a hurricane season is, without making predictions for increased landfall?
Re #206: As I noted, there’s no scientific basis for saying anything about future landfalling behavior. My use of “terrible” with respect to the Western Pacific season thus far was pretty much a reference to the landfalling impacts, although the season as a whole does appear on the active side. How active it is may depend a lot on which metric is chosen. For example, Ioke is but a single typhoon if one is just looking at storm quantity, but at the rate it’s going may end up with the all-time record PDI.
Steve B., after reading your comments in #200, I find it odd that you quote a tropical meteorologist (Emanuel) (see link) and a group of “working meteorologists” to refute a climatology question, rather than quote “hurricane climatologists (the theory people)”.
Also, I am Googling to learn what a “hurricane climatologist” is, exactly. I wonder if a “hurricane climatologist” is to hurricanes what a “math historian” is to mathematics. If I have a question about the future of mathematics, I’d rather listen to the mathematicians.
link
Re #203
My intent is not to point out anything novel in these data. I have confidence that the hurricane meteoro-climatological specialists are doing a decent job analyzing these patterns, looking far avenues of increasing predictability. My point is simply this: isn’t it nice to actually see those trend lines and confidence intervals? I think so. Wouldn’t you want policy people to seem them too? Not just on hurricane data, but on multiproxy reconstructions too? The code for generating these curves is available upon request too, by the way. In fact, I’ll post it here if anyone wants it.
Re #209: Straight out of HURDAT? Not really, since it would be misleading. But just talking about the real world of policy for a moment (here in the U.S., anyway), considering how poorly policy-makers responded to the actuality of last year’s season, I don’t think a lack of information is the problem.
Regarding the multiproxy stuff, of course they already have the NAS report.
Re #208: Hmm, I see why that was confusing. I don’t think looking at specific degrees and titles is terribly helpful in distinguishing between the two groupings, and “climatologist” vs. “meteorologist” might not be the best way to slice things anyway. “Theoretical” vs. “applied” might be better, but then to tell who’s which would involve looking at their publications and making a judgement.
In Kerry’s case, he basically invented hurricane theory, so probably he’s a good source for information on that. OTOH his 2005 paper was pretty much a practical meteorological study.
Re 209, bender, please do post the code.
Re 211, nice try at revising history, Steve, but Emanuel did not invent hurricane theory. That was the legendary William Gray, as is acknowledged by almost everyone in the field, and there is no love lost between the two men. In fact, Gray has accused Emanuel of adopting Gray’s hurricane theory as a way to get more grant money … great source you’ve got there …
w.
# R-script for analysis of HURDAT hurricane & storm data 1851-2005
# To use: Copy and paste this entire script into the R console window
#Create year variable
year
Dang, I forgot: the less-than, greater-than symbols will get interpreted by the blog software. I will send the script to Steve M and I’ll get him to post it.
Re #212: Actually, not to overstate KE’s role, he’s been the leading theorist for the last twenty years and did invent key concepts that underlie modern theory. I’m sure Bill will be happy that someone believes him about these ideas being stolen. Part of Bill’s problem may be that nobody believes he can do the necessary math.
Re # 215, Steve B., perhaps you could give some examples of the “key concepts that underlie modern [hurricane] theory” that were invented by Emanuel … also, why do you believe that William Gray can’t do the math?
I mean, you are the one who is always harping on about how important degrees and credentials are … and William Gray’s are as follows:
Steve, he was doing math long before you were born … your slur is both unsupported and unwarranted.
w.
Re #216: Willis, that would involve your reading through the relevant papers, most of which are available on his and Emanuel’s web sites. It’s way easier to accuse me of a slur, though. BTW, I notice the material you quoted didn’t include the word "theory." Funny, that.
Re #218: But please, Willis, don’t just take *my* word about Gray: See here, and in particular here and here.
Oh, and from that last link:
"(Richard) Lindzen says of Gray: ‘His knowledge of theory is frustratingly poor, but he knows more about hurricanes than anyone in the world. I regard him in his own peculiar way as a national resource.’"
So apparently his knowledge of hurricanes stops a bit before the theory part.
Now where were we?
Re #217 comment from John A.: Most of that material on Gray has been posted on this site before, and recently, and I don’t think anyone believes your memory is that bad. Since my point has been precisely documented, with a quote from Richard Lindzen no less, we’ll consider the censorship threat withdrawn.
Now, to prove your objectivity, John A., I think you need to threaten Willis with a yellow card until he finds an original source to back up that slur against Emanuel:
"In fact, Gray has accused Emanuel of adopting Gray’s hurricane theory as a way to get more grant money … great source you’ve got there …"
Steve B, would you say that Emanuel is to Gray as Mann is to Bradley?
At this point, even if there was a MWP, every one of Mann’s statistical innovations is either completely repudiated or on its way. So what does it say when Emanuel gets Mann, who after all is “not a statistician”, to do his statistics as in the recent EOS article?
Steve B., you’re the one who made the claim that Emanuel invented the “key concepts that underlie modern [hurricane] theory”. All I asked was some citations to show that was true.
Saying “read every paper both of them wrote” is not an answer to a request for citations, unless you’re taking lessons from Michael Mann. Given your lack of response, I will assume you have no citations until shown otherwise.
w.
So what were Emanuel’s and Bloom’s predictions for the 2006 season as issued in May?
Or will we hear about it in December as the one from France?
re #219
http://www.nola.com/newslogs/tpupdates/index.ssf?/mtlogs/nola_tpupdates/archives/2006_07_09.html
http://www.westword.com/Issues/2006-06-29/news/feature_full.html
The above are two articles which mention Gray’s accusation against Emmanuel. Whether what he charges is true I have no way of knowing but willis clearly did not invent the charge.
Re # 218,
Was Lindzen criticizing Gray’s knowledge of overall climate change theory or hurricane formation and intensity theory?
I took a look at the forecast maps for North America for the next several weeks. The upper wind patterns look more like late September than early September, almost like an early pre-fall. That brings wind shear and drier air towards the coast, and tends to steer storms out to sea.
The mid-ocean charts gin up a few storms, including one big one in about ten days, but they stay away from North America. All this indicates a continuation of the rather tame seasonal storm pattern. Steve Ms persistence seems to be in play.
re: 223 in the Westword piece, Dr Curry’s “brain fossilization” ageism is revisited. Mr Bloom should love that one, as he practices similarly, himself. Of course Dr Gray went thermonuclear in his own obscene “Hitler … propaganda” comment relating to “The Inconvenient Truth” — he subsequently renounced that characterization, as one that he and “deeply regrets”.
Over the next few years we are going to observe a certain number of category 1,2,…,5 North Atlantic hurricanes. It might be fun to set up a “shoot-out” between the Emanuel and Gray models, a testable hypothesis with specific critical values so that at the end of some time interval — depending on how many hurricanes of which categories — we could decide whether the Emanuel hypothothesis or the Gray hypothesis provides a better description.
Just a thought…
Re #220: Steve M., by all means go after that one, and the Elsner paper too since it’s stats-heavy. It would be way more interesting than this HURDAT stuff.
Re #221: I’m pressed for time right now, but check out KE’s publication page. I need to find a prior article I have somewhere to pick out the key ones, but I’ll do that in the next day or so. What’s most impressive is the small number of co-authors; I don’t recall ever seeing that with anyone else.
Re #223: I don’t think there’s really a distinction since Gray’s work has been entirely focused on tropical cyclones, although maybe he did some early work on other stuff.
Re #226: TAC, if tou can find a coherent statement of something from Gray, I’d love to see it.
#215, 216. As a result of this dispute about whose ideas are whose, does this mean that we should be referring to KE as Kerry Emanuensis rather than Kerry Emanuel.
Re #217 – **but he knows more about hurricanes than anyone in the world. I regard him in his own peculiar way as a national resource.'”
So apparently his knowledge of hurricanes stops a bit before the theory part.
Now where were we? **
I will stick with “but he knows more about hurricanes than anyone in the world” and the Wikipedia comment about being a pioneer in the science of forecasting hurricanes.
After that whether you quote RC or anyone else, it is still an attempt to cast a slur on Dr. Gray. If that is your contribution to science, it is time for you to exit stage right. And you have not responded to my #222 about your and Emanuel’s predictions for 2006. Try some science.
And the “Now where were we?” What part of science is that?
#123. I received the following reply from Peter Webster regarding the ECMWF predictions of the 2005 hurricane season:
Fair enough. I’ve written back to see if he’d inquired about corresponding predictions for the 2006 season and, if he had not previously inquired, whether he would do so.
Publishing correct predictions after the season is a little less impressive than publishing them before the season.
RE: #224 – The hemispheric patterns are unquestionably in an early Autumn mode. If this mode continues for another week it will be too late for it to switch back – sun angle too low.
Waaay back up this thread somewhere I tried to introduce the possibility of self-similar behaviour in the hurricane count statistics. Following on this theme, I note that Roger Pielke Sr.’s blog has a discussion today on the natural variability of hurricanes, and their behaviour on different timescales.
Somewhere along the way I made reference to 1/f noise models. I didn’t link back to your comment, Spence_UK, but your comment is exactly what triggered that thought.
Re #232
From that Pielke hurricane thread:
Bingo. If the use of linear trend analysis (top-right panel in opening graphic) is inadequate, then is a distorted analysis with no statistics (top-left) better? In some contexts, such as a newspaper, possibly. In a scientific or science-policy paper – NO!
Thanks bender – I hope comment #232 didn’t come across too whiney, it wasn’t supposed to be!! 😉
The topic of self-similarity interests me in this case, but the problem is the available data spans too short a time period, so it seems difficult to assess the issue. One of my early questions (last para, comment #141) was whether there was much in the peer-reviewed literature in terms of such an assessment, and the RPSr. article interests me because it is an example of where such issues have been considered. It does seem that there is at least one paper that supports the notion that the hurricane count does display self similar behaviour.
Re #232
Not at all whiney. When writing the 1/f noise comment I actually wanted to link back to your statement but couldn’t find it. Couldn’t remember what thread it was in. Now I can’t find my 1/f noise statement! Can’t even remember what thread it was in. Sigh.
Re #210
Where do you think political motivation comes from, if not information?
Re #235
I guess the question would be: if you get natural self-similiarity in the absence of various slow-changing forcing processes, and you want to estimate the additional effects of those various forcings, then what kind of null model do you use for the background variability. I proposed the 1/f noise model (I believe it was in reply to UC on ARMA models) to help account for the nonstationarities that seem to be forever increasing as you increase the time-scale of observation. But maybe it is more appropriate for the self-similarity issue you are mentioning.
Re #238
Bender, I agree. I guess there are two possibilities that spring to mind:
1. Unknown linear forcings that operate on long timescales
– or –
2. Coupled non-linear response to linear forcings even if we do know about them, producing a time series with fractal properties as an output
In either case, a 1/f null hypothesis would be appropriate (fractional gaussian noise?). I haven’t read through it in detail, but a cursory glance would suggest Professor Liu’s work makes it difficult to ignore this issue.
Sorry about the late reply. I haven’t visited here recently.
#99 (Steve Bloom) — I’m not sure about the progress of reanalysis for HURDAT, or the other sources of data for that matter. I gather from your comment (“available in easy spreadsheet format”) that this is why I’ve only used HURDAT. However, to correct errors noted below, I’ve supplemented it with data from UNISYS. However UNISYS has its own inconsistencies with HURDAT from 1911-1913 (5 missing storms?).
#115 (Judith Curry) — The 1915, data starts on September 7, and therefore misses Tropical Storm #1, Hurricane #2, and most of Hurricane #3 (82% by energy). Both hurricanes were category 3.
For 1926, I corrected the storm number for Hurricane #5 (originally listed as #4, so there was one long #4 over two time sequences). For 1972, I corrected the day on Sept 8 for Hurricane Dawn (originally listed as Sept 0). There were other corrections to pressure and location which wouldn’t affect my analysis. I update my data for post-2004 storms using the National Hurricane Center reports (TCR).
http://www.climateaudit.org/?p=803
seems to be a continuation from this thread p790