Writing a blog is different than writing a referees’ report. I diarize certain points for the blog as I notice them. The function of these notes is to be topical and somewhat interesting. Martin Juckes has been trying to answer some questions and, to avoid strewing comments over multiple threads, I’d like to use this thread to deal with all further specific comments about replicating Juckes et al 2006. People can still comment on Juckes et al in a general way in other threads, but if you post on this thread, it had better be a precise question or comment or I’m going to delete it- even if it’s something that I’d otherwise let pass. OK?
I’ll try to add in a list of outstanding issues as I’ve noticed them to date. I’ll continue to diarize some issues as I get to them.
Note: In order to reduce noise levels, I am going to act as a type of chairman of this thread. If you wish to comment on this thread, please do so at the thread Your Comments on Juckes Omnibus. If there’s something that you post up that I feel should be transferred here for Juckes to reply to, I’ll do so. We ourselves can chat about this thread over there, but let’s leave this thread for Martin Juckes to respond to, if he so chooses.
List in Progress:
1. Calculation of SI Figure 1. How does one get from the mbh, mbhx, std and cen series to what’s illustrated in SI Figure1? This is resolved. As discussed elsewhere, Juckes used an unreported re-scaling procedure using rms instead of standard deviation. This raises other questions which will be dealt with in turn.
2. Signal "enhancement" by removing Sargasso Sea from proxy roster
3. Signal "enhancement" by removing Indigirka from proxy roster.
4. Continued presence of false statement in online submission about code availability.
5. Removal of Tsoulmajavri series
…. to be continued as I collate other points


220 Comments
Here’s a carryforward from http://www.climateaudit.org/?p=893
#18. Martin, the reason why I’ve tried to get code from people is simply because it’s impossible to read people’s minds. Here are more missing details – this is on just one diagram and this still doesn’t work.
Here’s your SI Figure 1.
Here’s what I’ve got based on what you’ve said so far, the best that I can understand it. First dividing all series by the standard deviation during tghe period 1400-1980; then centering all series by their mean in the period 1856-1980.
I’ve posted up my script for this diagram here – scroll to the end. Feel free to annotate the script to show how you got your diagram. The real mystery is that none of the series in your diagram have a similar shape to the archived "CEN" series – and all the scaling and centering in the world isn’t going to change this.
Here’s my guess as to what you’ve done and it’s only a guess:
1. What you’ve labeled as the CEN series looks like it’s actually the STD series.
2. What you’ve labeled as the STD series looks like the MBH series.
3. You don’t actually show a version of the CEN series, which lacks an uptick of the type shown by all the series in Figure 1. What you’ve labeled as the mbh/archived series also looks like it might be the MBH series scaled differently than in (2), but this is just a guess.
#Comment by Martin Juckes
Try normalising by the rms.
posted 6 November 2006 @ 3:12 pm | Edit This
#
Comment by Steve McIntyre
#36. Martin, this is getting very annoying. I said that I divided by the standard deviation over the period 1400-1980. You said to try “normalising by the rms”. I am baffled as to how this makes any difference. Wikipedia for example says: “The standard deviation is the root mean square (RMS) deviation of the values from their arithmetic mean.” Dividing by the standard deviation is, as far as I’m concerned, “normalising by the rms”.
Also this has nothing to do with the seeming mis-labeling of the series in your graphic. None of the series in your graphic has a closing endpoint lower than the peak around 1600 in some series. While in the CEN series, the closing point is below the peak around 1600. This feature is not going to change with scaling and centering. Similarly if you compare the appearance of the series, the statements below seem to be correct. Please comment.
Here’s my guess as to what you’ve done and it’s only a guess:
1. What you’ve labeled as the CEN series looks like it’s actually the STD series.
2. What you’ve labeled as the STD series looks like the MBH series.
3. You don’t actually show a version of the CEN series, which lacks an uptick of the type shown by all the series in Figure 1. What you’ve labeled as the mbh/archived series also looks like it might be the MBH series scaled differently than in (2), but this is just a guess.
posted 6 November 2006 @ 3:33 pm | Edit This
Martin’s statement is, of course, false. Here ‘s a plot of the Sargasso Sea series taken from Moberg’s Supplementary Information.
The original data is at ftp://ftp.ncdc.noaa.gov/pub/data/paleo/contributions_by_author/keigwin1996/fig4bdata and to show this more clearly, he is a re-plot:
… on another thread I wrote
Dear Martin,
Also, please quit saying you’ve answered questions when you haven’t. I said:
You said:
NO. IT. IS. NOT. ANSWERED. ELSEWHERE PLEASE. ANSWER. THE. QUESTION. ABOUT. INDIGIRKA.
I really hate to be petty about this, but handwaving and saying “I answered that elsewhere” WHEN YOU HAVEN’T just doesn’t cut it.
What about Indigirka? What about Sargasso? Both of them fit your criteria, and you didn’t use them. Why not?
w.
(crossposted from Team Euro Code)
Indigirka: Indigirka is a Moberg series, whose use in a 10-series composite with the Sargasso Sea, yields an elevated MWP-modern relationship as pointed out here
Willis: inquired about this as follows:
I then provided, for reference, the plot of the Indigirka series from the Moberg SI here:
together with a re-plot from digital data obtained from Mitrie coauthor Moberg here.
In response to Willis’ query, Juckes stated cryptically:
The Moberg Corrigendum is familiar to readers of Climateaudit as the complaint originating the Corrigendum and various responses have already been discussed here nd elsewhere at CA. The Corrigendum itself stated:
OK, Martin, your reason for not using Indigirka is not substantive. A new millennial series should be welcomed and is much more useful for verification than re-cycling the same snooped series.
I’ve transferred some comments over to another thread.
In order to reduce noise levels, I am going to act as a type of chairman of this thread. If you wish to comment about matters on this thread, please do so at the thread Your Comments on Juckes Omnibus. If there’s something that you post up that I feel should be transferred here for Juckes to reply to, I’ll do so. We ourselves can chat about this thread over there, but let’s leave this thread for Martin Juckes to respond to, if he so chooses.
Re #3: The Sargasso Sea data in ftp://ftp.ncdc.noaa.gov/pub/data/paleo/contributions_by_author/keigwin1996/fig4bdata extends to “25 Calndr YBp”. It is the convention in paleoclimate studies to specify dates relative to 1950, so 25 Calndr YBp equates to 1925. As noted by another contributor, this represents the centre of a 50 year bin, so the latest data is the 1900-1950 bin. The convention is, unfortunately, not stated in the data file. I have checked with Lloyd Keigwin and he confirms that 1925 is the appropriate end date, but with the caveat that there is considerable uncertainty in the dating because of possible contamination by atom bomb test debris (the “1950” sample has foraminifera from a range of years, mainly before the tests but possibly with some material mixed in from later).
Concerning the Indigirka data, the key phrase is “they are unpublished data”.
Concerning the figure 1 of the supplement: figure 2 of the supplement is as figure 1 but allowing for padding of data as used by Mann et al. and by McIntyre and McKitrick emulations of Mann et al. Figure 1 of the supplement follows the convention of the Juckes et al. manuscript in omitting series which do not cover the full period. My apologies for the incompleteness of the supplementary data which does not fully specify the variable naming conventions of the PCs stored there. It looks as though you are plotting the data of our supplement figure 2.
Concerning the data used in your 2005 Energy and Environment paper, the file you directed me to (proxy.MBH.txt) does not load into R. Given my inexperience with R there could be many reasons. Could you just clarify: is this the file you used for the reconstructions in your 2005 Energy and Environment paper, or are there, modifications which need to be made?
Thanks for pointing out the errors in http://home.badc.rl.ac.uk/mjuckes/mitrie_files/pdfs/comment_ee_figure2.pdf, which have now been corrected.
#7. It is an ascii file, which you can read using read.table. I can’t load R “tab” objects to either website due to website protocols that I can’t control.
Martin, when you say in respect of Indigirka, the “key phrase” is “unpublished data”, I have difficulty following your reasoning. Could you provide an objective definition of what you and coauthor Moberg mean by “unpublished data”? Moberg stated that the series was discussed in the literature. Moberg et al 2005 cited the following article:
Sidorova, O. V., Naurzbaev, M. M. Response of Larix cajanderi to climatic changes at the Upper Timberline and in the Indigirka River Valley [in Russian]. Lesovedenie 2, 73—75 (2002).
Do you merely mean that the data is “unarchived”? I’m sure that you don’t mean that – otherwise, you’d be losing a number of other series that you are relying on.
You can’t mean that the data is unavailable. I have a copy of the data and the sensitivity using the Indigirka data is readily done – indeed, I’ve already done it.
So help us along a little – what is your definition of “published data”?
Martin, in your CVM calculations, as far as I can tell, you divide series by their standard deviations over the period 1000-1980. Do you re-scale by dividing by rms in other circumstances other than SI Figures 1 and 2? If so, on what other occasions? Why do you divide by rms in SI Figures 1 and 2 if you don’t divide by rms in the CVM calculations?
Martin, I am able to accurately replicate the following two MBH CVM versions from proxy versions archived at mitrie_proxies_v01.nc
7 mr_mbh_1000_cvm_nht_01.02.001
8 mr_mbh_1000_cvm_nht_01.02.001_ff
I am running into various degrees of discrepancy in trying to replicate the following versions, which I presume pertains to locating the precise PC series that you used in each case. Would you please identify the references of the PC series used in each of these reconstructions:
9 mr_mbh_1000_cvm_nht_01.02.001_pc
13 mr_mbhx_1000_cvm_nht_01.02.001_cen
14 mr_mbhx_1000_cvm_nht_01.02.001_mbh
15 mr_mbhx_1000_cvm_nht_01.02.001_mbhx
16 mr_mbhx_1000_cvm_nht_01.02.001_std
Steve
When the questions get too difficult Martin will stop replying.They always do.
MArtin Juckes writes:
Hello Stephen, sorry to be slow to answer some questions, I didn’t realise your commiment to keep things on one thread would evaporate so quickly.
First, to return to a number of issues that have been raised over the past few days:
Could you provide me with:
c:/climate/data/mann/pc.tab
c:/climate/data/mann/eof.ordermann.tab
c:/climate/data/mann/tpca-eigenvals.tab
c:/climate/data/mann/weights1.tab
c:/climate/data/mann/gridpoints.tab
c:/climate/data/mann/gridcell.stdev.ordermann.tab
c:/climate/data/mann/mask.edited.tab
c:/climate/data/mann/nhmann.tab
c:/climate/data/mann/treepc.byregion.count.SI.2004.txt
c:/climate/data/mann/treepc.byregion.directory.SI.2004.txt
These are all required by the code for your Energy and Environment (2005) paper, which you kindly provided last week.
Secondly: I notice on that on page 888 you are having trouble interpreting mr_mbh_1000_cvm_nht_01.02.001_pc: This figure could be interpreted as a coding error or as an illustration of the pitfalls of combining the use of proxy PCs and the composite approach. The problem is the arbitrary sign of the PCs. If this is not adjusted the composite is likely to be meaningless because of the arbitrariness, if it is adjusted estimates of significance can be compromised. Some such reconstructions (using adjusted PCs) are included in the discussion for comparison purposes, but for the main conclusions we avoid proxy PCs so as to avoid this problem. The curve you show on page 888 has an unadjusted PC, so it is basically meaningless.
Thirdly: you ask on page 894 about which proxies are used for each reconstruction: in the netcdf file containing the reconstructions, each reconstruction has an attribute “proxy_list” which lists the proxies.
Fourthly: Are you suggesting that any data which is in your possession should be considered as published? It is an interesting idea, and would certainly cut down all the hassle of peer review etc. But seriously, if you can stop posting extended discussion of your problems coming to grips with trivia long enough to say anything serious, do you have any authorative information about the Indigirka data in your possession which would justify its use as a proxy? If so I think it would be really useful if you could write it up and get it published.
Fifthly: Concerning your efforts to reproduce figure 1 of the supplement: your ability to create endless confusion out of a simple problem is amazing. The scaling of the curves in supplement figure 1 was not described in great detail because its irrelevant, the scaling used in the composites is described because its relevant.
posted 8 November 2006 @ 11:53 am | Edit This
#13. You complained about wanting to comment on only one thread and I set up one to accommodate.
1) My original intent in providing code was to show calculations. That’s what I usually use other people’s code for. I’ve read some of Mann’s Fortran code (e.g. it shows that he calculated the verification r2 statistic, but I haven’t attempted to run it. It wouldn’t run anyway because it calls to various directories that are inconsistent with published data.) I hadn’t thought originally in terms of turnkey code, although I have no particular problem with that and am prepared to export things from my machine to accommodate that.) The R-objects mentioned are R-objects containing Mann’s information as R-objects. pc – collation of MAnn’s pcs; eof’s Mann’s eof’s tpca-eigenvals – eignevalues; weights1 – proxy weights; gridpoints – the 1082 gridcells used; gridcell.stdev – standard deviations of gridcell temperatures; mask.edited – the sparse subset; nhmann- mann’s spliced reconstruction; treepc count and directory – number of PCs from each network used in each calc step, same with directory. I think that I’ve got a collation script online and will check. BTW, as you know, the code for the E and E paper was not archived “last week”, but in March 2006.
2)
Again, a simple question one more time: which PC versions did you use in this series? Can you list the PC series from the netCDF directory please.
3) I consulted the list of proxies in the Net CDF file, but you are unresponsive to the question. The proxy list simply lists PC series but does not say which PC version is used. There are mbh,mbhx,mbhl,std,cen; sometimes flipped, sometimes not. I just want to know which series was used (and if you re-oriented the series, which series were re-oriented). Afterwards, we may agree that the results are meaningless, but for now, can you simply say which PC versions you used – it’s a simple question really.
4) I asked a simple question: “what is your definition of “published data”?” Again, it’s a simple question. I didn’t suggest that “any data which is in your possession should be considered as published”. This sort of petty debating point is quite tiresome. You’re the one who’s de-selected the data because you said that it was “unpublished data”. Once again, what’s your definition.
5)
I beg to differ. I simply tried to replicate the curves. Had you provided any sort of rteasonable description of what you did (which might have required a justification of what you did), then I would have had no difficulty replicating what you did. Scaling is an important issue in paleoclimate and is never “irrelevant”.
#13(1) Martin, a script to collate the various Mann objects, pc.tab, eof.tab,… was originally archived in October 2003 and an updated version (reflecting some newer information) was archived in April 2006 at http://www.climate2003.com/scripts/MM03/read.mann.txt. If you execute this script, this should give you the required R-tables in the appropriate directory.
I have trouble benchmarking some of these scripts from my computer as I’ve been blocked from Mann’s FTP. I can test them on versions that I downloaded pre-blocking or that have been sent to me in the past.
Dave Dardinger asked the obvious question about bristlecones.
Martin Juckes replied:
You’ve probably noticed by now that Juckes, liuke other members of the Team, virtually never quotes me word-for-word, but always re-states things. Our position with respect to bristlecones was that the specialist who had collected the samples stated that their anomalous growth in the 20th century was not related to temperature or climatic factors. Graybill (who collected the majority of bristlecone/foxtail sites, and said that he tried to get as many strip bark samples as possible) in Graybill and Idso 1993 postulated CO2 fertilization, following up on an earlier article Lamarche et al 1984, which posited this about Sheep Mountain, the #1 site in the Mannian PC1. (The et al included Fritts, Graybill and Rose,). Lamarche, Fritts and Graybill collectively being dendro luminaries. Hughes and Funkhouser 2003 said that the growth spurt was a “mystery”. Biondi et al 1999 noted the problem. A caveat in respect to CO2 fertilization was given in IPCC 2AR.
In MM05 (EE), we reviewed other factors that could have contributed to the 20th century growth spurt – fertilization by airborne phosphates or nitrates, sheep grazing at high altitudes in the 19th century – associated elsewhere with increased growth of trees due to elimination of underbrush. We adopted no position on CO2 fertilization particularly. Our position was that, if bristlecones/foxtails were to be essential to reconstruction of world climate history, the proponents of this method needed to eliminate these other factors and hadn’t done so.
Arguably the main innovation of MBH98-99 was its adoption of bristlecone/foxtails into temperature reconstructions. Previous reconstructions (e.g. Bradley and Jones 1993) had avoided bristlecones. MBH threw caution to the winds. Their use of bristlecones/foxtails has been followed in virtually every subsequent study: Crowley and Lowery 2000(twice); Esper et al 2002 (twice); Osborn and Briffa 2006 (twice); Hegerl et al 2006 (twice). Juckes et al 2006 raised this to a new level using FOUR different bristlecone/foxtail series in his 18 series-union (which also includes two version of Tornetrask and Yamal, among other stereotypes.)
At this point, it is not just me arguing against use of bristlecones. Bristlecones were an important issue, considered by both the NAS Panel and Wegman. The NAS Panel said that strip-bark samples (which include virtually all bristlecone and foxtail samples) should be avoided in temperature reconstructions.
Juckes fails to even mention the NAS Panel or to discuss this finding.
#9, 13(4). I asked Juckes to provide the definition of “published data” that he relied on in de-selecting the Indigirka series. Instead of providing the definition, he made the following verbal joust which failed to answer the question:
Pursuing the matter, I sent the following email to Juckes coauthor Anders Moberg, who also was the lead author of Moberg et al, asking him for clarification of the observation in the Corrigendum as follows:
Moberg replied:
In other words, “unpublished data” in this context is simply that the data has not been publicly “archived”. As noted in the Corrigendum, although the data had not been publicly archived, the data was available merely by emailing Moberg (which I’d done.) For the Hockey Team in particular, this seems like a pretty thin pretext for de-selection.
Steve M, you may wish to ask Dr. Juckes, expert in plant biology, whether the tree-ring response model used for “temperature” reconstruction might be mis-specified by excluding 2-,3-, and 4-way interactions among T,P,C,N. Pile all that positive synergy onto T (mis-attribution) and you’re going to get a drastically inflated temperature response.
It’s not just about C fertilization. It’s about plants in their total environment: temp, precip, CO2, Nitrogen. Until I see this model refuted by credible data from a credible physiologist, I’m sticking to it. Not sure why the Rob Wilsons and bristlecone ecologists won’t comment. It’s not an unlikely hypothesis.
re #14: 1) Thanks for the file. Sure, I’m not expecting to run it without modification, but the code is so heavily dependent on these input tables there is not much hope of a clear interpretation without those tables. (I’m currently using the version you put on the web last week, following our earlier exchange on this issue).
2, 3) It would have saved a little time if you had mentioned that you had already looked at the lists in the files. New versions are in http://home.badc.rl.ac.uk/mjuckes/mitrie_files/data/ with corrected proxy_list attributes.
4) I see below that you eventually worked out for yourself that I’d quoted this from Nature. See below.
5) Given your habit of constantly quoting out of context and spreading false information I think this is an unlikely claim. You claim that you had trouble “extracting” this information, but you didn’t, if you remember, approach me for the information.
#16: So you are arguing that Bristlecones should be omitted on the basis of a an analysis of correlations with climate data? Shame there aren’t any cherry tree series.
#17: OK, its not just any data in your posession, but any time series that is available electronically? Even by your standards, McIntyre, this is ridiculous.
I’ve got some other work to do for a few days, I’ll check your site again sometime next week.
Re #19 But what about #18?
re: #19 Dr. Juckes
Obviously you’re not a politician. A quote like this demands the obvious. Could you be so kind as to provide us a list of such false information? I might add that I find the “quoting out of context” part pretty unlikely except on an occasional and unintended basis. Steve normally quotes directly huge chunks of material when he’s dealing with what others have said. Afterwords he might summarize briefly, but I don’t think you’ll find much context which is missing on this site if you want to look for it.
In 14(5), I stated:
To which, Juckes replied:
Note that even when Juckes purports to quote me, he uses a word “extract” that I didn’t use. Not much turns on it, but it’s all too typical. Now what exactly is “unlikely” about my claim. That I tried to replicate the curves. Obviously I tried to replicate the curves. There’s plenty of evidence of this on the blog. That if Juckes had provided a “reasonable explanation” of what he did e.g. rms normalization, that I would have had no trouble replicating the curves. Again I don’t believe that this is an “unlikely claim” or “spreading false information”. That “scaling is an important issue in paleoclimate” – again I believe that this is true and Juckes’ article seems to say the same thing. One hardly knows where to begin in responding to such intemperate comments with such little substance.
Hello McIntyre,
Re “extract”: your exact words were “We finally extracted enough information from Martin Juckes to be able to replicate SI Figure 1.”.
Re #18: No one disputes that there are other factors. E.g., Koerner et al (2003) say: “`Experimental data further suggest that situations under which CO2-enrichment exerts sustained stimulations of structural carbon incorporation are early regrowth (at least in warm climates) and deep shade.” The data used in our study are selected from sites where temperature is expected to be a growth limiting factor.
Re #22: I’m afraid its not at all obvious. You grabbed a definition of standard deviation from wikipedia, for instance, “The standard deviation is the root mean square (RMS) deviation of the values from their arithmetic mean” (on page 894). We were discussing RMS. Rather than click on the wikipedia link to the standard definition of RMS, which was in the text you quoted, you diverted attention with a lot of irrelevant stuff about electric currents.
Have you contacted Energy and Environment about the corrigendum for your article yet?
I’ve been looking at the Graybill and Idso (1993) paper again — it doesn’t appear to be reproducible in the McIntyrean sense: i.e. the data is not archived completely (the tree ring data is readily available, but I haven’t been able to get hold of the information about which trees are “strip-bark”).
Martin Juckes has not answered any outstanding questions.
As to his two observations: mea culpa. I did in one comment in a thread use the word “extract” – sorry about that.
Martin, you made no mention of rms in your article. I am unaware of any prior use of rms in paleoclimate reconstructions. So it’s pretty insolent for you to expect anyone to read your mind. I looked for a definition and located one where I could.
You have quite astonishingly failed to acknowledge the perverse flipping of the MBH PC in your “evaluation”. Figure 2 attempted to illustrate this perverse flipping. In doing so, as you pointed out, I made an illustration with the dimensionless series having a common center of 1 (tree ring chronologies.) I have included script for the revised figure in my updated script – which you did not mention in your little Comment. As you observe, this is the only figure or calculation in which this particular form of calculation is used. The revised figure in the Supplementary Information demonstrates that the perverse flipping is actually stronger when a centered PC calculation is done. I will in due course send a note to EE saying that the effect is stronger than indicated in Figure 2, but have not done so yet. I’m sure that you will also note that the perverse effect is even stronger than we indicated.
At this point, the problem for Juckes is not merely Graybill and Idso 1993, but the recommendations of the NAS Panel that strip-bark bristlecones and foxtails not be used in temperature reconstructions. Juckes astonishingly does not even discuss the NAS Panel. The issue is not simply whether bristlecones have experienced CO2 fertilization, but as the NAS panel observes (and as discussed in MM05 EE) whether other forms of fertilization, non climatic response or nonlinear climatic response have affected bristlecones. MArtin, again, you have not discussed these crucial items in your “evaluation” of past reconstructions.
I agree that one cannot determine from Graybill’s information which cores are strip bark and which ones are not. Graybill said that he sought out strip bark cores. If you don’t know which ones are strip bark and which ones aren’t, and you want to comply with the NAS recommendation, it makes the Graybill data sets unusable. Too bad. But if the reconstruction is “robust”, that shouldn’t bother you. A robust reconstruction would not be affected by the presence/absence of bristlecones, would it? That’s obviously one of things that an “evaluation” of millennial reconstructions would deal with – isn’t it??
There are many defects in how dendro people record information. For example, they don’t record altitudes. I’d like to see altitude information from the Polar Urals site – maybe your coauthor Briffa could forward that to me. BTW can you obtain identifications of the sites used in Briffa et al 2001? I’ve been trying for several years without success. While you’re at it, could you also get the actual unspliced MBH reconstruction for the AD1400 step?
Dear Martin:
Thank you for continuing to post here. Rather than look for errors in our analysis, however, it would be much more valuable if you concentrated on answering questions about the errors in your analysis.
In particular, since you were tasked with analyzing previous reconstructions, and since the NAS Panel has recommended that strip-bark species not be used, why did you use them and not even discuss the issue?
Also, the sensitivity of so-called “robust” proxy reconstructions to the presence or absence of a couple of hockeystick-shaped individual proxies is very well established. Why do you do not address this question in your paper?
Next, you have not commented on the fact that you have the same series in your reconstruction under different names.
You have not said what your criteria were for picking one of two series in an area (e.g., Polar Urals).
Finally, why have you singled Steve M. out for comment about data and methods availability, when some of your co-authors are among the worst offenders in the field?
Yes, there are occasional errors in the analyses made here, and you are welcome to point them out. But it doesn’t do your reputation, or the reputation of your paper, any good to only discuss our errors. There are gaping holes in your paper, and unless you’d like your analysis to be eventually consigned to the trash bin of history, you need to address them. These are real, solid, scientifically based questions about your work, and they will not go away simply because you prefer to discuss the mote in our eye …
Again, thank you for continuing the discussion. It is very informative, both for what you say, and for what you don’t say.
w.
Dear Dr. Juckes,
Thank you for your response to my #18. You say:
While that may be the intent of the experimentrs, and while it may generally be true, it is certainly not true for all your data sources, and more to the point it is certainly not true for the bristlecones pines, which dominate the reconstruction. My question #18 was not a general question about all trees; it was specifically focused on the bcps.
Would you care to reconsider your answer, knowing now that I’m talking about the bcps?
Martin, one of the usual practices in millennial paleoclimate is to calibrate a model on one period and reserve a verification period (e.g. 1902-1980 and 1856-1901 in MBH). It seems surprising that you did not follow this practice. When I did common calibration-verification tests on a variety of reconstructions with a common calibration period of 1902-1980, I typically observed high calibration r2, a failed calibration Durbin-Watson, a “high” RE statistic and a failed verification r2 statistic. Did you carry out tests on a calibration-verification basis? If so, why didn’t you report the results? If you didn’t carry out such tests, why not?
re #24: Could you explain what you mean by “perverse flipping”?
Do you accept everything the NAS report says?
The robustness tests, like the choice of proxies in the first place, must be based on prior information.
True, quality of data archiving is still a problem. Do you know of anyone who has evaluated a correlation between anomalous growth in strip-bark bristlecone pine and CO2 and done a significance test?
Re #25: The use of bristlecone pines is referred to in the paper (its not possible to remove specifically strip-bark data, because the archive data does not record which trees had this property, so the only option would be to eliminate all bristlecone pines).
Re removing “hockeystick shaped” profiles: I don’t do as you suggest because it would vilate the basis of the analysis: the proxies are chosen on the basis of prior information, not what the time series look like.
The Tornetraesk series used by Esper et al 2002 is not the same as the Fennoscandia series used by Jones et al 1999, and Mann et al 1998, 1999, but I’ll look into the affect of leaving out the Fennoscandia series (sticking to the rule of taking the first used).
Did you miss my previous answer?
What do you mean by gaping holes?
Re 26: The answer applies to bristlecones as it does to others. The selection of proxies is based on what was expected, not on what the series look like. The statistical terminology is a little confusing here: if new results were obtained showing independent experimental confirmation of a CO2 fertilization effect in bristlecones that would be reason for excluding them, but analyses based on what the time series look like, while they are clearly useful for other purposes, cannot be used to exclude data from an analysis of this kind.
Re 27: Using a longer calibration period gives more reliable results. As we are using proxies with long auto-correlation periods it would not be possible to get meaningful accuracy estimate from a verification period of the kind you suggest.
#28. I’m leaving now for Cornell and will be out of pocket for a while. I’ll comment briefly on the NAS Report. No, I do not rely on everything, but you need to consider what they say. By and large, specific comments are more reliable than general comments. Their recommendation not to use strip-bark trees is specific. It is also consistent with previous literature including Biondi et al 1999 and even a comment in IPCC 2AR. The use of bristlecones as a proxy is what needs to be justified, not “avoiding” their use. If you are “evaluating” reconstructions – a premise that seems increasingly doubtful – then evaluating bristlecone impact is surely much more on the agenda than many peripheral topics that you’ve spent time on.
BTW, Mann et al 2000 claimed that their reconstruction was “robust” to the exclusion of all dendroclimatic indicators. IF that’s true – and it’s a cliam well worth “evaluating”, then you should be able to forego using Graybill sites because you are unable to determine which were strip bark. You seem very reluctant to do this evaluation. I wonder why. If you’re wondering, you can see Mann’s calculations of the impact on his NOAMER PC network in his BACKTO_1400/CENSORED directory. I’m sure that you, like Mann, know the answer. Also that you, like Mann, don’t want to say it.
I’ll pick up on your other points in a couple of days.
Re: #28
Yet the people who sampled them, Graybill and Idso specifically mentioned the growth as anomalous and having nothing to do with temperature. Why do you take it upon yourself to include bristlecone pine proxies which come practically stamped with the legend “NOT TO BE USED AS TEMPERATURE PROXIES”? It doesn’t matter whether or not they correlate with CO2 or anything else – the fact remains that they do not correlate with the temperature regimes they grew in. These non-temperature proxies are then given weight by the statistical methods used and voilàƒ➡ Hockey Sticks!
re: #28 Dr. Juckes,
It appears you’re using a different meaning for the word “reliable” than I’m aware of. To rely on something is to know that it can be trusted. But if you have no way to verify that something is correct, then how can you trust it?
Also, it would seem from the wording of your sentence concerning auto-correlation periods that you’re admitting that the degrees of freedom are sufficiently low that saving an appreciable part of the instrumental data for verification reduces the significance of the results too much. In that case, I’m wondering how much trust could ever be placed in such reconstructions? Any comments?
Is there any evidence in the literature that such an a priori criteria was used in any of the initial multi-proxie reconstructions? In particular, has it been documented that all the proxies which passed such a preliminary screening were then used in the reconstruction? And later when people like your group then select which proxies from earlier reconstructions to use, how do you renew the virginity of the selection process? Steve M and others have asked. I have failed to notice an answer.
Folks, would you please post comments to MArtin on the Your Comments thread. I’ll pay attention to it and transfer from time to time.
Maybe I am missing something, Dr. Juckes, but it sure seems to me that any study whose results hinge on the deliberate ad hoc selection of only a few trees (without any real justification, even) must be questioned. I can get about any curve I want with this methodology. Dendroclimatologists seem to have a totally different idea of what the scientific method is.
If the statistical terminology is a little confusing I would be happy to clarify. What exactly is the source of confusion? There are two previous comments where I describe the problem in some detail. A search on “bristlecone misspecification bender” will direct you to those comments. #7 in “New CPD paper on reconstructions”, for example. Or #33 in “Rob Wilson on bristlecones”. (I would provide you with direct links myself, but the mouse-over pointer to comment numbers is currently not available in the new look CA.) If those comments are unclear, I can clarify further.
Note: It’s not about CO2. It’s about positive synergy between multiple factors (temp, precip, possibly others, such as CO2, N) being neglected in a linear additive temperature reconstruction model. It’s quite simple when you think about it.
Please look seriously into the matter. It is a critical weak point in your paper. If it is not addressed, I shall take you to task.
Thanks again for your participation here.
Juckes, on #34 your attention is kindly requested.
Please note that your attempt to phrase the bcp 20th c. uptick debate in terms of a yes/no CO2 fertilization question ignores the possibility of interactions among multiple variables. i.e. If G=f(T,P,C,N) is the growth model, then perhaps the main effect of C is insignificant, but the interaction terms involving C (i.e. C*T, C*P, C*N) are significant.
You must be careful not to oversimplify the alternatives to the G=C model. Steve M has never argued that that is the correct model, just that it is an undeniable possibility. You may or may not be able to refute that model; but what you need to do is refute the full interaction model. I would be most interested in hearing the opinion of your co-authors on this matter.
[Aside: Note the parallels with the nature vs nurture debate (genetics, G vs environment, E). This is a false dichotomy given the importance of the GxE interaction for many hereditary/dietary medical conditions.]
#35: It is obvious that there are interactions, and it is obvious that proxies are not thermometers. By averaging the proxies with a range of different non-temperature signals we expect the signal to “noise” ratio to be improved, where “noise” refers to all the non-temperature contributions. If anyone can show a quantifiable contribution from other factors, that would have to be taken into account. Because of the large uncertainties in the data it is important to verify the result. Our reconstruction produces not only the 20th century trend, but also the timing of the rapid warming from 1915 to 1940. The detrended series has significant correlation with the detrended temperature.
re #29: Using your code, I can show that the sensitivity you describe only exists when you use your own “arbitrary” normalisation for the calculation of the proxy PCs (ranging from a standard deviation of 0.0432 for wy023x to 0.581 for nm025). Why do you use this normalisation? Is the effective elimination of much of the data intentional?
I have run the code you provide for McIntyre and McKitrick (2003) (http://climate2003.com/scripts/MM03/redo.mann.txt). The comments suggest that it is intended to reproduce figures 6 and 7 of that paper, but what it actually produces is significantly different: the curves which are labelled as “corrections” come out flatter than the Mann et al. hockey stick. Any idea why? The plots generated by your code are here: http://home.badc.rl.ac.uk/mjuckes/tmp/fig6_mm2003_recalc.eps and
here: http://home.badc.rl.ac.uk/mjuckes/tmp/fig7_mm2003_recalc.eps. The code I used is in the same directory: with a few edits to use local files because I cannot access the climate2003 site with R, even though downloading stuff by hand is no problem.
re my previous post: If you click on the 2nd of the two links in my previous post, you get an error because I put a full-stop after the link. It should be: http://home.badc.rl.ac.uk/mjuckes/tmp/fig7_mm2003_recalc.eps
Re 36: Dr. Juckes, what is your data model? That is, can you give a statistical characterization of the signal and of the noise, and demonstrate that your calculations enhance the signal? How did you arrive at your statistical characterization of signal and noise?
Re 38: The data model is described in the appendices of the manuscript.
Re #36 (1)
Dear Dr. Juckes,
First, I’m glad you agree that the interactions between temp & precip are “obvious”. And presumably you understand how this model applies specifically in the case of 20th c. treeline conifers in the Sierra Nevada (Graumlich 1991, Salzer & Kipfmueller 2005)? Second, I’m glad your reconstruction “fits” with observed instrumental data during the 20th c. However that is not my concern. My concern is (1) the degree to which this “fit” is actually an overfit to a sample, and (2) the degree to which overfitting during the modern era leads to important biases during previous times, such as, say, the MWP.
Shall I go on, or is it clear enough now where I am going with this?
bender, here’s an interesting URL to Stine on the Y1K megadrought http://www.yosemite.org/naturenotes/paleodrought2.htm. Lloyd and Graumlich discuss this. One point that I wish to emphasize and re-emphasize: our position is not that the anomalous 20th century bristlecone growth is demonstrated to be caused by CO2 fertilization. That;s outside anything that we are in a position to argue. We merely observed that specialists in the area said that it was, while noting other specialists drawing attention to other potential fertilization (nitrate) and asserted that it was the obligation of people relying on this proxy to exclude fertilization, rather than the other way around. The obligation to show a linear relationship to temperature also requires exclusion of interaction relationships, as bender has also emphasized, and which relevant specialists have asserted to exist for foxtails.
Re #41
That link did not work for me, but it sure looks enticing.
I agree with your view, Steve M: the onus is on the protaganist – the dendroclimatologist aspiring to publish – to prove that these nonlinear interactions – which some describe as “obvious” – are not fatal to the use of a linear additive reconstruction model. I suspect there are very good reasons why smart people like Graumlich (1991) not only avoid linear additive models, but openly publish their skepticism about them.
Re #42 My bad. Must remove “.” from the link. Works fine.
Wow, that is very interesting. Thanks.
Thought: If it takes, on average, several hundred years for a bcp to succumb to a drought, then the annual mortality rate (which would be compounded over those 300 years to get the cumultaive moratlity rate) would not need to be very different between “geomorphically droughted” and non-droughted trees in order to select out 100% of the former. Fractions of a percent difference would be plenty.
In other words, very, very weak differential mortality ought to be sufficient to seriously bias the MWP tree-ring record. Which means it is entirely possible that the “negative responders” of the MWP were indeed selected out of the modern-day population that is available for sampling.
So when you see those ancient stems/stumps protruding out of the lake pictured in that link, that’s what you are seeing: the result of 1000 years of differential survivorship, the valley-slope samples long-gone. And if you could compare chronologies from those lake-bottom trees to the valley-slope trees that were lost during the MWP double megadrought, you’d likely get your nonlinear MWP back! So maybe it WAS 1°, 2°, or even 3°C warmer then than now?
bender, did you read Miller et al 2006 discussed here http://www.climateaudit.org/?p=585 or was that before you started reading here? Miller et al provide a very convincing analysis reaching those conclusions. Ironically Lloyd and Graumlich 1997 – which Juckes cites as authority for the two foxtail series used in his Union even though they are not mentioned in that article – discusses changing treelines and the role of drought rather than temperature in causing treeline changes in the MWP. Andrew Bunn’s thesis has an interesting analysis of the T-P niche occupied by foxtails based on a survey of a large number of gridcells – Bunn seems like a gem among dendro people – and reported that foxtails have a niche only in a very narrow precipitation interval centered on 120 mm in a cold environment.
As to mortality, obviously both foxtails and especially bcps are very hardy – hence their longevity. BCPs compete with big sagebrush and thus must be tolerant of aridity. It is this overlap of precipitation and temperature in this location that makes it particularly hard to isolate temperature contributions and a remarkably poor candidate as a temperature proxy for anyone other than data miners and data snoopers.
I had read it, but not all that carefully.
I have been avoiding all of the treeline recon literature because treeline dynamics and millenial-scale reconstructions are too far outside my line of work to bother much with it. Now I realize it is impossible to divorce treeline dynamics from ring width response dynamics. As climate changes, treeline changes, the limiting climatic factor changes, and the nature of the climatic response changes. “Obvious” to anyone who’s thought about it. Then again, where’s the validated model if it’s so damn obvious?
Dr. Juckes chastizes me, saying that “trees are not thermometers”, as though it was silly of me to suggest that I might know something (e.g. about model mis-specification under nonlinear interactions) that they do not. Of course I know that trees are not thermometers. That’s precisely why I am not trying to making unsupportable claims in the literature about modern day temperatures and temperature trends being “unprecedented”. There’s too much complexity and uncertainty to make that claim with any kind of confidence.
Re 46: Its good that we agree on something — I’m sorry that you find the statement “trees are not thermometers” offensive. Do you think that trees are unique in having a non-linear response to temperature, or even that the non-linear response is the same in all the tree-ring chronologies used in our study? I don’t think our study makes claims about “unprecendented” trends either. Our reconstruction has substantial upward trends in the 17th century. Our reconstruction is considerably more variable than those of Mann et al. (1998, 1999), and much more variable than that produced by the code McIntyre archived for McIntyre and McKitrick (2003) (see #36). What we do say is that our results support the IPCC conclusion about the temperatures of the last decades of the 20th century.
Actually, I thought your use of language was much more measured and reasonable than MBHx. In fact I almost said as much one day. The problem, Dr. Juckes, is that the damage of faulty language has already been done. Any time a warmer wants to say the current warming trend is “unprecedented”, they merely point to MBHx. If a skeptic argues that the trends and levels reported in those papers are not credible, the warmer will point to Juckes et al. and say it shows the same thing. “Moving on” with “independent” evidence. The fact is you don’t need to use the word “unprecedented” because Dr. Mann has already done so. So don’t be offended. It’s nothing personal.
I don’t necessarily find the statement “trees are not thermometers” offensive. What I find offensive is the context in which the statement is embedded, i.e. your writing. Your latest contribution, for example. You ask:
The answer is, umm, obviously, “no”. But I suppose this is a rhetorical question. Seems to me it’s a device, designed to dodge the substantive issue of the bcps.
But I could be wrong. So prove to me that the other proxies are not window-dressing. Prove to me that the bcp’s are not driving the show. Prove to me that all these reconstructions are not highly DEPENDENT on the bcps. Dependence. Not “independence”. (It occurs to me that “the team has a dependency problem”. Can you cure my skepticism on that one?)
Maybe after discussing this we can talk about the MWP and HONEST temperature reconstruction? (That is, unless YOU are offended by the topic of “trees as thermometers”.)
Re 48: If you accept that all proxies have problems, why are you singling out the bristlecone pines?
re 48: Our paper wasn’t written for a target audience of heating appliances: what do you mean by “a warmer”?
#50 Martin
I appreciate your attempt at humour. It’s always welcome and appeciated on this blog. Back to the serious stuff. You still haven’t answered my question. Why as head of the Atmospheric Science Group at RAL are you conducting proxy temperature reconstruction studies? Given your last reply on another thread, what is your contribution to the development of the UK’s climate computer models which at your own admission is funded by NCAR (not your paleoclimatolgy studies)? I’ve also previously asked you whether or not in your day job you have any dealings with Isaac Held and Brian Soden? As an ‘atmospheric scientist’ in not reasonable I think to expect you to.
KevinUK
#51
And Martin
As an atmospheric scientist and also paleoclimatologist supporting the Euro HT, I wondered whether you fancied a change of job in the coming new year? I’ve heared Here that they are looking to build up a climate research team at Exeter University headed up by Peter (“Day of the Trifidds”) Cox. Looks right up your street. Failing that given your relationship with the NERC it looks like the Centre for Ecology and Hydrology will be looking for a new Director come April 2007. If you get the job then at least I’ll know that my ‘green’ taxes will be going to a good cause and also if you do, make sure you give my regards to my old mates at Winfrith.
KevinUK
Martin Juckes:
Just to clarify that point about RMS (I haven’t a copy of the paper in my possession) – are you saying that the RMS calculated was RMS error? And if so, what did the paper refer to (RMS?)
Re #50
Dr Juckes asks “what do you mean by a ‘warmer'”? A warmer is the shorthand opposite of a “cooler”.
What’s ironic is that CA is not populated by a bunch of “denialists”. Data suggest we are populated by a bunch of lukewarmers! Here is a tally so far of my public opinion survey:
Q: On the A in AGW: What proportion of the 20th century warming trend do you think is attrubutable to human-caused greenhouse effects? What’s your estimate for the uncertainty, àŽⲬ on this parameter, A?
poster date A ± àŽⲉrange
BrooksHurd November 22nd, 2006 at 9:07pm 0.3 0.1 [0.2,0.4]
pat November 23rd, 2006 at 12:56pm 0.2
Reid November 23rd, 2006 at 10:27pm 0.02 0.01 [0.01,0.03]
WillisE November 23rd, 2006 at 11:12 pm 0.3 0.25 [-0.1,0.4]
bruce November 24th, 2006 at 1:21 am 0.05 0.2 [-0.15,0.25]
ChrisH November 24th, 2006 at 2:14am 0.3 0.3 [0,0.6]
beng November 24th, 2006 at 10:43am 0.2 0.1 [0.1,0.3]
The mean for “A”, so far, is 0.2.
Ans: According to CA, 20% of 20th c. warming is due to human GHG sources.
So, to Dr Juckes question what is a “warmer”, I would half-reply: “a person who believes A is much greater than 0.2”.
Keep those guesstimates coming in. At some point I’ll ask the same question over at RC. Then we can fully reply to Dr Juckes thought-provoking query.
Care to play our guessing game, Dr Juckes?
They are different versions but they are from the same site, Tornetrask. Your “rule” – using the most obsolete – is a ludicrous rule. Can you provide a methodological reference for the selection of that rule?
Re 51: First a correction: I don’t know if I typed “NCAR” (which is a US research centre), but if I did, it should have been “NCAS” (which is in the UK). I have occassional interaction with Isaac Held on the topic of baroclinic equilibration (the question as to how the level of storminess in midlatitudes responds to changes in the large scale temperature gradient).
Re 53: RMS is not referred to or used at any point in the paper. It is used to normalise curves in two figures in the supplement.
Re 54, 55: I wouldn’t like to guess. This issue is not addressed directly by any of the work I’ve done. I can’t see any reason to disagree with tthe IPCC 2001 statement that more than half the recent warming is anthropogenic.
Re 56: Could you publish your demonstration of obsolescence?
Re #57:
Mind stating your reasons for agreeing with the statement?
#58
To be fair to Dr. Juckes, he didn’t say he agreed with the IPCC’s statement – merely that he would not disagree with the statement. Those are two different assertions. His answer, taken at face value, was that it was outside his particular expertise so any response would be a guess.
Dr. Juckes:
Regarding the selection of which series to use when more than one is available from a single site, you have chosen to use the “first used”. Another possible choice might be to use the “last used”. To your knowledge, is there any reason why the former choice would be better than the latter, or would a reconstruction using the latter choice be equally valid?
Really? Maybe I’m misinterpreting his statement, but when I eliminate the double negatives, it changes to “I have every reason to agree with the IPCC 2001 statement that more than half the recent warming is anthropogenic.”
Sorry, my last post was in response to #59. I hate the inability to edit posts.
#57 Martin
Thank you for answering part of my question and for correcting your original error (repeated by myself) that NCAR should have in fact been NCAS. Now could you answer my full question. Why as head of the Atmospheric Science Group in RAL are you conduciting paleoclimatology studies specifically the evaluation of proxy temperature reconstruction studies? As I hope you’ll appreciate, as a UK taxpayer I am concerned about how my taxes are being spent (I’m sure you are as well). I’m therefore puzzled as to why RAL and specifically the Atmospheric Science Group of RAL are being funded to conduct paleoclimate studies? I suspect that I know the answer but I’d like you to confirm it. Steve in another post has eluded to the fact that when giving his presentation at KNMI (where you will be presenting in December) that he spent some time with Nanne Webber who referred to you as ‘the Euro teams’s statistics expert’? Are you? I undetsand that you are an Oxford University maths graduate but did your degress include maths with stats? As a UK taxpayer, i have no objection to funding and independent study of the methodologies used by paleoclimatologies within the UK. However I don’t think that RAL is the organisation to do this and certainly not someone who is the head of the Atmospheric Science Group of RAL.
I would instead have preferred if such a study had been done by someone with proven eminent stats credentials who is independent of the climatology field which you clearly are not. Please note that this contrasts significantly with the US situation in which Edward Wegman was given this task. I am also disturbed by the fact that as you are a member of the Green Party, that it would be difficult for you to carry such studies impartially.
KevinUK
# 61 / 62
I do not believe the IPCC is a big conspiracy, but I do believe that scientists doing their niche work in climatology have ‘faith’ of a sort that scientific methods, ‘skill’, integrity, and peer review of their community mean that the IPCC assertions are more likely correct than not. [Which is why revelations Re: Mann are so shocking to many…] This ‘faith’ in our common man is not unique to science. Society couldn’t progress without it. I apply this thinking to Dr. Juckes, without questioning his motives or honesty, when interpreting his assertion.
‘I can’t see any reason to disagree’ with my granting him the benefit of the doubt when reading his statement: 1) He has ‘faith’ that other skilled, peer-reviewed scientists have figured everything out about as well as possible, 2) He believes IPCC has completely and correctly synthesized the current state of understanding on climate, and 3) Nobody has placed a hot, smoking gun in front of his face that is so compelling it would lead him to question the other niche science on his own, 4) So he has no reason to question the IPCC assertions. I may be being more generous to Dr. Juckes than I should, but I’d rather keep him in the lion’s den w/ Steve M. and company than chase him out.
Re:#63
KevinUK,
I’m disappointed to see such a post here on ClimateAudit. Surely all that matters is the scientific correctness of a work, not petty bureaucratic jurisdictional issues, or a scientist’s political party affiliation! Do we really want to introduce various litmus tests on who is “allowed” to perform scientific work, or on who is “allowed” to collaborate with whom?
Taxpayer issues, of course, should be directed to the relevant government(s).
#65, Armand
And in due course once Martyn has answered my questions they will be.
I make no apologies to anyone for the fact that I consider AGW to be politically inspired and funded in the UK. This is a matter of record. As a UK taxpayer I have a right to ask these questions no matter how uncomfortable this may make some people feel on this blog. If the AGW debate only involved the science then I wouldn’t be concerned but as many here know and I hope you yourself will at least acknowledge AGW is a highly politicised arena in the UK. In the US they have had the good sense to reject the Kyoto Protocol, in the UK I face the prospect of having to pay further taxes to pay for yet more paleoclimatology studies, and for faster supercomputers for the Hadley Centre to run their computer models on, and more taxes so that yet more academics can set up more climate research centres as part of the Tyndall centre etc etc. I’m sorry but NO! Definitely NO! And definitely not until the data, methodologies, computer source code etc on which these alarmist claims of future dangerous climate change are based has been released so that truly independent people like Steve and Ross can analyse it and as I suspect, as they have done with MBH98 etc, demonstrate that it is does not stand up to scrutiny.
KevinUK
Re: #66
Of course you can post here anything that Steve will tolerate. I don’t see this as an appropriate forum for taxpayer issues, but I suppose we can agree to disagree on that.
I am pleased to see that you didn’t disagree with anything in my first paragraph, which described my main concerns. It would have been sad to see CA go down the RC road of guilt-by-association.
OK. let’s leave this. Kevin, you’ve made your point; you know that you won’t get an answer.
#68 Steve
I have a great deal of respect for you and Ross. Consequent I will respect you advice and now drop this issue. However I did promise at the start of the ‘Potential academic misconduct…’ thread that I would write to Martyn’s funder BCAS if he did not withdraw his slur against you from his CoPD report. As yet he has not agreed to do this and as I now have enough information to support my letter, I will now desist.
KevinUK
I have completed the first draft of the compendium of problems found in the MITRIE paper. It is available as a zipped Word file here, and as a PDF file here.
I invite everyone who is interested to read it and comment on it. I have tried to be as clear as possible, but I am not 99.98% sure that I have achieved this goal, or that I have fairly represented the arguments made by others on this site.
This should likely be a new thread, so we can collect all of the comments in one place and I can modify the document accordingly.
My great thanks to everyone for their past (and hopefully future) work on this review project.
Best to all,
w.
RE #70. Willis. A sterling effort. Some brief comments from an initial read.
1. It would be helpful to use an outline heading numbering system, and add page numbers, to facilitate reference and comments.
2. There are some missing words that reduce the power of your message.
3. In your discussion on the relationship between tree ring thickness, you introduce the idea that growth is a function of other factors besides temperature (clearly true) but you miss the opportunity to address the point that there is an inverse quadratic relationship between temperature and growth (ie growth is subdued at low temperatures, increases as optimum conditions prevail, and then reduces again with higher temperatures).
Willis,
Didn’t get through it all, but here are a few notes:
I don’t see any requirement that temperature proxies are selected for Jukes’ study. If the study only requires that the proxies extend from 1000AD to 1980AD, then couldn’t a proxy of the percent of pirates in the population also suffice? Surely the proxies should be screened to verify that they actually reflect the local temperature for a calibration period before being included in the study. To me, this is the foremost glaring error.
I think your point about over-weighting certain regions will not resonate with the tele-connection believers (actually, if one believes in tele-connections then global or hemispheric coverage should not be important at all). The retort will be that you don’t understand something about SNR, etc… etc… I think there are many more fruitful arguments to make other than hemispheric/global coverage.
RE#72 Nanny,
I agree, the over-weighting of certain regions is not worth arguing. However I do think that the lack of correlation to local grid temperatures and the resulting residuals are worth talking about. How does one make white noise from the residuals?
Also, although there might be a valid argument for climate tele-connection, there is no known reason to believe in ‘Plant- telepathy’, which would be required, given the lack of local grid temperature correlation.
Willis: I think you dropped a word here:
Also, David Black, a published specialist (Science) in G. bulloides, has pointedly [??????] the use of G. bulloides off Venezuela as a proxy for temperature, as he considers it a proxy for trade wind strength.
Bruce, thank you for your quick comments.
Done.
Let me know which ones.
Excellent point. I have added a section to detail this problem.
Many thanks,
w.
Cliff Huston, I appreciate your contribution.
While this is an interesting point, it opens up the whole question of data-snooping. If we pick only proxies with a decent correlation to local gridcell temperatures, what is to say that this correlation is not purely by chance? How can we provide adequate error analysis if we are using a selected group of proxies? I am interested in everyone’s comments about this question, as I do not know the answers.
While global/hemispheric coverage is not required, it throws off the results if we use multiple proxies from one area. While it is not a major point, it is a valid point.
My best,
w.
Cliff, you say:
Thanks, I’ve fixed it.
w.
New versions of the MITRIE review posted incorporating the above comments:
Word
PDF
w.
#75 Willis,
That was nanny (#72) – but you know that by now.
I agree that global/hemispheric coverage is a valid point, but grid cell correlation/residuals and plant telepathy sum to a major logical error. Given that your ‘short’ comment can’t go on for ever, I was suggesting (in #73) that your minor point should be replaced with that (IMHO) major point.
Hi Willis,
It’s a good start, but it needs some organisation (note also that the formatting is all over the place in the most recent version).
I suggest it needs to be organised as a series of themes (e.g. problems with proxy selection, problems with model etc.) These should probably be ordered in terms of the order they are enountered in the Jukes paper. Each section should start with an introduction providing the context, the discussion, and a conclusion stating how the discussion is problematic to the paper’s findings.
As it stands, your critique comes across as a series of nit-picks, requiring informed knowledge to relate the criticisms to the substance of the paper.
Finally, you should strip out some of the irrelevant parts (e.g. Mann and the calculation of R2) and anything that talks about “motive”. Also, the slur on SM re code archiving requires only a sentence, noting that it is inaccurate. In general, I suggest you make the critique as disapassionate as possible.
Fantastic that you’re doing it, BTW!
New versions of the MITRIE review posted incorporating a new section 119.1 regarding correlation and teleconnection (thanks, Cliff), and additions to section 57 covering the “U” shaped response of plants to temperature (thanks, bruce):
Word
PDF
w.
Good work, Willis! Some comments:
I would remove 133.
138 is the important one. 1) A1:’Unfortunately, the error characteristics of the proxy data are not sufficiently well quantified to make the choice clear.’ Why they are not quantified??
2) There are a lot of publications that discuss the calibration problem (Brown, Sundberg, Krutchkoff, etc) Equations in A1 and A2 (before the scaling step) can be found from those publications. CVM is not mentioned. The performance properties of the calibration estimators have been extensively investigated in the literature, but no references can be found from the appendix.
James, your comments are good. You say:
I like the “themes” idea, but I don’t think it can be organized in that particular way, because the themes are not separated in the original paper. However, I will write an introduction to each section along the lines of what you suggest. I’ll clean up the formatting on the final version.
Hmmm … I don’t think any of these are “nit-picks”, and I am assuming that the authors will have the required “informed knowledge” to relate them to the paper. Perhaps you could be more specific about the examples.
Their paper is supposed to be an “intercomparison and evaluation” of prior millennial reconstructions. How can the abysmally low R^2 of Mann’s paper, and his attempts to hide it, be irrelevant to that?
On the other hand, I do agree about “motive”. Since I did not use that word in the document, perhaps you could list the parts you find objectionable.
Finally, the slur on SM is a very important point. They are accusing him of doing what some of the co-authors have done. This is untrue, unwarranted, unethical, and perhaps actionable, as they are trying to destroy Steve’s credibility. The claim they are making is “How can you believe Steve M. when he says that researcher X is hiding data, when he’s doing it himself?” I find this to be appalling scientific misconduct, and have no wish to make it into a single sentence. I want that part out of their final report, it has absolutely no bearing on the subject. Or, if they want to leave it in, they need to be accurate about what happened, and include the misdeeds of their co-authors as well.
I brought this point up on CoP, and they just blew it off, so I’m repeating it in (figurative) bold type in the review.
You’re more than welcome.
w.
Hi Willis, thanks for your post. I’ll post a substantive reply tomorow.
Willis,
I neglected this in my earlier posts, but I very much appreciate the work you are doing on this document.
Thanks!
PS: To have a focused review document, I would suggest that you use Juckes section titles (with page ref.) for your major section headers and use your headers below that for sub-subjects that relate to the Juckes section. The authors will know what you are addressing (whatever the organization), but it will make the document more effective if the editors and other readers can follow.
Thanks Willis! Here are some of my suggestions (I’ll comment more if needed, just let me know):
74. The real problem here is that the assumptions on error e are not specified in the paper. It is said in the paper that the proxy noise is “independent between proxies” (i.e., spatially white) but nothing is said about temporal structure (i.e., autocorrelation).
a) Since the noise structure is not specified, it cannot be evaluated if the model is realistic. I.e., we cannot say that, e.g., model specified in 78., is better/worse as model in 78. as the submodel of 78. could be written as 75. with certain assumptions on the error e in 75. So one really needs to specify the error structure in Juckes’ model.
b) All claims about “optimality” of any statistical procedure depends on the specified model. If the model is not specified, one can not claim any optimality and/or compare different methods. This is crucial for the CVM method on p. 1028, which is claimed to be superior on the standard inverse regression (LS) solution on the same page. One simply cannot make this kind of claims without clarifying i) the model and ii) in which sense the optimality is claimed. Furthermore, a proof of the claimed optimality (or a reference of the fact) is completely lacking in the manuscript.
78. Hmmm… I would vote for the multiplicative model , but 78. is ok too.
115.-118. The reason why “benchmark.txt” (random walk) outperforms CVM and the reason why Juckes’ simulations (AR(m), AR(1)) perform so poorly (Table 3) is the flipping. In order CVM to work, it needs a) linear proxy model and b) positive correlation between temperature and the proxies. Now, apparently in Juckes’ simulations he did not make sure that his simulated proxies correlate positively with the temperature. If there is about half of the proxies correlating negatively and half correlating positively, they “cancel” each other, and the correlation is bad. In the INV-method, flipping is not needed as the inverse regression takes care of that automaticly (which also means that one can not argue that flipping should not be perfored in CVM).
Related to this (and to PC flipping) is that in the Union CVM reconstruction the Chesapeake series (negative correlation with the NH temperature) was flipped. This was not reported in the text and the flipping seems to be also missing from the code. The Union-CVM reconstruction with unflipped Chesapeake series reduces considerably the performance of the CVM-Union. Moreover, the fact that this series was flipped, indicates that the authors realize the need of adjusting the series.
I’ll post here, if something else comes to my mind.
Willis: great review. I can’t think of anything you left out.
Thanks much to Willis E and all those posters making review comments on Willis E’s critique of the Union Reconstruction. I find that such efforts help me (and no doubt other laypeople reading at this site) better comprehend the underlying principles involved and summarizes some important discussion that have occurred at this blog (and summaries are something I think this blog can use more of).
I think the best case scenario for presenting this critique as part of the pre-publication review process is that it can provide some information, viewpoints and approaches that might not otherwise be presented and perhaps make any of the unaware a little more aware.
Call me cynical, but at this point, I judge that a scrupulously polished and totally non-controversial review with the POV expressed by Willis E (and many at CA) would not pass acknowledgment muster with the publishing powers that be. The aim should be to present information that can be recollected in a future and less controversial time and in such a way that an immediate dismissal cannot be rationalized and a thorough reading is encouraged. I think Willis E has accomplished that, but I say that as a civilian and not an in–goal defender of the Hockey Team, be it the NA or EU version.
Jean S, thanks greatly for your substantive comment. I am much more interested in the substance of the review rather than the form, style or layout of the paper, although both are important.
You say:
Yes. For the CVM method to work, the noise needs to be spatially and temporally white. If it is not, then there is no guarantee that the noise terms will cancel in the CVM averaging process. It also strikes me that for the method to work, in addition to the autocorrelation question you raise above, the variance of the noise needs to be constant over time. It seems like we should be able to determine if that is the case for the selected proxies, although I’m not sure exactly how. Comments?
Yes. They base their optimality claim on a comparison between INV and CVM results, not on theory
Upon reflection, it seems to me that neither , nor
, nor  , is actually the case. Chuine quotes Pisek’s photosynthetic activity curve as being of the form:
which is not captured in either model
Therefore, it seems to me that the actual model should be something on the order of:
or
or somesuch.
Your comments on this greatly appreciated.
Excellent. This is a most clear and cogent analysis of the issue with the flipping of proxies. CVM requires that there be a positive correlation in order to work. I will revise that section of the review.
Good news. There are a number of people who contribute here whose work I always look forward to reading, and you are definitely on that list.
w.
Aren’t all these “T”‘s in your equation “Growing Season Daytime T” (Tgsd)? I think that adds a further complication to the equation.
Worth noting that my multiplicative growth model was, by design, a first-order statistical model. Not because growth is a first order process, but because you have to keep the number of terms low in a statistical model if you have limited degrees of freedom available for estimating the various effects. Fact is rarely do the higher-order quadratic and cubic terms add much to a growth model’s significance. That’s what parsimony buys you.
Hi Willis
I guess what I mean here is that it’s important to emphasise the substantive parts (ghost of TCO here). I’ve always felt that Steve M’s work was muddied somewhat in earlier years by the variety of statistical horrors he uncovered in MBH. I would put most effort into the really important parts, relating them to Juckes’ conclusions.
I think maybe a sentence describing how the MBH reconstruction fails R2 as reported ny W&A, not discussed in the Juckes et al review. I don’t think what Mann might have done is relevant to the Juckes paper.
I can’t find the example I was thinking of, it may have dissappered between the first and second version.
I agree with you willis, but for the CoP post I think it should kept to an incorrect statement (and an incorrect citation, for that matter).
#88
If the noise cancels completely in the averaging process, then CVM and classical calibration estimator become equal, because then
  . But if any noise left, it will make CVM to underestimate the temperature variations. I’ve been trying to understand where that square root term in line 13 in A2 comes from. And I think I’m almost there. See (1), they used small-disturbance asymptotic approximations to obtain asymptotic bias of the classical calibration estimator. If Y is the temperature to be estimated, and calibration data (x and y vectors)are zero mean, the bias can be expressed as :
Note that the bias approaches zero as the calibration data (size N) increases. The bias is relative to temperature, so some kind of scaling might help, rewriting the bias:
So we can try to get an unbiased estimator by using
Now just forget some betas and N from the correction, and remember to take square root as well, and you have CVM!
I think we’d better leave this out from the report, just FYI 🙂 I’m not even completely serious. But anyone interested should read the reference:
Ref1: Sristava and Singh (1989) Small-Disturbance Asymptotic Theory for Linear-Calibration Estimators. Technometrics, August 1989, Vol. 31, NO. 3
Willis, when is this review due?
Re: #93
“Open Discussion” on the website lasts until Dec 21st. I hope Willis will keep his compilation open through this week (thanks for your major efforts, Willis!).
I think there is one extra N in my equations. But no worries, when the authors respond to the review, we’ll get detailed derivation of CVM (or a reference to a paper that includes it). Or they find out that there is an error in their derivation, and the paper will be corrected accordingly or withdrawn. That’s how science works.
Steve M., I’ve been shooting to complete it by the 15th. Keep them cards and letters coming …
w.
For paragraph 78,
The paper assumes that the growth function G() is linear in average T. In fact the growth function is a complex non linear function (appologies for no Latex – I’m a MathML guy).
G() = integral over growing season of g(T, C, M) dt
Where G() is the annual ring growth, g() is the growth function and T, C, M are instantaneous values.
Before doing any statistical analysis, there needs to be some functional analysis, based on biological arguments, to determine the approximate shape of the function G() (for example, with other variables constant, the function will be an inverted U in temperature). The next step is to show that G() can be inverted and integrated to get a function for average T() as a function of G, C and M. Next a suitable approximation for T() needs to be proposed. Finally, based on the form of the approximation, the appropriate statistical tools can be chosen.
Because the growth function is actually U shaped in T, the invertability of G() is problematic.
Had one N too much, the line of equations should be :
And you can compare CCE and CVM with simple turn-key simulation:
http://www.geocities.com/uc_edit/cce_test.txt
To me it looks like there is an error in the unpublished CVM derivation, CVM scales the signal down. Or I have made an error, or down-scaling is a desired property of the estimator.
New versions of the MITRIE review posted. Cut down, reordered, reworked. Comments requested.
Word
PDF
Best to everyone, thanks to those who commented before.
w.
UC (re #92/#98): The small error asymptotic analysis of Sristava and Singh assumes normally (and i.i.d) distributed noise. The nonnormal case is covered in:
Shalabh and H. Toutenburg (2005): “Consequences of Departure from Normality on the Properties of Calibration Estimators”, Discussion paper 441, Universitat Munchen, Munchen, Germany (seems that a journal version is in press).
Click to access 48.pdf
The second author of the paper is also the second author of the book I’ve mentioned here a few times:
Linear Models (Springer Series in Statistics) by C. Radhakrishna Rao, Helge Toutenburg. The CVM-model related case is covered in Chapter 8.
For anyone seriously considering publishing yet-another-multiproxy-study, the compulsory readings should include also
Statistical Analysis with Missing Data, Second Edition, by Roderick J. A. Little, Donald B. Rubin
and
Analysis of Incomplete Multivariate Data (Monographs on Statistics & Applied Probability) by J.L. Schafer.
re: #99 Willis
It’s getting much better and more readable. Here’s one small section on p11 which has a couple of problems though:
IN the first section the “between… between” is clunky. I’d suggest either “between climate patterns in widely separated…” or “among climate patterns in widely separated…” depending on whether or not you think there are situations where more than two climate patterns are teleconnecting. The english pattern is “between” for two and “among” for three or more.
In the first sentence of 4.2.4 there are two things to be noticed. “…problem of… problems” is a sort of repetition I tend to avoid where possible. If you can, try to find a synonym to replace one of them. Also in “in any type of reconstruction methods” you need to be sure this is what you want to say. I think you want “in any type of reconstruction method” but I’m not certain. If OLR or CVM is counted as an individual method, you should use the singular. But if OLR is a term for a variety of methods then your phrase might work, though it sounds wrong anyway. One way to finesse things would be to say “in many types of reconstruction methods” (or use “all types” instead of “many types”.)
Willis: do you want to say anything about Juckes’ weird rms normalization?
It would be presumptious on my part to criticize the science, but offer my comments:
1) page two is blank. Is this intentional?
2) section 2. page four the term ‘CVM’ should be spelled out on first use before using the initials.
3) section 2 page five text reading .. This, of course, is the correct procedure (although it is not mentioned in the text and has not yet been found in the code), and results in the correlation seen in the reported results.
I suggest deletion of [results in] and use of [contributes significantly to].
4) section 3 1.1 sentence The NAS panel was quite clear about the not using Bristlecone/Stripbark in reconstructions.
I suggest deletion of [the] following …clear about.
Also suggest insertion of [temperature] before reconstructions.
5) section 3 1.1 second sentence I suggest insertion of [such] before the word proxies.
6) section 3 1.2 the sentence beginning The MBH1999 North American PCs have been 20
includes the number 20 which should be omitted or the thought fragment completed.
7) section 3 1.2.2.2 I suggest deleting the word [temperature] following Northern Hemisphere.
8) section 3 1.3.1 I suggest a direct citation of the Fisher paper in preference to an ambigous reference to climateaudit.
9) section 3 1.5 text ….this opens the door for speculation about the motives behind the selections. I suggest the deletion of [motives behind] and insertion of [basis for].
10) section 5 1.10 text… where G is the growth (tree ring width), and e is the error.
I suggest the insertion of [T is the temperature] before and e is the error.
11) section 5 1.11 text.. Thus, the problem of the “U” shaped response curve is cannot
I suggest the deletion of [is] before cannot.
I applaude your efforts to consolidate the constructive criticism.
RE 99:
Where’s your scholarship? There are no references.
I’m sure the authors will look at it. No one else is likely to read it to gain this valuable new understanding of your points in section 3.3 if you don’t show you have an understanding of the discipline by being familiar with the scholarship.
So, when you write The review was done by
a variety of mathematicians, statisticians, climate researchers, and members of other disciplines. you want to include those names so folk can audit their work (if anyone decides to read the paper after seeing there’s no scholarship; if this is going in Galileo, disregard).
Unfortunately the correlation of the UR with the NH data, while strong, is not significant because of the
autocorrelation of the two series. There is no need to say unfortunately. Fortune has nothing to do with experimentation or replicability or prediction.
A Durbin-Watson statistic of less than 1.5 indicates that there is no significant
correlation between two series. Reference here.
In order for this test to be valid, the proxies must be used in the same way as in the
CVM method. Reference.
For the CVM method to work, one implicit requirement is that the proxy results which have negative
correlations with the instrumental data must be “flipped” so that they have a positive correlation with the
instrumental data. reference.
One way to understand this is to consider 18 proxies, half of which have a strong negative correlation
with the data, and half of which have a strong positive correlation. reference or figure.
When you do so, you will find that the UR results are not significant. figure.
The NAS panel was quite clear about the not using Bristlecone/Stripbark in reconstructions. Huh? the lack of bp in reconstructions?
Your 3.2 entire section needs scholarship. Provide examples where this is done to support your assertions. E.G. question in 3.2.2.1 presumes there is a better method (else why would you ask the question [surely you aren’t ignorant of the discipline else you wouldn’t be correcting the paper]), so provide the better method.
3.2.3 – who cares. E-mail the authors. This section should be eliminated.
As there is no a priori rule for the spacing of the proxies, this opens the door for speculation about the motives behind the selections. This passage pushes the line for a scholarly paper. If you want this to be a scholarly paper, then take this out. Else leave it in and have your paper be not taken seriously.
The problem is that this clustering of proxies over-weights the regions in question. At a minimum, the
proxies in the same temperature gridcell should be averaged to provide no more than one value per
temperature gridcell. reference.
The validity of any given proxy for a given purpose depends on the processing which the proxy has
undergone. reference.
Clearly, because of the method of processing, this proxy should not be used in multicentennial
reconstructions such as the UR. reference. You’ll also want to quote the literature that finds multicentennial variations, which papers find smoothing over, say, 50-year filters and what they interpret that as meaning. That is: does the record show MC variations or no? You don’t say. this is a hole in your paper. Filling this hole shows understanding of the scholarship.
For example, it would be very useful to take the gridcell temperatures for the locations of
the proxies and, using CVM, see how well the actual temperatures do at recreating the actual NH data
record. reference. You’ll also want to explain what the literature says about your thought process here. That is: what papers find local micro variation and how does that show up in the record (hint: what does the paper in this reply** say about the situation, and how often does this happen? Read the paper given to you for the answer, as it’s covered in the scholarship). BTW, this provided paper in the other thread already knows about a lot of your points in this draft.
Your 4.2.3 shouldn’t have a correlation. Check the scholarship as to why.
Your 4.2.4 should quote the scholarship as to when this is done, when it is not done, why it is and is not done. You need to read up on this bit or expect to get hammered here if someone reads this paper after seeing the lack of scholarship.
Subsampling is the practice of dividing the proxies into different groups, either by type or randomly, to
see how well they perform. reference for when this is done eg: (Fritts 1976, Briffa 2005).
4.2.5 This should be the point of your paper. I suggest actually reading the literature and finding papers that do this, discuss their r^s or Ts and go from there. Contextualize the important papers that do this with this particular paper and contextualize its importance compared to others.
The CVM method depends on normalization of the individual proxies. To do this requires
estimator of the variance of the proxies over the calibration and verification periods. reference.
4.3 So what. E-mail the author like everyone else on the planet does if you are hindered. here’s the template: “Hi Dr J. My name is W.E. and my creds are x, y, z. I’m doing a review of your paper for reason q and I’m wondering if you’d be kind enough to provide me with a, b, c. Thank you so much and I appreciate the work you are doing.”
The response model for tree rings is assumed to be of the form
G = T + e
where G is the growth (tree ring width), and e is the error. reference
In fact, however, the response of trees to the environment is much more complex, being of the form:
G = T + M + C + T*M + T*C + M*C + T*M*C + e
where M is moisture, and C is CO2. reference
Dr. Juckes has stated that this is not a problem because “The data used in our study are selected from
sites where temperature is expected to be a growth limiting factor.” reference
Plants do not have a linear or even a quasi-linear growth response to temperatures. reference
Instead, they have an upside-down “U’ shaped response to temperature. reference
They grow fastest at an optimum temperature, and grow more poorly if the temperature is either higher or lower than that temperature. reference
Sect. 7: unless you are writing a polemic, drop it. If you purport to write a scientific paper, this doesn’t go here. If this is going in Galileo, disregard. Harken back to your little exercise on that public peer-review thing and the confused reception you got there and take a lesson home.
Outta time for today and anything more than a cursory review. That should be a good start for you.
Lotta work ahead!
HTH,
D
** http://www.climateaudit.org/?p=955#comment-73697 can’t make that work in HTML.
re #104: Do you have a fixation with “scholarship”? Have you ever done any review for any scientific journal? Dano, it’s a review, not a paper submission. If you don’t understand the difference, shut the f*ck up.
Dano,
While you have some useful suggestions, you are aware, aren’t you, that this is intended as a summary of the points discussed here concerning the paper posted for open review by Jukes et.al.? I’m not certain what the requirements are for literature citations in reviews, particularly open ones. But I’d think they’re rather less than that for an actually published paper. That is, the purpose of this sort of open review should be to provide the author(s)feedback so that they can improve their paper or possibly withdraw it if major flaws are found. Thus you have provided a “review” of Willis’ “review” of Jukes proposed paper and haven’t provided any citations except as an example.
Now, I haven’t checked, so I’m not sure what guidelines are provided for potential reviewers. This would have been, for instance, a good citation for you to provide in your post above if such citations are to be de rigour in such things. Still, I’m sure Willis will thank you for your contribution.
Why would I need a killfile?
RE 105:
Do you have a fixation with “scholarship”? Have you ever done any review for any scientific journal?
Thank you Jean. Here are some examples of different types of reviews across different disciplines, found in scientific journals:
http://mmbr.asm.org/cgi/content/abstract/56/1/152
http://arjournals.annualreviews.org/doi/abs/10.1146/annurev.phyto.35.1.235
http://www.sciencedirect.com/science?_ob=ArticleURL&_udi=B6WSN-418PWYT-4&_coverDate=06%2F13%2F1997&_alid=507735707&_rdoc=1&_fmt=&_orig=search&_qd=1&_cdi=7051&_sort=d&view=c&_acct=C000050221&_version=1&_urlVersion=0&_userid=10&md5=b8742bcf7f011a0137459842c5f1deef
http://md1.csa.com/partners/viewrecord.php?requester=gs&collection=ENV&recid=2325795&q=&uid=787119725&setcookie=yes http://www.jcb.org/cgi/reprint/124/1/1
http://md1.csa.com/partners/viewrecord.php?requester=gs&collection=ENV&recid=3889876&q=&uid=787119725&setcookie=yes
http://intl.sciencemag.org/cgi/content/abstract/279/5350/519
http://intl.fasebj.org/cgi/content/abstract/4/11/2868
http://arjournals.annualreviews.org/doi/abs/10.1146/annurev.biochem.66.1.475
[sorry, HTML troubles again…perhaps the URL length too long for tags?]
‘
Notice a similarity Jean?
…
Good job!! You see that they are all similar in that they all have an understanding of the subject matter! It’s true: all these reviews explain the subject and quote the important literature.
IOW: if you are reviewing a paper in a field you know nothing about, who cares? Because no one has the time to waste to read something by someone who can’t speak to the issue. I’m sure dubya is hard at work right now, because he understands the importance of this omission.
*heart*,
D
re: #108 Dano,
Very funny! I’m sure you were aware that there’s a difference between a literature review and a review = critique of a paper. But good try.
#104 these are the rules for comments:
here
[Sheesh I hate it when someone comes into the end of a project or conversation they have not participated in, then on top of it start bossing people around.]
Willis you rock.
Re #105
Jean S.,
If the bomb-thrower isn’t on topic then do ignore him. Please do not resort to unsavory language, no matter how well or poorly it is censored. The rules of discourse apply to us all.
Kind Regards,
Earle
Dano, there’s a few valid points in there, for which I thank you. As several people have noted, as this is a review, the level of references required is different from a journal paper.
In addition, many of the things you think require references are so obvious as to be unreferenceable … good word, huh? For example, the idea that a Monte Carlo simulation must use the same procedures as whatever you are simulating. You think this requires a reference is undergraduate stuff. I think that if you don’t understand this point, you haven’t understood Monte Carlo simulations …
In any case, Dano, since you have not participated in the review at all up to this point, I fear I will simply ignore any further posts for you on the topic. After all, you haven’t provided me with any references to show that we ought to pay you any attention …
w.
Hmmm … last one should read:
“You think this requires a reference, but it is undergraduate stuff.”
Preview is my friend … preview is my friend …
w.
Re:#104
I found this to be the funniest:
Reference.
Re:#109
Dave, you’re spoiling the fun!
Dano, there’s a few valid points in there, for which I thank you. As several people have noted, as this is a review, the level of references required is different from a journal paper.
In addition, many of the things you think require references are so obvious as to be unreferenceable … good word, huh? For example, the idea that a Monte Carlo simulation must use the same procedures as whatever you are simulating.
Thank you willis. You are welcome for the advice. I must admit I just saw your .pdf and clicked on it & started commenting during lunch.
‘Unreferenceable’ isn’t right- ‘not needing reference’ is better. But, e.g., if you want to reinforce your point you should show where someone screwed up before (contra) or did good.
But, hey, I just gave some unsolicited advice to help blunt the ‘tude. I’ll sit back and watch the show if you’re going to leave that…constructive language in there – it was oh so effective last time. Good luck with that.
Best,
D
While it is true that a peer review is not a scholarly paper, such that references to authorities are typically not required, and while it is true that many reviews are more acerbic than this one by Willis, Dano is nevertheless right to criticize the unprofessional tone and the lack of documentation. This is, after all, NOT a review by an established peer. There is much work to be done on this review if you want it to have impact. A review, above all, is not a list of complaints, but a critical analysis of the paper’s arguments. When there are many faults it is important to distinguish between major flaws vs minor errors vs. suggested improvements.
All of Willis’s arguments are more or less supportable. Dano is simply stating that they haven’t been adequately supported as of yet.
I suspect Dano does know the difference between a manuscript review and a literature review. And if he didn’t before, well, he does now.
Whatever the rights or wrongs of Dano’s comments, it is abundantly clear that there are sufficient concerns and reservations about Dr Martin Juckes’ paper to suggest that he should take the comments seriously, or otherwise take the risk that his work is characterised as “further sloppy ‘science’ by the Hockey Team”.
As the hit numbers at this site suggest, a lot of people are visiting this site now, many of whom will be influential people ‘lurking’ rather than showing their hand. With every new paper being questioned on sound scientific grounds, the standing of the HT and the AGW hypothesis comes more and more into question.
What is most amazing about all this is that all that CA and its supporters are doing is providing the questioning and challenge that science requires before work is accepted as proven. In the process it is increasingly clear that both the proponents and the peer reviewers are rapidly losing credibility, especially as they continue to obfuscate, hide data, fail to respond to legitimate questions, fail to explain their assumptions* etc. It must be rather uncomfortable for them to be exposed to the sometimes harsh scrutiny of the blogs. However, so long as they continue to engage in poor practice, misapply statistics etc, they can expect to come under increasing scrutiny. The reality is that this is how science will increasingly work in the new information age.
Another thing that is becoming increasingly clear is that the corpus of peer-reviewed papers in Climate Science is increasingly doubtful. The only real response to this is for the sceptics and dispassionate climate scientists to address the questions in a scientific fashion, and hopefully produce quality peer-reviewed papers that counter the
‘advocacy group think’ that characterises so much of the HT work. Steve McIntyre’s comments about some of the younger emerging climate scientists who presented at AGU is most encouraging in this regard.
*Something is happening here, but you don’t know what it is, do you, Mr. Jones?
#104
Reference. No, wait, I might have it:
Mann, M.E. et al, Robustness of proxy-based climate field reconstruction methods, 2006 (accepted).
It will answer to all our questions (and all other issues raised by Cubasch, Von Storch, Zorita and their collaborators). Too bad we wont be able to understand the answers, because we are not familiar with the scholarship.
?? Can you give a good reference? A paper that mentions overfitting in the context of proxy reconstructions?
bender, you say:
Look, that’s why I’m putting this paper out here on this site, so that the arguments can get adequately supported and the language refined. It doesn’t help, though, to say “there is much work to be done”, or “it’s not adequately supported”. Give me details, give me exact references to put into the review, suggest changes to the language, tell us exactly what the paper needs.
As just one example among many, Dano says we need to support the idea that a Monte Carlo simulation should match the original experiment – that if the proxies are flipped, the pseudo-proxies should be flipped. Me, I think that’s too obvious to need a reference. But what do you think? And if a reference is needed … which one?
I was a bit hard on Dano, mostly because he has jumped in at the end of the game. But Dano, to his credit, has listed exactly the points that he thinks need references or work. If everyone does the same, and supplies the exact reference(s) that are needed, we can get this paper into shape in short order. I don’t have volumes of statistics texts, nor a good local library. I am depending on the folks who do have such things to supply us with chapter and verse.
I have been assuming that the basic ideas, like that a “p” value has to be less than 0.05 to be significant, or a Durbin-Watson statistic has to be more than 1.5, would not need references. Dano says that they do … and upon further reflection on the various interesting claims and errors made by the MITRIE authors, he may be right …
w.
For people who have grandiose ideas about the quality and scholarship of peer review, here are our reviews at Nature. http://data.climateaudit.org/correspondence/nature.referee.reports.htm There’s no scholarship or references anywhere – for favorable reviews or unfavorable reviews.
I’m going to make the somewhat startling comment that Dano has given good constructive criticism to Willis’ review that should be taken into consideration.
Whatever is the world coming to?
I would be surprised if there was an explicit reference for flipping the proxies to match the exact method used by the CVM in the Monte Carlo experiment. It is, to my mind, self evident. It is one of those things that follows so logically from the premise of Monte Carlo experiments that to write about it explicitly would be to invite a reviewer to say “Duh! Tell me something I didn’t know. Reject.”
Notwithstanding that – the best place place to find some sort of reference would be in an introductory textbook that discusses Monte Carlo experiments. I don’t have one of those.
Critical values for DW statistics can, however, be found in practically any textbook. I’d recommend Hamilton (1994). It also has critical values for DF and ADF tests which can also be used for Engel-Granger cointegration tests. Once again, these are things that are found in textbooks, not papers, because they are so well established – at least in econometrics. If you feel like it you can always trace them back to the original papers.
As for the level of referencing typical in a referee’s comment? I barely put any in to mine. Some papers are so bad that there is no point trying to back up points of logic with explicit references – it’s too paintful. Most are generally good enough that you would usually be recycling references that already exist within the paper itself.
In this case, however, because the comments come from outside the field, so to speak, a lot more referencing would seem to be indicated. Notwithstanding that, the kind of references you want are the ones that Steve has already mentioned – Granger and Newbold (1974) for example. (And Engel and Granger (1987) if you want to make the cointegration point, which I understand is not for the faint hearted, but is the same as the DW statistic point.)
Dr Juckes.
I have been lurking here, not saying much, hoping that you can come up with robust science that counters the skepticism that we see here from the denialists. I have to say to you though, that it seems to me that, in the area of public opinion, you are losing this debate.
Those of us seriously concerned about AGW need real climate scientists (of which I note that you claim to be one) to step up to the plate with incontrovertible science in support of your arguments. This vapid response that I see from you and other members of the Hockey Team simply does not cut it.
I am beginning to think that you are not up to the game, and that we need to bring some of the other RC scientists into the game. PLEASE DO SOMETHING. We have a very serious issue here. We cannot afford to allow these CA denialists the upper hand.
Steve McIntyre: You say “….. here are our reviews at Nature. http://data.climateaudit.org/correspondence/nature.referee.reports.htm There’s no scholarship or references anywhere …..”.
I don’t actually see much evidence of normal standards of ethical behaviour in this posting (120). I always thought reviews were in confidence between the reviewer, the author(s) and the editor(s). But perhaps I came to the wrong site for ethical behaviour …..
John A:
I have to strongly disagree. I do not see any constructive in Dano’s comments. Only thing I see is lack of undestanding what a review of a paper is, and especially what this review is or is not. Furthermore, I’m seeing a deliberaty act of trying to downplay Willis’ work and disturb the process here.
Dano is talking about references. Not only they are in funny places (as UC pointed out), they are not really needed. The paper under review itself lacks completely references to any appropriate literature where its methods (CVM in particular) and the model are coming from. This would be alone enough to get it rejected from any statistically oriented journal. Moreover, it is not reviewers’ job to make an “airtight case”: it is the authors’ job. Reviewers are mainly pointing out the possible flaws in the authors case. You don’t need to cite for that. The editor is the one who decides if the reviewers points are of any concern. If you cite a lot, that may help the editor to decide if the reviewers’ comments are valid or not. But still the editor can completely dismiss the reviewers’ comments if she/he likes to.
In this particular case, the editor can complety dismiss Willis’ comments no matter how “scholarship” it is, and legitimately justify it simply by saying that Willis is not an official reviewer. The important point, IMHO, is to have all the concerns raised here into the Willis’ report as that will be on the record for the future generations to see no matter how the editor/the authors reacted on it. How “scholarship” the review is, is completely secondary to that.
re #111: Earle, I’m sorry and you are right. I’m usually very calm, but there are some limitations to that. What I have a strong contempt for is full of themself, ignorant people who try to harash other people with the only motive being that they (supposingly) disagree in general terms.
…an author is free to show referee’s comments they receive to anyone they like.
The only convention here is that the referee’s identity is kept secret by the editor. Letters from an editor (including referee’s comments) rejecting a manuscript have been known to be posted on faculty doors as a kind of catharsis – or to make a comment on the referees.
#125
Like in CoP? I’ve not heard of such policy. Referees’ names are kept confidential, that’s all that I know. Reference?
Jean S:
I think it IS constructive of Dano to note that we should get references for things. There are points made in Willis’ review which are obvious, but there are statements which are unobvious to the non-statistician and a good citation would help things along. As an insight into how reviews (or should I say “open reviews”) should be done, Dano has raised a legitimate point: if you’re making a categoric statement, then a reference is generally good without being pedantic or redundant.
I must confess when I read Willis’ review, I thought it could do with proper annotation and citation as well as a good editing for style.
Jim Barrett, what on earth are you talking about? Please provide some citations for your outrageous claim that:
I’ve seen lots of complaints about this site, I’ve had some myself, but lack of ethics has never been one of them.
Put up or shut up, because as my momma used to say about things like your quote, “Them’s fightin’ words …”
w.
PS – It’s worth noting that the behaviour that you thought was unethical by Steve M. … wasnt.
For the record:
“Further details are on the Climate of the Past Discussion site, where anyone is welcome to post a comment.” Martin Juckes -November 3rd, 2006 at 4:34 am, #30 in this topic:
Team Euro Code
Willis:
You can not cite that, and technically, you can not even cite the fact that the proxies should be flipped in CVM. In the “scholarly” language the CVM method is “proposed” in the paper. It is not referenced, so it has to be assumed to be novel. If it is not, and the authors are aware of that, that’s a misconduct. So we have to assume CVM is novel. Now, since CVM is novel, there is no way of citing anything concerning directly it, everything has to be based on what is written about it in the paper. There is nothing strange about this, only strange thing is that CVM is not justified at all in the paper.
Now, despite several attempts here, Dr. Juckes kindly refused to give any specific details about the model assumed in the paper. That makes it impossible to mathematically evaluate the proposed CVM method. However, luckily for the flipping issue, there is enough written in the paper to solve this issue. It’s just elementary mathematics, and I write down a proof only for Dano-likes’ sake:
From the proxy model on p. 1027, it follows that the noise in the CVM model on p.1028 is the mean of the proxy noises. As it is assumed on p. 1027 that the noise is independent between proxies, it follows that the noise variance in the CVM model is just the mean of the individual proxy noise variances. This is the same if any of the proxies is flipped or not. Now the signal variance in the CVM model is just squared mean of the proxy![\beta_i[\tex]'s times the variance of the temperature. Therefore, the signal variance gets reduced if](https://s0.wp.com/latex.php?latex=%5Cbeta_i%5B%5Ctex%5D%27s+times+the+variance+of+the+temperature.+Therefore%2C+the+signal+variance+gets+reduced+if+&bg=ffffff&fg=000&s=0&c=20201002) latex \beta_i[\tex]s have different signs, in other words, SNR gets lower. On the other hand, the signs of $latex \beta_i[\tex]s determine the signs of correlation between proxy series and the temperature (assuming noise is independent of the temperature), and furthermore, the performance of the CVM method depends only from the SNR as CVM is nothing but a scaling of the CVM model observations. Hence, in order to maximize the SNR of the assumed model, all proxy series should have the same correlation sign. QED
latex \beta_i[\tex]s have different signs, in other words, SNR gets lower. On the other hand, the signs of $latex \beta_i[\tex]s determine the signs of correlation between proxy series and the temperature (assuming noise is independent of the temperature), and furthermore, the performance of the CVM method depends only from the SNR as CVM is nothing but a scaling of the CVM model observations. Hence, in order to maximize the SNR of the assumed model, all proxy series should have the same correlation sign. QED
Re #119
I will supply references for the statements that I think need it. Tonight perhaps. My #116 was intended to point out that there is no point in flaming Dano. His criticisms, whether you like them or not, are more-or-less on the mark. Note he did not say Willis’s arguments are incorrect. He was mostly complaining that they were unsupported by cited literature. Normally, this wouldn’t matter. In this case, it does.
My number one criticism was constructive:
That is the best way to organize this review, IMO.
If a paper is bad, you can outline its major flaws and, Jean S is correct, you are done your job. If you are a recognized authority the Editor will usually accept the rejection. If you are not, then the Editor will weigh that in his deliberation. If a review is so negatively critical as to seem to lack objectivity, the Editor can dismiss it – even if it comes from a recognized authority. This happens most often when there is a second and/or third review that is extremely positive. This is what you want to avoid: Editorial dismissal for appearing to lack objectivity.
Do not discount that possibility.
Supplementary commentary on the review to come later.
Willis E, I read your critique belatedly. It’s thorough & concise as is all of your work. But you’d be better to eliminate or reword/reduce item 7 at the end. I know you want to expose Jucke’s school-yard comments, but that’s already been done thoroughly here at CA. JMHO 🙂
#120. In 2004, Nature gave me permission to post the reviews. Each of the reviewers also gave his consent to the reviews being posted.
#136
Steve, I think that a discussion about the review process as such could be interesting and enlightening. Currently reviewers in those prominent journals are usualy given two weeks of time and no data, and of course no financial gratification. And usually a reviewer has a lot of other urgent things to do. No wonder that the result is sometimes suboptimal.
Here is something interesting: if the calibration data is zero mean, you’ll get CCE from CVM quite easily:
yCCE=yCVM/R
Just use R’s from the Table 3 and you’ll obtain CCE reconstructions easily!
Re. postings 120, 125, 127, 128, 130 and 136. It’s so easy to make you guys bite. If this were a serious non-partisan blog interested in getting at the truth, I would have thought that, at times, someone might just spend a few seconds considering what I had to say before going into attack model.
Notwithstanding the fact that Steve claims to have got permission to post the reviews from all concerned two years ago, I suspect that he did not get their permission this time and that he did not ask whether he could use these reviews to score a political point.
I know I certainly wouldn’t want my reviews to be used in this way. The purpose of my doing a review is to ensure, to the best of my ability, that the quality of accepted papers is within reasonable limits (O.K. crowd – have a good cackle – I’m sure you are all more able than me). My review certainly isn’t for anything else.
Sorry guys, I just think that posting correspondence like this is bad manners, poor style and an indication that the poster is losing his way.
I just think that some people are getting worried.
RE #139
Please don’t feed the troll.
Thank you.
Willis –
Have you considered adding a sentence to the introduction section of the review stating for the record that, “Many [or most] of these criticisms have been communicated directly to Dr. M. Juckes at the Climate Audit website during the period of Nov. X, 2006 through Dec. Y, 2006 ?
I am not experienced in how editors view these deadlines, but if I were an editor I might consider it overly burdensome to require an author to respond fully to 95 theses submitted just under the wire. I might be less forgiving to the author(s) if I knew they had been personally alerted to the claimed defects a month earlier.
Willis,
With the help of Jim Barrett (the troll), I have come to agree with beng (#135) on the issue of your item 7. Jim caused me to think about the CA trolls and their purpose, which is largely to interfere with useful discussion.
Martin Juckes’ posts to Climate Audit, were mostly in troll mode. Why is that? Why provoke, when being civil costs him nothing. Martin is both a scientist and a politician. If we assume it was Martin the scientist, that was posting here, we have to conclude that he is a poor scientist, with a very large ego. If on the other hand, it was Martin the politician, we have to wonder what political game is in play.
I think in this case, Martin has tried very hard to detract from the science issues and to invoke emotional issues.
Make your opponent angry and half the battle is won – politics 101.
I think Martin will be very pleased when you raise, once again, the accusation against Steve M, when he has, quite reasonably, already agreed to make the appropriate correction. He will respond by quoting your outrage, adding some spin and express his bewilderment that he is being trashed for making a simple mistake, which he has already acknowledged. This response will come first and will set the tone for addressing the science issues, which will be that science criticisms are confused and/or unreasonable. Because one of your issues can be framed as an unreasonable reaction, he will use that as license to paint all of your issues with the same brush. Why give him that advantage?
The right time to re-address the accusation is when Martin’s revision turns out not to be appropriate. As beng noted, the full exchange is well documented. Martin can’t win if he choses to add slime to his revision.
A more productive way, to deal with the very important data and methods availability issue, would be to question the silence on that issue, in the ‘survey of recent reconstructions’. Since reproducibility is the bed rock on which science rests, a survey of reconstructions should include an evaluation of reproducibility of the reconstructions and the proxies used. A helpful suggestion should be made that discussing the availability of data and methods (including code) for each of the surveyed reconstruction, would add proper prospective to his conclusions made from the CVM reconstruction.
#124
Yes, get in the ring 😉 And Dr. Toutenburg might be interested as well, specially of the cases when CCE times R is more optimal than CCE.
Willis,
In section 3.2, I think it would be nice to begin with a general statement of the need to have a clear a priori rules for proxie selection as a defense against any criticisms of ‘cherry picking’. Also, helpfully, adding that clarifying the selection rules will lead to a more robust conclusion.
In section 3.2.3(lack of rules including archive), you have a disconnect with section 3.2.4. You have proxies in 3.2.4 that do not follow the rules only because of archive isues. The archive rule was only asserted by Juckes in a CA post. You need to add that information or drop the unarchived only problem proxies from your table.
In section 3.2, are there proxies that meet the functional standard for selection, but are not used? (rejected for time span or archived data, which the functional standard allows for other cases)
In the section 3.5 map, it would be helpful to point out that the green pointer locations are used in CVM and the red locations are not.
In section 4.2.5, since bristlecones are criticized, would it be useful to break-out BCs as a seperate (from other tree rings) sub-sample on your plot?
BTW: Thanks again for your work on this project.
Double post – I hate it when that happens.
Sorry
I think Cliff is right in 143.
Just out of curiosity – why are there no referee comments on this paper at the CoP website?
re 146:
Green is “union” data
adding the url for the interactive map is useful
http://home.casema.nl/errenwijlens/co2/juckesmap.htm
Latest versions of the MITRIE review posted. Hot, fresh off the presses, contains new text and updated references. If I have missed anyone’s suggestions about proposed visions and revisions, please let me know.
Word
PDF
Best to everyone, your contributions have been excellent.
w.
Factual correctness in a review is necessary. But it is not sufficient. Not sufficient to serve as a solid basis for an Editorial decision. An Editor would likely say that this review is rambling and incoherent.
Rather than number the errors in a 16-page hierarcical numbered list, what you want to do is provide a critical synthesis of the major problems in the paper, then followed by a more complete enumeration and analysis of the minor problems. It is not clear from this review what the major complaint is. i.e. What is it that pushes this paper beyond the point of acceptibility?
I know I’ve said it before and my criticism was not found to be helpful; but I say again: there’s a long way to go with this review yet.
An authority goes for the jugular, doesn’t dance around so much with the minor problems. Be an authority. Go for the jugular. What is the single major problem with this paper? Spend 80% of your time focusing on that. The details should be treated as more of an Appendix on “errors in fact”. On this topic, be helpful, not condemning.
A review should be 6 pages, not 16.
#149
there is one now.
#152
Don’t bee to critical. At least Willis referes to published papers, unlike official CoP reviewers. There are papers in press, accepted ..unbelievable..
Just send it.
Bender, thanks for your comments. I noted in the paper that the problems were arranged in order of importance. However, there’s a problem with that.
The lack of significance of the results knocks out the UR entirely.
The problems with the proxies knocks out the UR entirely.
The problems with the methods knocks out the UR entirely.
The problems with the tree ring model and the bristlecones knocks out the tree rings entirely, which knocks out the UR entirely. And that’s not even including the Morocco tree ring proxy, which the other reviewer said was a “clear winter precipitation signal”.
Which is the most important problem? I’ve listed them in that order, but what would you say?
Note that I’ve left out entire sections that were in the review earlier, haven’t commented on their pathetic “intercomparison and evaluation” of prior reconstructions, haven’t touched the CVM/CCE issues and … heck, I thought I’d pulled out the section about their shabby treatment of Steve M, but looking at it now I see it’s still in there, I plan to pull that out as well.
I’ve looked at the review on the CoP site. It has all the brevity you recommend … but very little substance, in part because of that brevity. For example, there’s not a hint of mathematics or statistics in that review. There’s a host of problems in the MITRIE paper, revealed because we have such a wide variety of expertise and information here on this site. I would expect a multi-disciplinary review to be much longer than a review looking at the MITRIE paper from a single perspective.
Which is not to say that I’m disregarding your comments. I know that I can get wordy at times, but that’s why God made editors. If you can see ways in which it can be tightened up, clarified, and made more to the point, by all means take the Word doc, chop it and change it, and send it back. I value your opinion.
All the best,
w.
Re # 155.
You don’t seem to understand what the task of an editor is. An editor is not going to rewrite or chop your review. Writing a good review is your job.
You need an abstract.
If I were a referee I would write something like… “This paper introduces a new method of aggregating proxy records to reconstruct temperature called the CVM method. Unfortunately this new method seems completely ad hoc and no justification for its use or investigation of its properties is provided within the paper. Claims of optimality for the measure are similarly unfounded within the paper. As such, it is not possible to recommend the publication of this paper until the properties of the CVM measure are more fully investigated. In addition to this weakness, there is evidence that the CVM measure generates spurious results (in the sense of Granger and Newbold 1974). Thus, regardless of any theoretical properties that may eventually be demonstrated (but which are not currently within the paper), it is not possible to recommend its use because of apparent practical problems with its use. One reason for the spurious results may be the old truism “Garbage in, garbage out”. There are substantial grounds to question the validity of particular records used as ‘temperature proxies’ in the paper. Recent work by the NAS has concluded that, for example, bristlecone pines should not be used as temperature proxies. Despite this recommendation, this paper uses four…
More detailed comments expanding on these themes follow.”
You get the gist. Because you are not an official reviewer the recommendation bits won’t fit. But they are what I would write if I were.
Gosh, thanks gb, that helps a lot.
w.
I expect you have covered all the points, but here goes:
1 Relatively small number of proxy data sources used over and over again.
2 Some of the older proxies are themselves very small in number.
3 No analysis of Benders point about survivor bias
4 Little discussion of whether the sample sizes themselves were sufficient to confidently reflect the properties of the population as a whole.
5 Comment on the consecutive use of novel and untested (in this setting) statistical methods. List the methods that the Hockey Team have used that are without published support.
6 Comment following Wegman, that no qualified statistician has been employed on these analyses.
7 Data and methods largely not published.
8 No attempt at comprehensive analysis of all available proxies.
9 Comment on Cherry Picking, was the selection of data truly random, and if so what were the methods used. A non random sample cannot be used to produce a reliable estimate. The variances within many of the sample groups indicate that they cannot be representative of the group as a whole.
10 Comment that the majority of the authors in Juckes were in fact reviewing their own work.
11 “The robustness of the Union reconstruction has been tested by creating a family of 18 reconstructions each omitting one member of the proxy collection.” This method is carefully chosen to disguise the fact that it is three groups of the proxies that provide the basis for the Hockey Stick shape, the three goups that have the largest divergence with the othe proxies in the pre-recorded temperature group.
12 No analysis of the variance between the proxies in the pre recorded temperature period, another divergence problem.
13 Mention of lack of recent samples, divergence problem in what recent data there is.
Willis,
I would suggest that your opening statement should discuss the importance of the reconstruction foundations and state that the focus of your review is on the UR.
The UR fails because is built on a foundation of poor statistical methods and poor proxy specification. These same foundation issues are largely ignored in the review of the recent reconstructions. By focusing on the foundation problems found in the UR, you are addressing the very issues that should be discussed in a ‘Millennial temperature reconstruction intercomparison and evaluation’ paper. Juckes et al, on the other hand, are rearranging deck chairs on the Titanic. Without a hard look at the assumptions that go into temperature reconstructions, robust reconstructions will never be achieved.
As to reducing the review size, the only thing I can suggest is to drop the title and TC pages.
#157. The CVM method is not a “new” method, but is very commonly used e.g. Jones et al 1998; probably Bradley and Jones 1993 (I can’t imagine anything else being used in it, I just don’t recall for sure offhand.)
The review by Reviewer #1 presently online is typical of the quality of academic reviews. BTW I have one query about it: it refers to “papers in press by Wahl and Ammann and Ammann and Wahl” – is the latter paper their rejected GRL comment re-submitted elsewhere? If so, I’ve seen no reference to it. Or is it just the rejected GRL comment mis-described as being “in press”?
#161
To live is to learn. Indeed,
Here’s the CVM CCE relation:
Let those x and y be zero mean (calibration data, y=observations, x=reference). Then CCE is (e.g. Srivastava 1989)
CCE times R
is
and
and
and
and
is
in Juckes’ notation (switch x – y):
But this is CVM.
#157’s getting the gist of it. It strikes just the right tone. After a coherent synthesis (abstract/summary) then you can launch into the details. A 2-3 paragraph summary is what the Editor needs to read to get a sense for what is contained in the whole review. That is what gb was getting at in #156. Editors, who are overworked, typically will not scrutinize, line by line, the whole argument in a review. Instead, they will use a sort of overall gut-check method where they try to intuit whether the reviewer is on his game – whether the review has the ring of truth to it.
I realize that may be displeasing to some of the more rational types here at CA; but that’s the way the game is played. Rhetoric counts almost as much as reason.
UC in #154 urges me to not be too critical. I assure you that it is better to be hypercritical early on; it will make for a stronger, more influential review. Willis has done such a good job summarizing all the criticisms that it sould be a shame not to pull it all together to achieve maximum impact.
Willis,
Section 3 seems a bit chopped up by the outlining format. I spent some time reworking that section — is there an e-mail address I can use, to send the Word document for your consideration?
Cliff, my email address is willisATtaunovobay.com. (Replace the “AT with the @ symbol, of course)
Thanks for the rewrite,
w.
Willis,
It’s in the mail. . .
New versions of the MITRIE review posted. The maximum length for any comment at CoP is five pages, so I have slimmed this down. I’ll have to publish it in two parts. The first part is now available, second to follow.
Word
PDF
Everyone’s help has been invaluable. Cliff, thanks for sending the paper.
UC, I have slightly expanded and commented your proof that CVM=CCE*R. It is available here. Could you please make sure it is correct before I refer to it in the second part of the review?
Best to all,
w.
#167
Can’t see the figures, can you post a pdf version?
Can’t understand this, needs some revision, some points:
1) If noise cancels completely then R=1 and CCE and CVM are equal.
2) Spatially and temporally white noise does not mean that the noise cancels out completely.
3) You can copy the demo code to the paper, or Steve can copy it to CA. Those free Geocities pages can’t handle traffic very well.
I’d take on board Steve’s comment that the CVM method isn’t new. It wouldn’t do to have an error in the first sentence.
“This paper presents a comparison between and evaluation of proxy-based temperature reconstructions. It also introduces its own reconstruction called the Union reconstruction (based on the CVM method). Given that the novelty of this paper lies in the Union reconstruction, these comments, for the most part, focus on that reconstruction and its claimed properties. The Union reconstruction is argued to be superior to previous reconstructions but, in fact, suffers from exactly the same problems that affect previous reconstructions…”
And then use some of the earlier text I suggested.
And finish something like “…As such it is hard to recommend the publication of this paper, presenting as it does, yet another minor variation on existing reconstructions that remains compromised by the same problems (spurious correlation with temperature being the most significant) as the earlier reconstructions.”
UC, thanks for your comments. The PDF version is here.
You say:
Can’t understand this, needs some revision, some points:
1) If noise cancels completely then R=1 and CCE and CVM are equal.
2) Spatially and temporally white noise does not mean that the noise cancels out completely.
3) You can copy the demo code to the paper, or Steve can copy it to CA. Those free Geocities pages can’t handle traffic very well.
How about:
I don’t expect that the Geocities site will get many hits … a proof that CVM = CCE*R at the CoP discussion site is likely to draw less attention than the current citation link on climateaudit …
Thanks,
w.
Annonymous, thanks for your comments, I had forgotten that Steve M. had mentioned that. I have modified the document, the new version is at the usual place:
Word
PDF
Regards,
w.
RE: #167
Willis,
I was just looking at CoP discussion short comment rules. I now understand why referee #1’s comments are all packed together with minimum cites and no quotes. I never thought that a site, that is ‘leading the way’ into the future of science publishing, could be so primitive.
So, your comments are limited to 10 pages (CPD format) of text (and Latex) only and you can only post three additional comments. The CPD format allows about 12 lines of 12 pt. text on the first page and 30 lines on the rest. A 10 page CPD comment is about 282 lines of 12 pt. text. Your current posted word document is reporting 327 lines – so a little trimming will be needed.
Since space is tight and it’s not clear that a table will work, you might want to collapse the ‘Proxy selections not following a priori rules’ table to something like this:
1) Guliya: differs from archived version, bad dating; 2) Dunde: differs from archived version; 3) Dulan: unarchived; 4) S Tibet 1..12: starts 1100, ends 1950, unarchived; 5) East China: unarchived; 6) Great Ghost Lake: unarchived; 7) Jiaming: ends 1960, unarchived; 8) Jinchuan: ends 1950, unarchived; 9) Japan: ends 1950, unarchived; 10) Tornetrask: differs from archived version; 11) Taimyr: differs from archived version; 12) Methuselah Walk: ends 1979; 13) Indigirka: Meets all criteria, but not used.
Also, I don’t see any indication that bold text or different font sizes are used. You may want to change all your text to normal, 12 pt. to see how it will look on CoP.
Maybe you can get Steve M or John A to put up a page with your graphics and put a URL in the review. As the saying goes, better than a sharp stick in the eye.
My proof is blog version, I would write it better if I had time and money.. Anyway
is more clear.
Those xTx equations should be
where means squared sample standard deviation, and this holds because x was assumed to be centered,
  .
.
Whiteness is IMO not the main issue. My point with CCExR is that CCE is quite well-known univariate calibration estimator, and even though slightly biased it is consistent. And if there is lot of noise, CCE and CVM will differ a lot. For example, in JBB, R=0.367. And I can’t imagine a situation where R is that low and CVM would not underestimate the signal.. My code shows that it underestimates. But my code uses my assumptions for the noise process – Juckes et al do not explicitly tell what they assume.
Willis, although I understand that you are pressed by the space limits, I propose two additions to the review.
1) The authors’ lack of understanding even the basic statistical modelling issues associated with the problem is (at least to me) very annoying. So I would add something like this: “The authors seem to be unfamiliar with even the basic statistical analysis methods related to the problem of multiproxy reconstructions. A recent review of two fundamental statistics books related to the problem is given in Schneider (2006).”
And the reference is:
Schneider, T., 2006: Analysis of incomplete data: Readings from the statistics literature.
Bulletin of the American Meteorological Society 87, 1410–1411.
2) [This is related to things already in the review, but I explain it in length in order to make the point clear. I’m sure you can condense this to a few lines.] In the paper, Juckes is using the MBH98 style “confidence interval estimation”, and makes claims related to these. (The Wegman report explicitly stated (in relation to MBH) that these type of claims were unsuported by MBH98.) In the paper abstract:
Then on p. 1025 (right before Conclusions):
And again in Conclusions (on p. 1026):
These claims are IMO outrageous from at least on two fundamental points of view:
1) The CVM method is not an estimator of the instrumental record (and the Union CVM is not an estimate of it) as it explicitly depends on it (variance matching). Therefore, the standard error in the calibration period can not be used for Confidence Interval estimation.
2) Additionally, using the sample RMSE (as in the paper) to estimate the standard error assumes i.i.d. residuals (i.e., essentially temporalily white noise in the model), which is not the case here as the residuals fail the Durbin-Watson test.
In fact, the CVM “standard error” can be explicitly calculated (this is UC’s result and UC’s notation (#173) is used):
 ,
,

where I used r for the correlation. In CVM r is always positive (flipping), and thus
Therefore, the standard error here depends only on correlation (which is as high for random walk as for the Union-CVM) and on standard deviation of the instrumental series. Furthermore, it is upperbounded by the value approx 0.25K for all “proxies” (including any noise)…
Re: 172
Willis,
If space has to be so tight, and you’re about 20% over, perhaps it would be more productive to split it into 2 and have Jean S., or somebody, submit the other half. [Submitted on the slim chance you haven’t contemplated this yourself…]
Willis,
I read the first section posted at http://homepage.mac.com/williseschenbach/.Public/Juckes_Problems_with_Proxies.pdf. You’ve done an impressive job condensing the issues into a clearly written review. I have a few trivial comments:
I noticed a typographical error in the paragraph about monte carlo that reads “I does not show” and presumably it should read “It does not show”.
In the paragraph titled Geographical Location you state “…this opens the door for speculation about basis of the selection.” I don’t know that speculation in itself is bad. I suggest you consider emphasizing the impacts of the selection process, perhaps by stating it as “…this opens the door for speculation about basis of the selection when the immediate impact is to skew the reconstruction toward the densely represented sites.” This focuses less on the motives and more on the flaws in the selection process.
Final Draft versions of the MITRIE review posted. I have had to shrink them severely and cut the review into three parts to fit into the CoP Discussion site’s measly allocation of space. It seems that concern for the environment has extended to not wasting electrons …
Section 1 Word and PDF
Section 2 Word and PDF
Section 3 Word and PDF
Your assistance and your insightful comments in all of this have been invaluable. I would like to post these tomorrow, so any final comments, while welcome, should be timely.
w.
RE: #177
Willis,
Your section 2 and section 3 links are returning a page not found error. The section 1 links work fine.
BTW: I’m using Safari.
#174
In addition, the JBB case shows an interesting correlation:
corrcoef(X-y,y)
ans =
1.0000 -0.5619
-0.5619 1.0000
Scaled signal, perhaps?
RE: #177
Willis,
Same problem with IE on a Mac. Message: We’re sorry but we can’t find the home page you’ve requested.
Willis,
I would suggest using roman numerals for you section titles, since arabic numbers are used for item list within sections.
In your Section 2 document (I assume it’s the same text as before, because I can’t download it), the questions and problems related to the a priori rules still seem a bit disconnected and inconstant with the rule summary.
Maybe something like this:
Vagueness of A Priori Rules and Proxy Criteria: A priori rules must have some logical reason for their inclusion and must be applied consistently. However, in the instant case, some explanation is needed. 1) The first rule says “. . . AD 1000 to AD 1980 (with some series ending slightly earlier, as discussed below).” , but does not discuss either which proxies it refers to, or the justification for including them while other proxies are omitted based on the same rule. 2) Rule two, implies using individual series rather than proxy compilations, such as MBH98 or Yang E. China. Why was Yang included and not the other compilations? 3) Rule three, in contrast to the overwhelming majority of studies, specifies older data in preference to newer data without a specific reason for the choice. What is the justification for using older data? 4) Rule four specifies using northern hemisphere proxies with one unsupported exception. How is the southern hemisphere gridcell connected to northern hemisphere average temperature and how does one southern hemisphere proxy adequately represent NH tropical temperatures? 5) The unstated archive rule is used to exclude Indigirka, but fails to exclude un-archived Yang and the use of other series that do not match archived data. 6) There is no rule about the geographical spacing of proxies, or the use of several proxies from a single location or temperature gridcell. Why are proxy geographic locations and distributions unimportant?
To Replace:
Vagueness of a priori rules: The first rule says “with some series ending slightly earlier”, but does not discuss either which proxies it refers to, or the justification for including them while other proxies are omitted based on the same rule.
Unsupported a priori rules: A priori rules must have some logical reason for their inclusion. Some of these are obvious — if a compilation goes from 1000-1980, a rule requiring that each proxy cover that time needs no justification. However, the following rules require some logical explanation:
“⠠Use older data rather than newer data: In contrast to the overwhelming majority of studies, this paper uses older data in preference to newer data without a specific reason for the choice. What is the justification for using older data?
“⠠Inclusion of Southern Hemisphere proxies: Southern hemisphere gridcell temperatures are no better correlated to the Northern Hemisphere temperature average temperature than are Northern Hemisphere gridcell temperatures. Thus, their inclusion needs to be justified.
Lack of a priori rules: There is no rule about selection of Southern Hemisphere proxies if they are to be included.
There is no rule about inclusion of other proxy compilations such as MBH98 or Yang E. China. Why was Yang included and not the other compilations?
There is no rule about the geographical spacing of proxies, or the use of several proxies from a single location or temperature gridcell.
OK, problems fixed, all should be available now. Had lower case letters in docs, upper case initial letters in the links. Who knew?
Section 1 Word and PDF
Section 2 Word and PDF
Section 3 Word and PDF
Thanks again,
w.
RE: #182
Thanks, that works.
Willis, the URL for the SOM (in abstract) is slightly wrong, this should work:
http://tinyurl.com/yd9bmc
Willis,
General note on your section titles: In document 1 you don’t have white space above the section titles, but you do in documents 2 and 3.
Document 1, page 2:
The NAS recommendation is not an isolated example. Biondi et al. (includingMBH author Hughes) wrote (emphasis added): — Since you don’t get any emphasis, you should drop (emphasis added). Also, the indent on the quote may not work, but you are not using it for quotes elsewhere – and you can probably pick up an extra line by dropping the indent.
Document 2, page 2:
Dual-Use Proxies: Some of the proxies have been used in previous studies as proxies for other climate variables. 1) Greenland ‘ˆ’€šO18 . . . Since these proxies were originally treated as precipitation or wind proxies, 1) what reason do we have to believe that they are also temperature proxies, and 2) what procedure was used in the UR to remove the effects of the confounding variables? — Two number lists in the same paragraph is a little awkward. Maybe you can use a), b) on the second set.
Geographical Locations: These are shown in SOM Figure 1.There are several areas with more than one UR proxy (2 in Northern Fennoscandia, 2 in Quelccaya, 4 in western US). — It would be better to use words instead of numbers in the parenthesis – if you can.
Document 2, page 3:
Further discussion of these and other issues is continued in Multidisciplinary Review 3. — should be in parenthesis, on a new line or both – same should apply to the end of document 1.
Document 3, page 1:
As noted above, the assumption of stationarity in the variance is not . . .
— Change to:
As noted in Review 2, the assumption of stationarity in the variance is not . . .
— Looking pretty good!
Willis,
Document 1 , Page 1:
A red noise (random walk) process that outperforms the UR is available at http://tinyurl.com/ylk4sq
— You might want to add that this is a R script and maybe have a reference to R in the SOM.
Revision including latest comments posted, 4:15am, I’m going to bed.
Section 1 Word and PDF
Section 2 Word and PDF
Section 3 Word and PDF
Supplementary Online Material PDF
Best to alll
w.
A final note. UC and Jean S, please carefully check the proofs and mathematical notes in the Supplementary Online Material to make sure I have not mistranslated or misunderstood something. Jean S, I believe there was a missing “n” in your discussion of the errors, I have inserted it.
Thanks, g’night,
w.
Willis,
For writing:
Overall, the MITRIE paper needs extensive work on both the “Intercomparison
and Evaluation” and the “Union Reconstruction” aspects before it is ready for publication.
You may have placed yourself in danger of winning a major understatment award.
re: #187
Read the first section now; very readable!
How come both A) and b) have the same title, “Proxy Selection and Processing”?
I just finished reading Willis E’s most recent draft of the UR review and have concluded that as a layperson in this area that I had no problem comprehending the arguments as presented and that those arguments have become more clear and better supported in this edition than in the original draft. While my first impression expressed here was that I cynically thought there should be low expectations of accepting the review, and not from lack of presentation, but more from knowledge of the handling of past criticisms of Team papers, I must admit, selfishly, that the critical reviews of the Willis E’s review have been helpful in giving me a better grasp of methodology of the UR and the weaknesses it presents to the UR conclusions. I will leave it to the seasoned reviewers here to judge when the product is finished, but I think the effort has been well worth it and even with the small chance of acceptance (that I see) I would greatly be interested in seeing the measured and written Juckes reply to this review.
I certainly appreciate Bender’s “tough love” (if one can use such a term in this context) in this matter and appreciate that effort also. My research professor for my graduate degree in chemistry was a no nonsense guy who taught me how to write a scientific paper (not that I ever excelled, but he certainly improved my techniques and it helped me recognize a well written paper when I saw one). He literally screamed at me when I inadvertently reported in a draft paper the wrong color of a reaction product and told me that no one would have reason to accept anything else in the paper if a monumental error of that nature had made to the reviewers. I was able to later point to an important reference work that he had missed in earlier work that he had done in the same subject area and he was just as hard on himself as he was on me. He was tough on his under graduate students as some of them would come into his office through my research lab and look to him for some sympathy for late reports and such. Normally he would throw these people out of his office before they made half way through their spiel. I do remember one young and very attractive female student coming into his office and rendering a rather lengthy sob story to which he uncharacteristically listened in its entirety. When she left and I carefully noted the inconsistency in the handling of this student, he reddened a bit before recovering to tell me that there were some rare exceptions to his tough love.
I did have a problem with Dano’s review of the UR review, i.e. the one filled with exhortations of scholarship and references. Every review can do with more “scholarship” and “references”, but I took his comments as being more in line with his continuing theme here at CA of protesting amateurs reviewing the good works of scientist, i.e., at least, those with whom he is in general agreement. What else would explain, what I preceived as, the snotty tone of the post?
Aw c’mon, we should thank Dano for his snotty love too!
I just read all three sections and echo Ken Fritsch’s comments above. Best of luck Willis in getting the authors to address your comments. Through your hard efforts and the kind and cutting criticisms provided here I think the editor of CoP has to demand a response. If it doesn’t come it won’t be through lack of effort on your part.
Regards,
Earle
Well, I am willing to live and learn. It’s just that I have always considered the deliverer of tough love to be sincerely interested in the well being of those to which it was delivered. Snotty love I would think more of in the context of the snotty nosed grandkid looking for a little sympathy, however, on deeper consideration perhaps the condescending tone of the Dano comment and his virtual taunting of Willis E’s review will remind Willis and those contributing to the review that they, given the current climate of climatology, will need to deliver a product above and beyond the norm in order to gain official recognition. So, yes, I agree, thanks, Dano — for being Dano.
re #188: Yes, there was a missing n. I read the proofs, and just some minor comments from the “Explenation…” part:
1) The line before RMSE: the positiviness of R is not needed for the RMSE equation, only for the upperbound.
2) the 0.25K upper bound is for R=0 (and variance I calculated from Juckes’ intrumental series), i.e. =maxRMSE. The “standard error” for, e.g., the random walk is about the same as in the paper for the Union CVM, i.e. about 0.15K.
3) I would replace the word “unbiased” with something like “meaningful” in the sentence “it is clear..”. “Unbiased estimator” has a precise statistical meaning, and may not be appropriate here.
Also notice my comment #184. It still applies to #187 (section1).
From my part, the review is ready to go, and I want to thank Willis for the great job! The review makes all the points clear to anyone willing to understand those, so it will serve its purpose. Whether or not it has any effect on the actual review, is IMO completely another issue. We’ll soon see.
Well, dear friends, Part 1 of the game is done, and now it’s up to Juckes et al. for part 2. I have posted the three sections of the review at the CoP Discussion Site.
A couple final comments on the process. First, a review of this depth and breadth could not have been done by one person. It is a result of the generous contributions of time and effort from a variety of people with a wide range of skills, more than any one person could possess.
In addition, it is the result of the interaction and mutual support between those people, each in his or her own way, heck, even Dano’s way, which has made the process work. One person comes up with an idea, another carries it forwards, a third exposes some new facet which had not been seen, a fourth points out a correction, a fifth proposes a solution. It is this dynamic interaction which the true source of the report.
So, my heartfelt thanks to everyone who has made a contribution, large or small, to the process. Online reviewing of papers is obviously the direction of the future of science, and I am thankful to have played a part in the process.
I was greatly encouraged by the participation of Martin Juckes and in particular Eduardo Zorita in the process here. Dr. Zorita was very open and honest about the strengths and weaknesses of the paper, and I commend him for his forthright manner and inquisitive scientific spirit. And although Dr. Juckes was generally bristly and defensive, he contributed to the paper as well.
I also felt that in general, the denizens of this corner of the internet were appropriately respectful of our two guests. I did lose it, I must admit, after asking a question three times and getting tap-dancing in place of an answer … ah, live and learn. I’ll be more refined next time.
All in all, I feel that this experiment in on-line collaboration and on-line review has gone better than I had expected. And for that, once again,
I thank you all.
w.
Well done, Willis.
Well done, Willis and thanks for all your hard work. Let’s hope that these comments have an impact on this paper and future papers!
Thanks Willis! 🙂
Thanks, Willis. It will be interesting to see how Juckes et al respond. Maybe his coauthors will pitch in.
When I was at KNMI in Holland in September, I discussed my offer to Ammann and Wahl at AGU last year- that, on the basis that the community was worn out with controversy, it would be far more productive to declare a temporary cease-fire and to try to write a joint paper summarizing points of agreement and points of disagreement, with the reservation that, if no such paper could be agreed to within 8 weeks, the parties would revert to the status quo. Since our emulation codes and many specific findings were essentially identical, I thought that this would clarify issues immeasurably and would be of far more interest than further controversy. Ammann didn’t even acknowledge my follow-up email. In September, I re-iterated the same offer to Nanne Weber of KNMI, one of the Juckes coauthors, who declined the offer. Like Ammann and Wahl, they preferred to engage in more controversy.
I have read the contributions by Steve McIntyre and Willis Eschenbach at CoPD (and the other submissions). Very impressive, and well argued critique and commentary from both. My thanks and appreciation to Steve and Willis, and to all who contributed.
While this experience may not be pleasant for Dr Martin Juckes (it will indeed be interesting to read his response) this is a wonderful example of how science can advance in the internet age.
No doubt there will be defenders emerge for Dr Juckes, critisizing the “nit-picking” of the commentators. The nature of the internet allows dispassionate observers to see these comments for what they are.
I think that a consequence of this episode is that climate scientists will in future be much more careful to ensure that their papers meet required standards. That can only be a good thing.
It was a pleasure to read Steve’s two segments and Willis’ (and “team’s”) three segments at the CoP site. As many of the issues raised are broadly relevant to current/recent work in climate reconstruction, and the writing is clear, I hope Steve will post links to all five (and Dr. Juckes’ paper) on the sidebar of Climate Audit. Newcomers to the site could do much worse than to start by reading through this set.
I think the UR author response and replies to them would be the ultimate learning benefit of Steve M’s and Willis E’s reviews and certainly very satisfying for the more expert and technical participants here. I do want to repeat that the learning experience obtained from passively observing the drafting of the review and then seeing the finished product (probably most appreciated by us less technical laypeople at this blog) is probably unique to the internet and an enterprise well worth pursuing.
While I enjoy the personal interaction and brief commentary between participants on blogs such as CA, an ongoing suggestion with me has always been providing a review and summary of the subject at hand (at least for the most important ones covered) in order to allow the informed contributors to put forth their most important thoughts on the matter and in some prioritized order. I think the TCO approach (supported in general by others here minus the harangues) that visualized this process, in my view, as exclusively available through publishing can be, through internet exchanges, sort of like having your cake and eating it too. The internet process cannot and will not replace the standard peer reviewed publications so near and dear to the scientific process, but it does provide a very useful supplement and certainly easier layperson access. When I become somewhat (or a lot sometimes, if truth be told) confused from the blog exchanges, I must admit that I will instinctively go back to published articles and formal reviews — and often with satisfying results.
Steve,
Congrats for playing the game. What will be interesting now is that the authors, including Dr. Juckes, also have to play by the rules of scientific publishing. No more evading and not answering the comments. The “scientific community” is watching. See, if the blog is like street fighting, publishing is more like Greco-roman wrestling. Still a combat sport, but with strict rules, and a long tradition. The blog is useful for sure, but if it’s a scientific argument you want to have, that is where you can have it.
If I was the editor of Climate of the Past, I would find the questions and comments raised by Steve and Willis overwhelming and reject the manuscript. Congratulations to them and others on well argued and compelling critiques.
However (there is always a however isn’t there?), I think that Climate of the Past’s experiment with this form of peer review is what Sir Humphrey in Yes Minister would call a brave decision. I fear for the success of the experiment unless all or even most of the other journals follow suit. Juckes et al. received a mauling (rightly IMHO) by being in public view but I wonder if the response will be to take this manuscript and others to other journals that have a more traditional peer review process. If most of the other researchers in the field follow suit then CoP will fall in submitted papers and like any business, can fail if its primary product dries up.
I am not being critical of what was done here, it was the right thing to do but I wonder about the consequences. This was only a skirmish not a battle won.
Well done, Steve and Willis (and his contributors). It’ll be constructive to see what comes of your efforts.
Re #204, IL
A more optimistic view would be that all the real scientists would put more value on getting published in Climate of the Past – if they can survive the scrutiny, they must be producing good research. CotP could emerge as the gold standard for rigorous science, while Nature heads further down the slope to tabloid status.
I doubt very much that the open review system will be widely copied. Mann and most of the Hockey Team have played the anonymous and unseen review process very well and are not enthusiastic about having to deal with Steve McIntyre, especially by name.
Michael Mann’s blanking of Steve at the recent AGU conference is demonstration of that.
FFreddy, many scientists of all disciplines try to emulate Feynman’s ideal that the harshest critic of your own work should be yourself. Opposing that is the driver that numbers of publications = prestige on your CV or resume. Publication and producing large numbers of publications in short time frames are everything if you are an aspiring tenure track researcher (or indeed any sort of researcher facing pressure from research assessments etc). Only if you have made it to the top and don’t need that traction can you have the luxury of producing papers at your leisure. I would like to believe that what you say may become true but its an ideal and much as I despair of the huge prestige given to Nature and Science (one of these self fulfilling bootstrapping processes) compared to quality papers in other high class journals, it is so entrenched that I can’t see it changing drastically anytime soon.
Re: #205
Fully agree with your sentiments! But I fear the outcome will be more instructive than constructive…
#206
I was just about to write about optimistic view, but you took my words 😉
The fact that MBH98 was published in Nature makes me think that impact factor is not a good proxy for the quality of the journal.
Curiously, the Team has mostly relied on non-peer-reviewed literature (realclimate) to respond to us and climate scientists have been prepared to rely on that. Where reviewers have had an opportunity to consider our reply, Team submissions have often been rejected even in traditional review processes. I was given an opportunity to submit a review of the submission of Mann et al to Climatic Change in 2004 and it was rejected. The comments of Von Storch-Zorita and Huybers were not by the HT; both raised issues that were worth discussing; I think that our Replies dealt with the comments and the net result was useful. The submissions by Ammann and Wahl and Ritson to GRL were each rejected twice.
However, Wahl and Ammann (Climatic Change 2006 – still not published) looks to me like the journal was trying to meet IPCC deadlines as its “provisional” acceptance and “final” acceptance both coincide with IPCC cutoff dates (as they then stood). We had a chance to review the first submission and were at least able to embarrass the journal into requiring the disclosure of the failed verification statistics (not included in the first submission).
#211
Is this necessarily a bad thing? The blogs are fast and accessible. Where the HT — or anyone else — has a point to make, they can make it quickly on a blog and receive a quick reply. Discussion in the peer-reviewed literature, on the other hand, is painfully slow, seldom finds a large audience, and is often incomplete.
One final thought: Among blogs, the ones that seem to work best (i.e. are most enlightening and entertaining) are those with an open environment and little or no censorship, where the reader has responsibility for filtering.
Re:#204
And Nature has just announced that it will be ending its experiment with (voluntary) “open” reviewing. Apparently, authors didn’t want to risk the process, and public comment was lacking.
Re: #213
Maybe they followed the Climate of the Past and CA postings and didn’t want to deal with the critiques.
Discussion is closed now at CoP, let’s see what happens. One more note: the paper can’t be completely bad, as it generated so much interesting discussion. To me, the interesting part in general is the univariate (or should I say non-multivariate?) calibration problem (e.g. in Appendix A2.)
The problem of A2 is that the given statistical model is not sufficient for deciding what would be the optimal calibration estimator. You can choose ICE or CCE, depending how you interpret past temperature statistically (wrote it down ). PCA is somewhere between those two. And this paper introduced CVM (tilts the regression line towards the observation axis). Four different ways to calibrate, imagine how many options we have for multivariate calibration!
Re: 207
John,
With open comments, Steve is not the only one who can post critical comments on HT work. It remanins to be seen whether anyone will get such a chance in the future. I hope that this sort of review becomes the standard, but I would have to assume that the HT will fight it.
I tried to get a user name and password on Copernicus so that I could comment on COP. Two attempts and both failed. Perhaps I should not have used my real name.
Comment Steve McIntyre: “Curiously, the Team has mostly relied on non-peer-reviewed literature (realclimate) to respond to us and climate scientists have been prepared to rely on that.”
Comment TAC: “Is this necessarily a bad thing? The blogs are fast and accessible.”
In contrast to the CA blog, which is fast and accessible, when RC exhibits their heavy-handed approval process (not infrequently), RC is neither.
# 215 cont
I made a scatter diagram of Juckes et al MBH calibration data. The plot includes both regression lines. And these are actually ICE and CCE – take a new observation y (proxy) and use the regression line to estimate x (temperature). CVM is in the middle. I think ICE is not suitable, it is very unlikely that the calibration data is a sample from binormal distribution (check the residuals..). CVM lacks theoretical justification (30 000 hits per day, some of the authors read this blog, if it exists why it is not written down in here??). CCE is left (if I would be mean and provocative I would say that the only problem with CCE is that you can’t make alarming conclusions with the results, and climate science wouldn’t get very far.)
UC, maybe summarize what ICE, CCE, CVM stand for?
# 219
Sure,
let x be the known values and y readings on a scale (temperature and proxy/thermometer, for example). Calibration problem is how to estimate new value X by reading Y, using calibration data (x,y). Assuming data is zero-mean (just saving space), we have
CCE=Classical Calibration Estimator
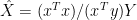
ICE= Inverse Calibration Estimator
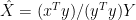
CVM= Composite Plus Variance Matching
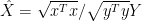
those lines are plotted in the figure. (BTW, ICE minimizes calibration residuals)