Here’s an interesting graphic from lecture notes of Jed Schneider and Kathryn Clapp here showing the flow of ice through a mountain glacier. If this is representative of flow in mountain glaciers, one wonders at what exactly is being recorded in a vertical drill hole away from the summit (such as Guliya Core 2). I’ll try to show my query below.
Figure 1. Cartoon of flow in a mountain glacier.
Here is an oversized image of the Guliya glacier from the wonderful Google Earth (there was a poster session showing applications at AGU so get used to seeing more and more of this. (I tried to reduce this in OpenOffice Draw but failed; I used to do this in an ancient Corel Draw, but it crashed my computer when I tried to load it). This image rather closely matches the map in Thompson et al 1996 (NATO, Climatic Variations), which has the most information on the site. The Summit (Site 4) is at 6700 m and the glacier is 103 m thick there (by radar). Site 2 and Site 1 are at 6200 m. The surface flow at Site 2 is 4.7 m/year to the SSE (towards Site 1). The glacier is 308.6 m thick at Site 2 and about 200 m at Site 1 – Site 2 is a topographic bottom. A diagram in Thompson et al 1996 shows radar cross-sections and shows that Site 2 is in somewhat of a valley going NW-SE towards Site 1. The Guliya site is to the W side of Tibet and is said to be affected by the Arabian Sea monsoon (not the SE Asian monsoon).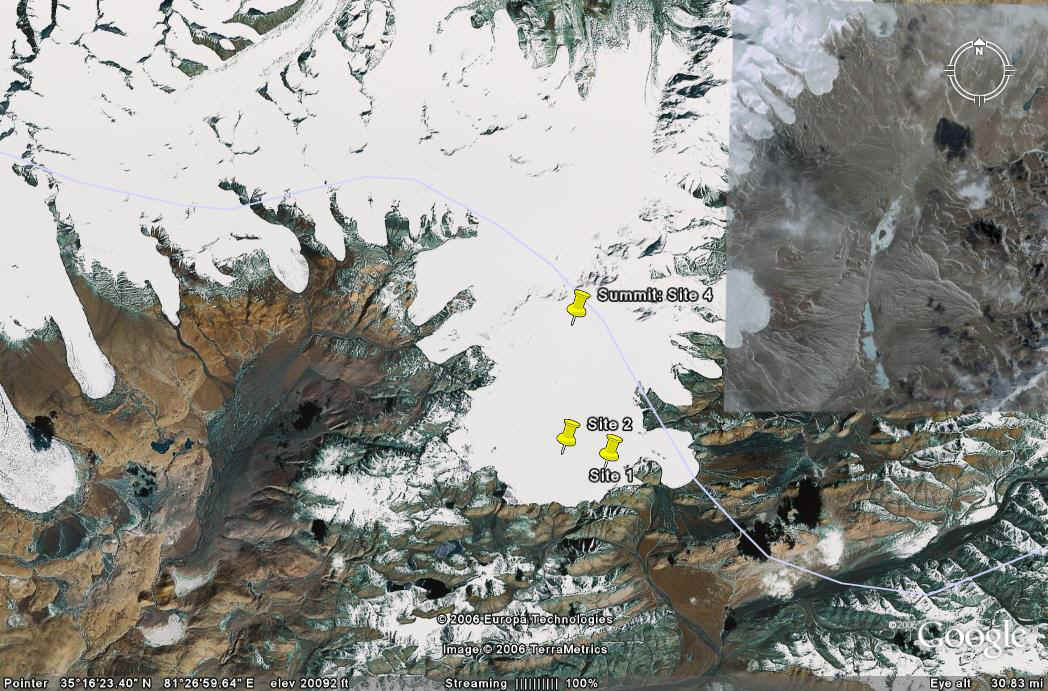
Figure 2. Google Earth image of Guliya glacier drill sites. 35 17N, 81 29E.
The drill core at Site 2 (308.6 m) has observable dust layers, said to be annual. If the cartoon in Figure 1 above is an accurate representation of mountain glacier flow, I find it hard to picture how the annual layering merely thins, but since there is observable annual layering, it must deform somehow so that the layering is kept intact. I’m not contesting this or suggesting that there’s any misunderstanding by specialists, but equally the flow regimes appear to have non-trivial geometry. In other locations, Thompson appears to have tried to drill at summits. For example, a core in the flow zone at Dasuopu was dated back only to 1922. So one wonders exactly what certainty there is for dating of a core in the flow zone at Guliya. Just wondering for now.
Anyway, Thompson et al 1996 Figure 6 has 4 photographs showing dust layers in 4 core segments – at 82 m, 105 m, 120 m and 135 m. Below is a picture of Guliya layering that I located on the internet. The thickness declines with depth as expected – 16.9 cm at 82 m; 5.0 cm at 105 m; 3.0 cm at 120 m; and 1.7 cm at 135 m. Accumulation in 1991-1992 was said to be about 15 cm – less than the thickness at 82 m – a point which I haven’t seen discussed (but may be in something that I’ve not consulted.)

Figure 3. Interval of Guliya core showing dust layering. From Thompson et al, 1995 Figure 6.
If one uses this information to estimate the count as follows – multiply the lower thickness of the first step by the overlying glacier thickness, then each subsequent interval by the average of the top and bottom layer thicknesses, then one gets 485 years overlying 82 m; another 210 years to 105 m; another 375 years to 120 m and another 638 years to 135 m, making an estimate of the cumulative total of 1070 layers above 120 m and 1708 layers above 135 m. Thompson et al 1996 Figure 8 shows what is said to be a “2000-year history” of accumulation in the upper 132.1 m of the Guliya ice core – which is more layers than yielded by the above simple estimating procedure, but within the same order of magnitude (1708 and 2000 years.)
But when we turn to Thompson et al (Science 1997), one gets something that appears to be an order of magnitude different. Below I’ve rotated the left panel of Thompson (Science 1997) Figure 3 and compared it with the middle panel of Thompson (Science 1997) Figure 4. One is denominated in meters and one in years; here’s my attempt to match them visually. I presume that the uptick at about 265 m corresponds to the uptick at about 110,000 years in Figure 4; that the up-bump around 250-260 meters corresponds to the similar feature from 90-110,000 years; the uptick at 225 meters to the corresponding feature at 75,000 years; the uptick at 135 meters to the feature around 35,000 years; with the up-bumps at about 50 meters corresponding to the features between 5000 and 10000 years.

Top: Rotated Figure 3 from Thompson et al Science 1997; bottom – panel from Thompson et al Science 1997 Figure 4.
Here’s the puzzle: the dust layer counts according to the information from Thompson et al 1996 indicate that 120 meters is about 1000 years old and 135 meters about 1700 years – which indicate a “warm” period leading up to AD1000 or so. In the dO18 version used in Yang et al 2002, the uptick to dO18 values of -12 or so is dated about 200AD (about 800 years earlier.) However in Thompson et al 1997, this is dated (according to my interpretation of the above diagram) around 5000 or 6000 BP.
What is the conclusion – only this – that Thompson ought to archive ALL his data and measurements from Guliya so this can be understood.
References:
Lonnie Thompson website
Thompson, L.G., E. Mosley-Thompson, M.E. Davis, P.N. Lin, V. Mikhalenko, and J. Dai, 1995. A 1000 year ice core climate record from the Guliya Ice Cap, China and its relationship to global climate variability. Annals of Glaciology, 21, 175-181 pdf
Thompson, L. O., Yao, T., Davis, M. E., Henderson, K. A., Mosley-Thompson, E., Lin, P. N., … & Bolzan, J. F. (1997). Tropical climate instability: The last glacial cycle from a Qinghai-Tibetan ice core. science, 276(5320), 1821-1825. pdf
Wang Ninglian, Yao Tandong, L.G. Thompson, K.A. Henderson, M.E. Davis. 2002. Evidence for cold events in the early Holocene from the Guliya Ice Core, Tibetan Plateau, China. Chinese Science Bulletin, 47(17): 1422-1427. pdf
Yang, M., Yao, T., Wang, H., & Gou, X. (2006). Correlation between precipitation and temperature variations in the past 300 years recorded in Guliya ice core, China. Annals of Glaciology, 43, 137-141.
Yang Meixue, Yao Tandong, Huijun Wang and Xiaohua Gou , 2006. Climatic oscillations over the past 120 kyr recorded in the Guliya ice core, China Quaternary International Volumes 154-155, October 2006, Pages 11-18 pdf
Yao, T., Jiao, K., Yang, Z., 1995. The climate variation since Little Ice Age recorded in Guliya ice core. Science in China (Series B) 25 (10), 1108–1114 pdf
Yao, Tandong; Thompson, LG; Qin, Dahe; Tian, L; Jiao, Keqin; Yang, Zhihong; Xie, Chao, 1996. Variations in temperature and precipitation in the past 2 000 a on the Xizang (Tibet) Plateau – Guliya ice core record. Science in China Series D (Earth Sciences). Vol. 39, no. 4, pp. 425-433. 1996. pdf
Yao, Tandong; Jiao, Keqin; Tian, Lide; Yang, Zhihong; Shi, Weilin; Thompson, LG, Climatic variations since the Little Ice Age recorded in the Guliya Ice Core, 1996. Science in China Series D (Earth Sciences) [SCI. CHINA SER. D (EARTH SCI.)]. Vol. 39, no. 6, pp. 587-596. pdf. Shows thickness vs depth.
Yao, Tandong; Thompson, LG; Shi, Yafeng; Qin, Dahe; Jiao, Keqin; Yang, Zhihong; Tian, Lide; Thompson, EM, 1997. Climate variation since the last interglaciation recorded in the Guliya ice core Science in China Series D (Earth Sciences) [SCI. CHINA SER. D (EARTH SCI.)]. Vol. 40, no. 6, pp. 662-668. pdf
Yao, T., Xu, B., Pu, J., 2001. Climatic changes on orbital and sub-orbital time scale recorded by the Guliya ice core in Tibetan Plateau. Science in China (Suppl.), S360–S369 Abstract
Yao Tandong, Guo Xuejun, Thompson Lonnie, Duan Keqin, Wang Ninglian, Pu Jianchen, Xu Baiqing, Yang Xiaoxin and Sun Weizhen, 2006. δ18O record and temperature change over the past 100 years in ice cores on the Tibetan Plateau Science in China Series D, 2006 pdf


45 Comments
Steve, the flow and internal structures of glaciers has been in the literature for years.
The snout of the glacier advances and retreats as a function of the amount of snow falling in the Accumulation Zone, but within the ice a constant flow occurs in the Plastic Layer below the Brittle Layer at the top surface of the glacier. The focus on temperature with glaciers is far too narrow, just as it is with tree rings, as the glacier is a function of temperature, precipitation, wind (ablation of snow or wind driven deposits rather than actual annual layers) and other factors.
I used to joke with my students about the snout never retreating, it was like an army declaring it was not retreating, it was advancing to the rear. The Brittle Layer is generally about 50 m thick below which the weight and pressure cause the ice to become plastic and flow. Crevasses occur in the Brittle Layer as it is dragged along with the flowing Plastic Layer but it is unable to bend when the flow is over rock outcrops or other sudden change.
The rate of flow of a glacier is usually determined by putting stakes in the surface and recording the rate of movement, however, this is the flow rate at the surface and though generally conected to the flow in the Plastic Layer is not necessarily a reflection. (The rate of flow is fastest in the top centre of the cross-section where friction is lowest.) Material that falls on the glacier, usually from freeze/ thaw action on the valley sides is absorbed into the ice and is then carried downslope emerging at the snout. There are records of people (a Swiss Soldiers 400 years ago) and objects, a US plane, falling on glaciers and then be ‘delivered’ to the snout of the glacier.
The crevasses create points of ingress for water and streams occur on the surface (usually briefly), within the ice, or under the ice. This and other melt water is part of Jaworowski’s concern about contamination of ice bubbles.
The rate of flow of a glacier can also change with variations in the basal temperature, but in this case the glacier is usually ‘slipping’ over a thin layer of water between the ice and the underlying rock. This condition usually leads to a ‘galloping glacier.’ I suspect geothermal heating can sometimes be the cause, but I have never seen any literature on this.
The annual Firn Line migrates with changing seasonal and long-term energy patterns, it is essentially a point of zero energy balance akin to the one on the globe at about 40° latitude. I would hope anybody drillling ice cores is familiar with glacial formation and dynamics of flow and internal structures.
The point you raise is very valid and one wonders about the dynamics and accurate representation of annual layers in such a complex environment. I can see how individual layers of ice are identified in the plastic layer where the process of transformation of snow to firn to ice (nivation) is occurring, but in the Plastic Layer individual layers are quickly blurred and melded together. The thickness of the Plastic Layer will vary with local air temperatures. This process makes cores from deep in the Greenland and Antarctic ice very questionable with regard to degree of absolute dating. I seem to recall that 8 m of ice was necessary at 2000m to obtain a single air sample and that at that depth 8m represented about 10,000 years of accumulation.
Incidentally, movement of the Firn Line is similar to other important boundaries that move with climate change including the tree line and the permanent snow line.
[John A: I’ve put in some needed paragraphing to aid readability. I hope Tim doesn’t mind]
Tim,
From your discussion, it seems that glacial flow is similar to laminar flow conditions. With the high viscosity and low velocity of glacial flow, the Reynold’s number should be well below 2,300 which is the upper bound for laminar flow. Since the flowing portion of glaciers are enclosed on the sides and bottom by rock and by the brittle layer above, the flow profile would be somewhat different than in a pipe, but it should nevertheless be a form of laminar flow with a parabolic flow profile.
Bearing this in mind, the time profile for an ice core taken near the center of the glacier would also follow the laminar flow profile. Below the brittle layer, the bottom of which acts as the upper boundary layer, the newest ice should be in the central area of the ice core. The top of the core, just below the brittle layer interface, would be older. This central area would be the location of the highest flow velocity, and therefore the location of the newest ice in the core. Older ice should be both above and below this central area.
Cores taken along the edge of the flow would be close to the boundary layer. Although these should be expected to have older ice than the higher velocity center of the flow, the time profiles would be complex.
If someone would take an ice core angled steeply in the direction of flow from the brittle layer to the high velocity center of the flow, then the time profile would be expanded. The newest ice should be at the bottom nearest the high velocity center of flow and the oldest ice should be close to the brittle layer interface.
The image above did not seem to work. This one shows laminar flow profile in a pipe.
Here is a somewhat different representation of laminar flow:
The flow at Guliya Site 2 was 4.7 m /year, which seems like a lot if you’re trying to get high-resolution proxy record. I would have thought that that would require some complicated deconvolving in which uncertainties would multiply.
It occurs to me that if Brooks’ laminar flow hypothesis is correct, then to date ice cores based solely on a function of depth is to make a fundamental systemic error in the ice cores of glaciers with significant non-zero velocity.
Re: 4
Steve,
4.7 m/year is likely the average flow for Guliya, since this is relatively easy to measure; not the velocity at the center of the glacier, which is much more difficult to determine. The maximum velocity could be 2X the average, or higher.
Since the end of the glacier is also frozen, a better model than a simple tube might be a tube that contains a piston. In this case, the laminar flow would still occur but break in to turbulent flow when it reaches the piston.
Brooks,
The figure you show is for laminar pipe flow, whose geometry is entirely different from what one would expect for a glacier.
If the ice in a glacier acted like a Newtonian fluid experiencing some sort of steady pressure driven laminar flow (which I strongly suspect it does not), and the glacier could be treated as a two dimensional sheet with depth “H”, the velocity as a function of height,”y”, would have a parabolic form. ( V(y)= Ay**2 where the value of “A” depends on the applied pressure gradient and the fluid viscosity. ) This can be obtained by solving the steady state navier stokes equations, applying the no slip condition at the surface and a no stress condition at the top of hte glacier.)
That said: I may be wrong, but I suspect when Tim referred to a “plastic layer” he was implying the ice in that part of the glacier flowed a “a plastic fluid” of some sort, not a Newtonian fluid. In that case, the velocity profile would not obey the well know laminar profile — even for the case where the glacier “looks like” an infinite flat sheet of ice. The details of the velocity profile would then depend on the actual constitutive relation relating the stress tensor and the strain rate (and possibly other features) for plastic ice.
I left out a term: V(y)= A(y**2-2hy). That’s what I get for thinking upside down. (For the record, if you organize to create flow going left to right, A is negative.)
I googled a bit on flow physics for glaciers: the bulk is not treated as a single phase Newtonian fluid in any way shape or form. We should not expect the velocity profile to resemble laminar flow.
Ice caps like quelccaya have a radial flow from the summit, unlike cirque glaciers, which are common in the alps,
http://www-personal.umich.edu/~hoaglund/glacterm.html
Good discussion.
The term Plastic Layer was standard terminology in basic textbooks and was used to describe the difference between it and the Brittle Layer. I do not believe it was used in a strict sense to be like plastic, but rather had viscous properties. I do know there are difficulties in finding a material that simulates the flow of ice. The other problem is the ice tends to attach itself to a surface, especially in the brittle layer. A large crevasse called a bergschrund usually occurs at the top of the glacier near the head wall. The crevasse is formed when the plastic layer underneath flows and the brittle layer is pulled away but cracks instead of breaking free. It usually requires a certain depth of ice adequate for a Plastic Layer to form before the glacier begins to flow downhill.
Similar attachment occurs along the sides of the glaciers. This is complicated by the debris collecting along the side called a lateral moraine. Of course this discussion assumes the boundary between the Brittle and Plastic Layers is distinct, but like most interfaces it is a zone of transition that varies in thickness with conditions.
Tim:
In fluid mechanics the term “plastic” isn’t limited to describing the rheology of things we call “plastic” in the normal world. It’s just means a material act like a solid when low levels of stress are applied and flows when higher levels of stress are applied. (In constrast, newtonian fluids flow at any non-zero level of applied stress.)
This article describes some terms common in rheology. You’ll find both “viscoplastic” and “visco-elastic” listed.
As long as the ice is ice, and not water, I would assume it acts like a solid at lower levels of applied stress.
I’ve just edited this to include the Guliya information.
Lucia,
Thanks for your posts.
I would not expect ice flowing down a valley to behave as a Newtonion fluid. I would expect it to be shear thinning, possibly behaving like a Bingham plastic. Even as a shear thining fluid, I would not expect the flow to be outside the normal laminar range since I do not beleive that the the viscosity would become low enough.
I would expect that the boundary layer would be thick. With a thick boundary layer and high viscosity (even with shear thinning), I would expect a form of laminar flow with a roughly parabolic flow profile in the center. It would not be like the idealized graphics which I posted above, since these are meant to represent pipe flow with a realtively thin bounhdary layer.
Mud slides behave as a Bingham plastic, but they tend to have laminar flow characteristics.
Chris H,
You certainly could have turbulence develop at the snout. With any form of turbulence, there would be no way to create a time profile.
Lucia
My rheology prof was Bob Brodkey.
One of the things one discovers about ice in chemistry, is that it contains varying amounts of liquid water in the interstecies of the ice crystals, within which ions can migrate and reactions can happen. The liquid water disappears only at very low temperatures, unlikely to be attained in Earth glaciers.
Also, the melting point of ice is higher at greater pressures, e.g., here, meaning that at a given temperature, liquid water increases with depth in a glacier. This has got to affect the flow characteristics of the ice; at least to the extent of likely making the center of flow at greater depth in a glacier than it would otherwise be in dry-packed polycrystalline ice.
#16 – I’ve been browsing this. A point undoubtedly very familiar to glaciologists, but not publicized, is that mountain glaciers don’t get very thick – they seem to max out between 100 and 175 m. The reason seems to pertain to properties of ice on a slope. The flow rate increases both with pressure and with slope. If one browses through this lecture, slide 60 has an interesting table showing that at a slope of 5 degrees and tgemperature of 0 deg C, deformation increases from 4.7 m/year to 75 m/year as you go from 100 m depth to 200 m depth. Rates are also highly nonlinear (but presumably monotonic)in temperature and slope.
Another source says:
#3. Brooks, if one had the type of flow illustrated here (which seems plausible), then if you drilled at 6200 m in a glacier with a 6700 m summit and the ice is 250 m thick at 6200 m (and 100 m thick at the summit), then presumably the ice at 100 m (at the 6200 m site) is flowing faster than at surface and would, mutatis mutandi, orginated at higher elevations adding a cold bias to older measurements (whatever they were measuring).
I’ve got a question about dust layering in flow zones. I’ve noticed that fresh stockpiles of minerals sometimes seem to have layering that looks like laminations and thought that someone looking at something like this in nature might interpret these “laminations” as events. Is it possible that something like this is going in flow zones of glaciers? (I’m just wondering; I’m not asserting anything.) The laminar flow in glaciers seems to occur because ice is not isotropic- would dust have an impact on this flow such that dust would tend to stick together under this sort of flow regime, so that a type of quasi-regularity emerged when it was drilled in a flow zone?
Hi Brooks,
Bob’s a great guy! I first met him at the Muff-mech. (Midwestern Fluid Mechanics Retreat.)
As to the Glacier velocity profile: Now with the big caveat that I know nothing about glaciers if
1) ice acts like a Bingham Plastic with a yield stress TauO.(which it may)
2) the glacier looks like an infinitely large sheet laying on a flat surface (which it may not, and it may or may not be possible to model it this way.)
3) the properties don’t vary in the sheet (which based on what Frank said in 16 is not true– but this is still a good approximation for start in blog comments.)
4) The glacier is moving steadily under some applied pressure gradient -dP/dx=G. (Which is likely due to gravity.)
5) Flow is laminar.
Then, the velocity profile won’t look precisely parabolic! T
he effect of the yield stress is to create a large constant velocity “plug” of solid ice sitting at the top of the glacier. (This might be what Tim describes as a “brittle layer”. ) The thickness of this layer is the absolute value of Yc= Tau0/G. My guess is Yc tends to be fairly deep. Tim said glaciers don’t move until they are deep.
Below this “plug” the “viscous” type behavior takes over. In this region, the velocity would be parabolic.
So, under this dramatically oversimplified glacier model, the profile would be constant over a fairly large depth near the top of the glacier. It would vary parabolically below this top layer. (The no slip condition may or may not apply at the base. I know that ice can melt under pressure, and when that happens, you get a stokes layer under the plastic layer. If that forms, you need to solve the stokes layer and match velocities between the ice and the water.)
I could sketch this for you– but I need to go drink coffee and then shop for presents.
The upshot is though: There would likely be a very large constant velocity region, meaning those coring wouldn’t have to deal with the complications due to a parabolic profile when evaluating data.
#18. Lucia, in most cases, it looks like they try to core at a summit, which would obviously mitigate flow problems a lot. Guliya Core 2 is a bit of an oddball by this criterion as it looks like it’s in a flow zone.
Steve:
I don’t find anything in your comment #19 that that relates to my observation in #18.
I understood your post to suggest that interpreting core data might be complicated if cores were taken in a flow region. Brooks and I were discussing likely velocity profiles that might apply in some ideal circumstances that could, hypothetically, occur away from the summit– and specifically in the core region where flow might be fully developed. (The caveat being: it would only be “fully developed” if the geometry weren’t anywhere as complicated as it is.)
The shape of these profiles, and the profiles leading up to the core would, presumably, be the “complications” that concern you.
So, since I can’t see the relationship between your comment, and #18, could you elaborate. (This is, for the record a straightforward question, not any sort of attempt to counter argue anything.)
Lucia,
Re: 18
I agree with your comments.
Pat Frank memntioned that pressure reduces the melting point of ice. It would therefore follow that deeper ice would likely have lower viscosity than the ice closer to the surface. Steve’s comment about acceleration deeper in glaciers supports this.
I do not think that the vertical flow profile will look like a typical parabola. I would expect that under the brittle layer, the profile would be a squashed parabola with the peak velocity nearer to the bottom than to the brittle layer interface. In my opinion, this would be caused by the non-Newtonian character of ice (shear thinning) and the decrease in viscosity with depth. I agree with you that the brittle layer, since it does not have much of a velocity gradient with respect to depth, would have a straight forward age to depth relationship.
I agree with you about the time profile of the brittle layer. I would expect that The brittle layer would move more slowly than the ice below it since it would be slowed by contact at the sides of the glacial valley. It is the underlying ice below the brittle layer which would have a very complex time profile. For example, the highest velocity portion of the flow would be much more recent than the ice above or below it. Because of this, cores drilled in any sort of flowing ice would be expected to have most unusual time profiles.
Guliya summit sites 1 and 2 are at the upper end of the glacier and presumably out of the flowing region. These may well have a time profile similar to the ice domes in Antartica. Summit site 4, however, may be in a flowing section of the glacier.
The cartoon does not give much of an indication of the flow profile under the brittle layer, but it does show that horizontal ice layers in the accumulation zone turn roughly 90 as they head into the flowing portion of the glacier. This makes sense to me, but it would certainly add to the complexity of the time profile in the flowing ice.
Steve (re 17), dust layers in the ice should effect the flow cahracteristics if the dust layers are parrallel to the flow. I say this in light of a conversation that I had with a mountain guide in eatern BC. Our discussion concerned how snow layers effect avalanche dynamics. He said that when you dig a snow pit, you can see the interfaces between the snow layers from each storm. He said that some layers adhered to the layers below, and others did not. Poor adherence increased the potential for avalanches. Assuming that ice behaves in similar ways, there could be an influence of dust layers on glacier flow.
Lucia (re 20)
I think that Steve is concerned that because the flow profiles can be complex in any flowing portion of a glacier, it would make the age to depth relationship much different than in the case of an ice dome. These have very little ice flow and thus the age is a function of the core depth.
On the first bit: If Steve is saying the relationship between core depth and time will be non-linear, I agree. But I would agree even if the velocity field were simple or didn’t matter. For one thing, snow falls at a non constant rate. Is he worried it might not be monotonic? I have yet to see anything to suggest the velocity field would cause that. (Turbulence could. But is anyone suggesting turbulent mixing inside the bulk ice? If so, the core won’t show any bands, and will look very odd indeed.)
I’m confused. You actually gave two theoris for why the velocity profile below the brittle layer is complicated and weird. First, you suggested it would happen due to the shear thinning.
How would the shear thinning behavior shift the peak velocity to a point well below the brittle layer/ viscous layer interface? If we look at a 1d steady, fully developed laminar flow problem the analysis can be solved analytically for a wide variety of viscosities as a function of depth. Are we envisioning more or less the same problem and boundary conditions? In the idealized problem I’m imagining, the peak velocity has to increase monotonically from the “dirt” (where the no-slip condition applies) the the “air/ice” interface where zero shear stress is applied.
In a fully developed flow, the pressure gradient in “x” would be a constant (and it’s magnitude depends on slope– as it would in an open channel type flow.)Here’s the cartoon of the velocity profile if the flow is Bigham plastic, with a coordinate system showing “y” pointing up.
Are you envisioning different boundary conditions?
Because for this idealization, the first step is to determine that
d (tau / dy) = dp/dx applies in the ice.
The next step is tau= (dp/dx) y because tau=0 at y=0.
For any solution, long as the constitutive relation for stress, tau, says stress increases monotonically with (du/dy), we’ll get a monotonically varying velocity between the dirt/ice interface and the air/ice interface.
For a Bingham plastic, you get a parabola below a constant velocity region.
So, anyway, I don’t see how shear thinning would result in a maximum velocity below the brittle layer.
——
Now, on the other hand, if your reasoning is the sides of brittle layer clings to the sides of the mountain, then I might believe it has a slower velocity. But, in that case, I guess I’d need to hear whether or not the brittle layers have been observed to cling to the sides of the mountain. Why wouldn’t the ice crack or break so the block would start sliding? (I know nothing about actual glaciers. What do the glacier people say happens?)
RE#20-23
You may find the following page useful to this discussion:
http://www.homepage.montana.edu/~geol445/hyperglac/systems2/
Lucia,
Ice is viscoelastic based on the Montana link.
Have any studies been done to measure the velocity profile at different depths in glaciers?
Brooks: Did you look at the equations for the constititive models for stress? Or the figures? Did you see any time dependence? Would you call those viscoelastic or viscoplastic?
Given that there as a) no time dependence and b) all suggested constitutive relations show increasing stress with increasing strain rate, how does anything the Montana page say contradict my observations above?
John A: Re 26. I don’t know. I’d like to see some too.
Until I see something to suggest the velocity profile has a maximum below the brittle layer, I will continue to suspect it does not because so far, I have seen no reason to believe such a unusual profile could occur.
Here’s a simple calculation that seems to more or less balance. Consider a pie-slice of the Guliya glacier over an angle . Consider a profile r km from the summit. Then the annual accumulation of snow in the slice within a distance r meters from the summit is approximately
 where a is the accumulation in meters. Here let’s say that r is 5000 meters and a 0.5 meters.
This has to exit through a vertical area of height H i.e. area . At Guliya Site 2 H is 308 meters; at Site 1 is it about 200 m. Thus, in balance,
or
This rough approximation yields v= .5*5000*.5/300 = 4.2 m/year as compared with Thompson’s reported 4.7 m/year.
This is obviously a very trivial calculation and I’m not for a nano-second suggesting that this represents any novelty – only that for non-specialists like myself, one has to think about exactly what’s involved in these flowing glaciers. I remain baffled as to how a core taken in a high flow area like Guliya Site 2 can measure anything with much confidence.
Steve:
The Latex commands are broken on my screen. However, that looks like a perfectly reasonable back of the envelope method of determining a bulk flow rate in the vicinity of 4-5 m/year.
But what precisely about this motion is bothering you. If this all moved as a solid block, would this 5 m/year bother you? Are you worried the velocity field will be “weird” causing something to be particularly confusing? In what way?
(For the record, I’m willing to believe there could be problems. However, so far, I don’t see any “issues” with the velocity profiles from a fluid dynamics point of view. I’d be more concerned with the idea that crevasses open permitting rain water, dust, dead birds and century old swiss soldiers to fall in and contaminate the sample. Those issues have nothing to do with fluid mechanics or the streak lines shown in the figure in your article. )
Lucia, what’s on my mind here is that Thompson reported that Dauopu Core #1 was drilled downflow and was “severely compromised” by ice flow. See my notes here . Thompson:
Guliya Site #2 is in a down-flow location (6200 m versus a summit of 6700 m). It is obviously in a flow region. I wonder what criteria were used to say that Dasuopu Core #1 was compromised and the extent to which those criteria might have applied at Guliya Site #2. Guliya was drilled earlier than Dasuopu. In the earlier case was Thompson attracted by thickness of Guliya Site #2 rather than the 108 m of the Summit which wasn’t drilled?
Unfortunately, the images aren’t showing. Could you check your wp-images folder or the links?
In general: flow over a complex geometry, now or in the past could cause odd flow profiles. However, precisely which type would depend strongly on the geometry (which is why I want to see the images again).
I would, based on understanding of fluid mechanics tend to believe any glaciologist should avoid taking a core in a flow region. (It doesn’t take any great understanding. It is nicer if you get a core where the main thing going on is snow fell on top and accumulated. ) The “next” best thing is to try for a region where you think the glacier sort of acted like a big flat sheet sliding down an inclined cookie sheet. (That’s sort of what I was evaluating above. ) Bending the cookie sheet to form a sort of “chute” might not be too bad.
But if you start getting all sorts of odd changes in geometry, sudden rises and/ or cliff-like drops then things could get confusing. (The “cliffs” don’t have to be large– I just mean on the length scale of the glacier. I could show you images of what happens when things flow over backward facing steps. I don’t know if it has much relevance to glaciers– but *that* where you can get really, really weird things happening to the level vs. age profiles. )
My guess (and I know nothing about glaciers) is that if something like this happened, the core itself will look “weird”. Once it looks “weird” trying to back out where ice at a particular depth came from because practically impossible. Someone could try to work some sort of inverse fluid dynamics solution– but a) they would lack information to do it and b) any errors in the solutoin would result in errors in interpreting the core. So, basically, the solution is: don’t core in spots where the ice may have once have flown in a complex geometry.
#32. We’ll try to get the images back; they seem to have taken a walk during the conversion to the new server. I’d be interested in any images of odd flow profiles. It’s not something that I’ve thought about previously, but the Thompson data overall seems odd – and of course, his reporting is abysmal so one is always trying to decode things. There’s something that may show drill locations here. What’s made me wonder about the flow is a little information about Dasuopu that emerged only in 2005. Thompson et al Science 2000 said of Core 1 in the flow zone:
However, Davis and Thompson 2005 said:
Age-depth information at the Summit Core is spotty. 42.2 m depth is dated to 1963 (tritium) and a diagram shows 115.5 m dated to 1810. I’ve interpolated depths for 1945 and 1922 at the summit linearly – I could do it with an exponential fit, but it doesn’t look like it would make more than a few meters difference for now (based on a plot). Core 1 didn’t hit bedrock and the thinning of the white slice may not exist. What does seem to be established is the thickening of the 1922-1945 snow shown in medium grey. This is almost certainly less than 20 m in thickness at the summit and is 86 m in thickness at Core 1 in the flow zone. To my knowledge, this has never been discussed in the ice core literature. What does this imply? I don’t know, I’m just feeling my way through this right now. But you’d have to assume that the Guliya glacier would do something similar. However, this is complicated by the hollow; I’ll post up a sketch in a few minutes.
Sketch of Dasuopu cross-section (estimated). Dark gey – bedrock, not known at Core 1. Lightest grey – 1997 to 1945 ice; medium grey – 1945 to 1922 ice; white – older than 1922 ice.
Lucia, here’s a sketch of an estimate of Guliya. The summit is at 6700 m with 103 m depth (radar); Site 2 at 6200 m with a 308.6 m core to bedrock and Site 1 (shown here at 6200 m as well based on Thompson et al NATO 1996 Figure 2c) with 200 m depth (from radar) with a reported unconformity at 83 m. The ice accumulation here is about 1/4 that of Dasuopu. Why wouldn’t one have a thickening of ice downslope here as at Dasuopu. IF there’s an unconformity at 83 m downslope from Site 2 (at Site 1), shouldn’t one be worried about possible unconformities here as well?
Guliya Sketch. Dark grey – bedrock. Unconformity at 83 m in Core 1. Core 2 is 308.6 m from drilling; 200 meters at Core 1 site from radar. Elevation estimated from Thompson et al NATO 1996 Figure 2c (inconsistent with T96 Table 1). In Core 2, layers are 16.9 cm apart at 82 meters in depth. Gradient of 8.75% from summit to Core 2. 103 m at Summit.
Hello All and Happy Christmas
Just a couple of observations…..internal shearing and deformation in a glacier is obviously much reduced when the glacier is warm-based and undergoing basal sliding. Second, this situation is complicated in polythermal glaciers (like the one under consideration must be given its altitude). I can’t imagine anything useful can be gained from coring in areas of rapidly moving ice.
#35. Stephan, does 4.7 m/year qualify as “rapidly moving” in your terms? (It seems fast to me.) That’s the speed at the site of Guliya Core 2. Adding another layer of inutility to this particular site is the inconsistent dating systems applied to this site – as noted elsewhere, three inconsistent versions of this core have been used in 2006 peer-reviewed literature.
#35. Thompson et al NATO 1996 Figure 3 shows a vertical temperature profile for Gliya Core 2, in which temperatures at 10 meters are -15.6 deg C, increasing to -2.1 deg C at the ice/bedrock contact at a depth of 308.6 m (in a topographic depression.)
Re #36
Hi Steve. 4.7m/yr seems pretty average to me for high altitude/cold-based and/or continental glaciers. The ones I usually work on are moving about this much per day (high accumulation, calving, warm-based etc) and are therefore useless for coring.
Has the relationship between flow speed and deformity of the core’s properties been quantified, either in theory or in practice?
Bender:
Presumably, the anwer is “yes”. You can see some rheograms at the bottom of this page.
http://www.homepage.montana.edu/~geol445/hyperglac/systems2/#flow
Unfortunately, even if we got all the data available, the glacier flows occur in complex geometries. (I also assume these things start and stop?)
Steve: with respect to the image in #33– is that glacier spreading laterally as it narrows flowing downhill? That could explain thinning of the white part. Otherwise, I could envision quite a few things cause the middle region to thicken somewhat under flow conditions.
As to the slow in figure #34, all I can say is “oh, ick!”
#40. I presume that “ick” is a technical term in rheology. Being unfamiliar with rheological terms myself, could you expand a little?
Visually it looks to me like the glaciers emanate out from a dome and then channelize after a certain point. I must say that I’m baffled as to how uphill ice from (say) 1765 located over a km away from one another knows how to emerge at a pinch-point at precisely the 1765 level at the pinch-point within a cm or so. (I presume that it doesn’t really and that’s why they prefer to drill at summits.)
Thompson has recently said that the base of the Guliya core contains 500,000 year old ice – the oldest tropical glacier ice. It’s like the competition between 19th century paleontologists to have the oldest horse fossil.
HEre’s an interesting table from this lecture about ice properties:
Temperature at the base of the Guliya glacier (Core 2) was -2.1 deg C at 300 m in depth. The gradient seems to easily be at least 5 degrees. Some of the functions seem to be very nonlinear – notice that the flow at 5 degrees slope and 0 deg C goes from 4.7 m/year at 100 m depth to 75 m/year at 200 m depth. So at 300 m depth and -2.1 deg C, there must be some pretty serious flow. THat must be why the downslope Core at Dasuopu is young to such depths – high flow rates.
Steve, I found a good paper discussing the shear characteristics at various depths at Law Dome here.
w.
#43. Willis, it looks to me like Law Dome is both flatter and colder than Guliya. I don’t have time to wade through the paper – did you notice relevant parameters for Guliya circumstances?
Lucia,
I do not disagree with your arguments. I also believe that your comments are a valuable contribution to CA.
My comments are an attempt on my part to visualize how the annual ice layers travel from the accumulation zone, into and through the flowing section of the glacier.
It appears to me that only portions of the accumulation zone would have consistent annual layers similar to ice cores which have been drilled in Antartica. This indicates to me that some parts of of the accumulation zone as well as the flowing portions of the glacier would have a complex chronological makeup. The rather steep velocity profile that Steve M referenced for Guliya in post 42 makes it appear to me that the oldest ice is in the upper and lower boundary layers, whereas the rapidly flowing portions would be much composed of much younger ice.