One of the common operations in the types of analyses done here is simply counting things. I am constantly amazed by the tremendous productivity of the tapply function in R – I use it over and over – for producing interesting results at warp speed. There’s nothing particularly novel in how I use it, but I’ve got a lot of experience now and have a few little techniques that I find useful. I made a little improvement in how I use it the other day and thought that it might be useful to some readers to illustrate this. The method has no mathematical significance – but efficiency in handling new data sets is important for what I do and I thought that I write it up and illustrate a couple of simple and useful techniques. The issue arise during the collation of hurricane landfall data.
The most recent dataset is at http://www.aoml.noaa.gov/hrd/hurdat/ushurrlist18512005-gt.txt ; this appears to be a little more recent that the dataset http://www.aoml.noaa.gov/hrd/hurdat/ushurrlist.htm that Willis used in making a count posted up in October. The archived information is quite messy in format and it took me a couple of hours to massage the data into a consistent tab-separated file with each gridcell representing one datum for one hurricane. I also matched each hurricane to the Atlantic basin hurricane data set by attaching an id number to each landfall hurricane by matching year-name combinations where available; and by matching year-landfall combinations in earlier years with a couple of years requiring manual inspection. I’ve posted up my collation here http://data.climateaudit.org/data/hurricane/landfall.hurdat.csv in a tab-separated ascii file, that you can access as follows:
landfall< -read.table("http://data.climateaudit.org/data/hurricane/hurdat/landfall.hurdat.csv",sep="\t",header=TRUE)
Now let's say that you want to count the number of landfall hurricanes by year. I organize my datasets so that each record has an id and a year, maing use of tapply possible. If you wanted to calculate the average landfall windspeed by year, you could just do (the na.rm option excludes NA values from the calculation.)
landfall.wind< – tapply(landfall$wind,landfall$year,mean,na.rm=TRUE)
In order to do counts, I use the !is.na function and then sum. For example:.
count< – tapply(!is.na(landfall$year),landfall$year,sum)
Usually, one wants a time series and this method only returns values for years with values with the return showing the year as a name. In the past, through a couple of fiddly but not complicated operations, I’ve massaged such vectors to recover a time series. However, I noticed that, if you use the “levels” option in the “factor” function in R, you can avoid these fiddly operations, through the following:
count< – tapply(!is.na(landfall$year),factor(landfall$year,levels=1851:2006),sum)
This returns a value for each year with NA rather than 0 for years with no values. Sometimes you want NA if it isn’t observed; sometimes you want 0. If you want 0, this can be done by simply doing (I use !is,na and is.na a lot):
count[is.na(count)]< -0 #assigns 0 to NA values
If you want this as a time-series object, you can simply do (or the lines can be combined):
count< – ts( count ,start=1851)
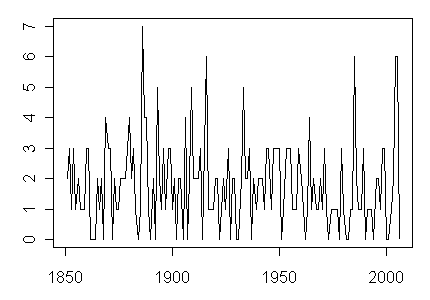
One gets a quick plot as follows (I’ve increasingly used the plot function with parameters, but the ts.plot and plot.ts functions are even quicker, but sacrifice a little control):
par(mar=c(3,3,1,1)); plot(1851:2006,count,type=”l”,xlab=””,ylab=””)

Figure 1. Count of Annual Landfalling Hurricanesà’à
For analyses in which I want to do counts or averages or medians on restrictions, I nearly always apply a logical operator first and then use tapply the same way. Here’s a restriction for landfalls with speed greater than 65 knots, then one can use a logical limitation prior to the tapply function – I do this all the time in various studies. Thus:
temp=65);
count< – ts( tapply(!is.na(landfall$year[temp]),factor(landfall$year[temp],levels=1851:2006),sum) ,start=1851);count[is.na(count)]<-0
Easy as pi.


5 Comments
I thought I would take my second attempt at R, my first being when Dr. Juckes was having trouble with your Mann Hockey Stick replicator.
I cut and paste the line with landfall and read.table (less than sign omitted here for fear of unintended blog consequences) into a script on my computer. I ran it and received the following error:
Error: object “landfall” not found
I deleted a spurious appearing space between the less than sign and the subsequent – sign, and the line appeared to execute okay. I did this with subsequent lines that I cut and paste from this thread and they also appeared to execute okay. When I got down to plotting using the par statement, it failed.
Error: syntax error in ” plot(1851:2006,count,type=””
Not expecting you to waste your valuable time on my baby steps with R, but if you see something obvious I would appreciate a redirect.
To: New R users,
Steve writes R scripts using “=65)
and
temp = (landfall$wind>=65)
are identical. If, like me, you grew up on languages like Basic and Fortran, the latter is easier to read – and it is definitely easier to type!
(When you really want to say “equals” as opposed to “is assigned the value of the following expession”, the operator is “==”, as in: if (a == b))
Arrrgh!
Why can’t the comment box do WISIWIG?
The point I was trying to make is that in current versions of R you can use a simple “=” instead of the more cumbersome “less_than hyphen” symbol combination as the assignment operator:
temp = (landfall$wind>=65) is the same as
temp “less_than hyphen” (landfall$wind>=65)
EVan this is only a problem when I paste these things into WordPress. Sorry about that.
Here’s a hint:
If you want to post code into the comments and stop WordPress from interpreting the symbols, then use the tags.