Beneath the seemingly placid world of U.S. weather co-operatives, recent analysts have found a turbulent world of changing observation times, with regime change after regime change. Hansen and Karl have been forced – unwillingly, I’m sure – to adjust past temperatures downwards. In contrast to the seemingly almost Iraqian chaos of the U.S. weather observation network, Jones et al 1990 reported that islands of homogeneous measurement could be found in Russia and China, where dutiful comrades seemingly set aside minor worldly concerns, like revolutions and famines, and homogeneously attended to their max-min thermometers creating, in the process, what Peterson 2003 described as two of the few studies that used “homogeneous data”.
When David Lean made the movie Dr Zhivago – a blockbuster in my teenage years with Julie Christie then a famous beauty – he must have forgotten the scenes where Omar Sharif and Julie Christie, just before fleeing, instructed arriving soldiers on how to transcribe max-min thermometer readings, with time suspended as in a Roadrunner cartoon so that the soldiers could take on these duties before Julie and Omar fled. In the tranquil world of Jones et al 1990, such scenes must have been repeated time and time again throughout the gulags.
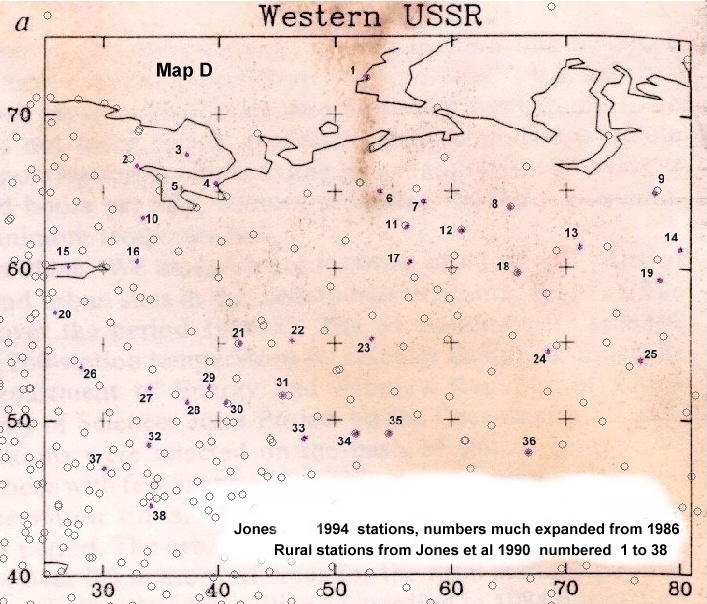
Jones et al 1990 did not do anything as mundane as identifying the sites in their Russian “rural” network (and have thus far resisted efforts to identify the sites), but Jones et al 1990 does have a chicken-scratch map. Warwick Hughes has enlarged the chicken-scratch map and begun the process of trying to identify the 38 sites with some partial success. His analysis is here – see, for example the map here. Some sites can be plausibly identified. Malye Karmakuly on Novaya Zemlya is one such site, about which I’ll make some comments today.
Let’s re-visit the quality control for the Russian network that Jones described as follows:
All the site records were assessed for artefacts due to factors such as site moves or changing methods used to calculate monthly mean temperatures. At twelve stations the observing station was moved slightly. Comparisons with neighboring sites were made before and after each change and, where necessary, corrections were made to ensure homogeneity of the rural-station record. No corrections were deemed necessary for the remaining 26 stations where no station moves were reported.
So Jones has specifically verified the integrity of each of the 38 stations in the Russian network. Let’s look at the first site that Warwick identified – the lat-long’s of the most northerly station in the Jones Figure are approximately 72.37N, 52.7E, which matches WMO station 207440 (Malye Karmakuly) on Novaya Zemlya. There are no other nearby candidates in any listing of stations. This station is listed in both GHCN v1 in 1992 (NDP041) and in the current GHCN v2 (updated through Feb 2007). So I think that we can safely proceed on the assumption that this temperature series is one of 38 stations in Jones’ very homogeneous Russian network and use this to spot-check the degree of homogeneity.
I extracted data for WMO station 20744 from both GHCN v1 (NDP041) and GHCN v2. The first figure is a plot of the information in GHCN v1 – the version contemporary with Jones et al 1990.
Figure 1. Malye Karmakuly annual temperature from GHCN v1 (NDP041)
Petty minds may think that they see gaps in this graph, suggesting that the record may not be totally homogeneous. A report on NDP041 here states that over 40% of the data from this site is missing. Sure enough when one examines the raw data, although the data goes to 1990, one observes gaps as follows:
from Oct 1900 to Aug 1901;
from Aug 1910 to Dec 1912;
only odds and ends from Nov 1916 to Sep 1921
none from July 1940 to Jul 1942
none from Jan 1951 to Dec 1960;
none from Apr 1963 to Dec 1980
The corresponding information from GHCN v2 is shown in the next figure, with more continuity. Two separate identifiers are noted and are colored black and red respectively. The values from GHCN v1 are marked with blue circles and match closely to GHCN v2 values where they overlap. While there are additional values in this data set, like GHCN v1, the values do not extend further to the present than 1990.

Figure 2. Malye Karmakuly fromn GHCN v2
Let’s think about the homogeneity of this record and whether this provides evidence that the Russian network achieved a homogeneity that eluded observers in the turbulent United States. In both GHCN v1 and GHCN v2, there are notable interruptions from Nov 1916 to Sep 1921 and from July 1940 to July 1942. One can surmise that the comrades responsible for the max-min thermometers in these periods may have given priority to other things. Astonishing as this possibility may seem, the shameful truth is that the responsible comrade seems to abandoned his thermometer and failed to preserve the homogeneity of the record. So how did Jones establish the homogeneity of the record before and after Nov 1916-Sep 1921 and July 1940-July 1942? At this remove, it seems hard to understand Jones’ confidence. But the ways of the Team are deep and mysterious.
The period from 1951-1980 even has its own interest. In GHCN v1 (1992), 27 of 30 years were missing in GHCN v1 (to which Jones has sent information on 1872 stations.) GHCN v2 has second record which fills in most of the missing years. However, note that there are a couple of years in which the two versions overlap and the red record is higher than the black record in both years. What adjustments did Jones make, if any? Another Caramilk secret.
Was the information in GHCN v2 available to Jones et al 1990 but not to GHCN? The mind boggles at the thought. Novaya Zemlya was home to the Russian nuclear program. Maybe local temperatures in Novaya Zemlya were classified. Now we know that the Team has access to internationally sensitive high-security data – such as the password-protected tree ring data at the CRU website – long sought after by international agents. Did Jones have access to high-clearance Malye Karmakuly max-min thermometer readings? Ah, intrigue everywhere.
But leaving aside the Team’s access to classified information, does this record show evidence that dutiful comrades were making homogeneous temperature records that observers in the turbulent United States Co-operative Network were unable to achieve? Not to me. And when you think about it, the idea of looking to Russian and Chinese records as havens of homogeneous temperature measurement, unavailable elsewhere, is completely preposterous. Novaya Zemlya certainly doesn’t support this idea.


66 Comments
I am sure there are those who would object to your tone, but I think it does a good job here of helping to indicate the level of absurdity in the “homogeneous” claim.
SteveM,
I am completely with you on this: The temperature “records” have now entered the realm of comedy. I realize some people figured this out years ago — I’m often the slow boat in the convoy — but it amazes me anyway.
The island that was home to 224 megatons of above-ground nuclear tests including the big Ivan bomb (50 megatons that caused third degree burns 100 kms away) is a good example of homogeneous temperature records?
It seems like every other day Steve is finding a significant data problem with peer reviewed climate science. And Steve is only a retired geologist. Imagine if climate scientists actually reviewed the data?
Silly me, they have moved on. They can’t waste their valuable time auditing the peer reviewed settled science. They must spend their time on lucrative new studies to save the planet from AGW.
To my knowledge homogeneity is claimed when the thermometer hasn’t moved. Gaps in recording is a continuitity problem not a homogeneity problem, although a recording gap does make a dataset suspect.
There is some reasonable precedent for doubting the validity of some russian statistics.
In 1937, Stalin had a census of the population, and he had considerable interest invested in showing that his leadership had increased the population. The head of census did not pad the figures, and they were three million short; so he was summarily shot, with other members of the census board; e.g. http://www.fathom.com/feature/35089/index.html.
Thereafter, the census board got exactly the figures it was asked for.
This isn’t a unique example; there is Lysenkoism and Lamarckism, and I am sure others besides.
yours
per
#5. Hans, I know that you’re not defending this, but how would one know that the thermometer didn’t move before and after, say the Russian Revolution – a regime change, if you will. Or in World War II. I picture a brave Russian meteorologist – portrayed perhaps by John Hodgman – wielding only a thermometer successfully repelling an entire Panzer division. But oops, he moved the thermometer.
re #7: “how would one know that the thermometer didn’t move before and after, say the Russian Revolution”
You don’t. A way to test for homogeneity is to compare a station with neighbours in the next 1000 km. If you can’t find neighbours, the data is useless, as inhomogeneity jumps are typically 0.5 degrees or more.
Here is an example from Stuttgart where homogeneity is claimed, however, comparison with six neighbours shows a jump.
The Red Chinese did a great deal to homogenize their observers from 1949-1975. No doubt it made for careful records at all weather stations.
Re #7
It is possible that a new policy made the neighbors change at the same time and Stuttgart kept to the old ways. Probably not but when you calculate a trend that would figure into your confidence. I was born very near there and see that it has warmed up about 0.5C over the following years :).
It seems to me that one shouldn’t try to homogenize the data. Rather a new record should start every time a station is moved, every time a new thermometer is installed, every time a new “time of day” procedure is adopted, and so forth. Instead of having say 2000 so-called “homogeneous records worldwide, one would then have say 20,000 short really homogeneous records. Then one could deal with climate change by looking at the first dervative of these numerous records.
Just a thought.
For Malye Karmakuly temperature records, I suggest it is a good proxy for Vodka reserves: low in winter, replete in summer. Periods of voluntary abstinence speak for themselves.
#11
Good point Doug:
Although it is not comprised of 2000 individual records, the Central England Temperature (CET) originally produced by Manley is a somewhat similar homogenizing of many records. There are some difficulties with his approach and good critiques have been produced, nontheless, it stands as a long ‘continuous’ record. One criticism was that the urban heat island effect affected some stations and not others. As far as I know Manley did not record how he chose and blended the various records. I wrote Manley and never received an answer and Hubert Lamb told me it was never recorded or disclosed as far as he knew. The other difference with Manley’s CET is that it was made up of indiviudal instrumental records and ‘official’ government records.
I am begining to realise this “average global temperature” thing is madness.
It’s a bit like constructing a car from components from hundreds of other old cars and then trying to calculate the cars odometer reading based on the multitude of components and finally claiming – “genuine mileage”.
Russian stations are also listed with the downloadable data about temperature and precipitation at the Russian site
http://meteo.ru/data_temperat_precipitation/
It’s in Russian alphabet with geographic positions in degrees.
Aw, that’s the already mentioned 223 sites only.
On the other hand, I wouldn’t dismiss Russian data so out of hand – I’ve read a Russian book in my childhood about science (could have been in 1955 or so) and my overall impression was that the meteorology and forecasts were viewed as sorta “high status” and important, although that wishful thinking along the lines of “we will control rain and wind” (one day, that is) was also present. I note, however, that the recent talk about saving the planet by cutting CO2 emissions is very similar in tone to that of the Soviet 50’s.
There are descriptions of various meteo stations and their history in Russian available on the web, some of them aren’t among the “chosen” 223 ones.
re #11: I completely agree. This is how I would handle the data (“median temperature of the world”):
1) For each station (raw data) take the first difference between monthly values (I think this idea in climate circles is attributed to Peterson et al 1998; this is rather standard approach in many other fields handling similar time series).
2) Divide stations to grid cells
3) Take median of available differences (for each month) within each grid cell
4) Calculate the desired spatial target (e.g., globe) by (areal size) weighted median (maybe mean) of the available grid cells
I believe the first differences combined with the median should be rather powerful with respect to all type
of problems in data. Also this methods allows us to use all data available.
re 11#
The problem is that changes in observation parameters (thermometer type, change in surroundings) are poorly recorded, so the impression is given that data are taken with unchanging parameters.
I am inclined to agree with SteveM and Paul (#14). It seems like a fool’s errand to try to develop a “homogeneous” data set from this hodge-podge of factors and effects, some of which are likely highly correlated with historical events and therefore with time (which, because of its relationship to CO2 (and possibly urbanization), is an explanatory variable of primary interest). It is, simply put, a mess. To derive a homogeneous dataset would require detailed knowledge of a lot of factors that were likely not of interest at the time — the Russians did not know that we would be looking for trends 50 years later — and thus likely were not recorded.
What could be done, perhaps, is to describe the uncertainty in the data — to quantify realistically how little we really know. This requires only coarse information, at least to come up with a lower bound on the uncertainty. Given the lack of precision, the non-homogeneities, the countless other statistical issues, with a modest amount of work one could likely show conclusively that it is not possible to say anything meaningful about temperature changes of a few tenths of a degree.
Re: 18, 19.
Yes, there are a lot of unrecorded station changes. Perhaps some of them can teased out using first differences comparisons to nearby stations and other means, like looking for jumps in the number of extreme values after the first pass through the data.
I would do the first differences using the daily data. It is probably wise to do the analysis using daily, monthly, and yearly data and see how they compare.
Sounds like the definition of “homogenization” is, torture the data until you get the output you were looking for.
#20. TAC and others, my point here was actually a little narrower than people are assuming. I’m not saying that there is no useful information in this data. There probably is. I’m just commenting on the warranty about the data provided by Jones et al, the warranty being:
I cannot imagine what meta-data is in the back rooms of CRU that would put Jones in a position to make the above claim with respect to Malye Karmakuly. What do they really know about thermometer location at Malye Karmakuly before and after World War I? I would be surprised if they know anything at all. Maybe it was in the same position, maybe it wasn’t. There’s no way of knowing. The problem here is not necessarily the record – but the seemingly false claims regarding the comprehensiveness of their due diligence.
Given that Brohan et al 2006 has acknowledged that CRU lacks meta-data and many, if not most stations, one wonders exactly what supporting data exists at CRU for Malye Karmakuly and the other stations in the Russian “rural” network.
Obtaining consistent environmental samples over time requires substantial diligence and rigor. Unfortunately, most sampling programs are administered under less-than-ideal circumstances (finding levels; official support; et.), and as a result they do not provide ideal datasets for longitudinal studies.
The problems occur at many levels, some of which are obvious and many of which are subtle. For example, longterm sampling programs often fail to provide any clue as to what population is actually sampled (i.e. which population does each sample represent? What was it drawn from?). Even worse, many sampling programs have not even bothered to identify a specific target population, or it is at best loosely described, so even where individual samples were collected rigorously, it is hard to know what inferences can be drawn from the data (specifically, there is no reason to assume that a characteristic of the sampled population is relevant to a particular population of interest).
Researchers are not always aware of these issues, perhaps because these problems are much, much, more prevalent in long-term datasets than they are in short-term studies. Many of the problems arise specifically because time itself affects things. Sampling sites change; protocols change; program management style changes; geographical characteristics change; monitoring equipment evolves; different technicians work on the project; “improved” analytical techniques are developed and adopted. Except in the best programs (the ones I am involved in 😉 ), technicians fail to document what was actually done, or why. For non-uniform sampling designs, one typically finds unexpected observations in a dataset. In some cases — I have tracked some of these datapoints down — one discovers that a sample was collected out of curiosity; a technician or researcher noticed something “interesting” at the time. Years later, it may be impossible to figure out what such samples represent.
Is the situation hopeless? Of course not. But one must be realistic about the limitations of the data (IMHO, even when one can document a systematic error in a dataset, “correcting” the error generally introduce more uncertainties — specifically concerns about bias — than it eliminates).
The solution? Better sampling programs would help. However, in the meantime, reports based on long-term time-series datasets should recognize the uncertainties, which translates into lots of footnotes and caveats.
re 23
Could it be that that are using indicators in the data themselves and not meta-data to give a degree of confidence in data homogeneity. So if they do not see an indication that the data is inhomogeneous, they are making the assumption that it is homogeneous. So, for example, if they see a step change, they take this as an indication of inhomogeneity. However given data with significant gaps and the safe assumption that these gaps wee caused by major social disruptions such as revolutions, world wars etc, it would be difficult to see how they can safely use the lack of intrinsic indicators. The change would likely have happened during the data gap.
SteveM (#23), I submitted #24 before reading your #23. AFAICT, I think we agree on the major points.
I still do not understand how researches can place so much trust in obscure data from faraway places and times.
What I can’t figure out is why Jones would study UHI effects using such obscure and questionable data. Why not use data from the USA or Canada?
Even “slight” movements of the sensor, can have huge impacts on the resulting data.
The fact that Jones tries to trivialize these “slight” movements is just another indicator that he either
doesn’t understand how the data is collected, or he is being dishonest.
(If he doesn’t understand how the data is being collected, then he has no business trying to “homongenize” the
data.)
#23,
From what I have been getting from the comments, is that Jones is saying that since the sensor did not move hundreds of miles,
there is little chance that the move substantially affected the data being collected.
#11, an interesting idea but one that is probably fraught with error. First off, derivatives (slopes) are notoriously difficult to compute for short noisy time series. How would you go about doing a sensible calculation of the slopes in figure 1 on this thread? An assoicated problem is how do you assign errors to the data points? Do you use the instrumental error or the variance in the time series? I think that you want to use the variance to deal with the fact that the series are non-stationary and the great differences in temperature variation from place to place. Miami has a fairly constant year round temperature but the Dakotas have huge annual variations. Both should be reflected in the computation.
#27
Because
And that makes + 0.1 C (Karl HCN vs. gridded), or even + 0.38 C (Hansen vs. KARLa)
Malyie Karmakuly and its staff 😉
They say that the station is at work for 100 years. The server is rather slow.
Until and unless Jones is willing to relaese all of his data to allow testing of his conclusions, “Game, Set, Match to Mr. McIntyre”.
RE: Malye Karmakuly on Novaya Zemlya
I am trying to imagine the attention this station may have received during and for a while after the test of the Tsar Bomba (highest MT thermonuclear device ever tested, air dropped, air burst, believed to be 50MT or more). Who took readings during that time?
Re 23:
Certainly my own comment was not to minimize the work that is being done. In order to show how silly this “global temperature” thing is the data must be disected and be displayed for what it is. MHOI that Jones etc initially came up with this “global Temperature” idea without for a moment forseeing the future use to which such information would be used and the global impact that the IPCC would eventually have. The IPCC has grown so large that backing off of the claim has become impossible. Perhaps Jones is being prevented from releasing data so that the IPCC is protected. I suspect the IPCC is not unaware of the problems but will never pronounce that they were wrong but instead will downgrade and downgrade until they just pronounce that the science is now good and we are in control and the whole organisation will concentrate on setting up a warning system which will spend billions setting up better (?) data collection systems. Of course they will also claim victory in that it was all so necessary to get to the point of now being more aware of the potential problems and better prepared for the future. It’s called covering your ***.
RE: #34 – Minor historical note, the Tsar Bomba test, combined with the Cuban Missile Crisis, must have impressed even the warhawkish JFK, for not long after this sequence of events, the Atmospheric Test Ban treaty was signed. Of course, there were also additional practical considerations beyond the sheer fear factor, which related to all atmospheric testing no matter what the megatonnage – EMP issues, fallout and … aerosols. That last one a “hold that thought for another day” topic.
Completely out of context, and probably a niaf question, to boot;
Can someone explain (in short words, please) why time of reading of a US min-max thermometer introduces variability in observed temperature ?
jd
Open mouth, insert spelling mistake…
Sorry, re:37 – Not only can I not spell, but I’ve now found Steve M’s explanation of the observation time-of-day effect on mean temperature calculations.
RE: #6 – RE: Russian “statistics” – That population stats issue is a great example. And it cuts both ways. These days, we hear lots of hay being made about “declining Russian population.” And yet, Russia’s GDP is a right energetic 6 or so %, making Russia sort of a minor league “Asian Tiger.” Something doesn’t compute here. While certainly, a nation with declining population could possibly have this sort of economic growth. And no doubt, the oil thing plays a role. However, in general, you don’t see a nation with a notable population decline and higher than global normal GDP growth. So why would Russian lie about population statistics in the negative direction? Read Sun Tzu.
#29
I can move a sensor from my backyard to my front yard and get a differing micro
climate. My house faces due north. I live in Saint Paul MN. In the late winter
or early spring when the snow is melting it melts much faster in my backyard
as opposed to my front yard. The grass greens up about 1-2 weeks faster in my
backyard as opposed to my front in the deep shade of my house. Basically the
micro climate of my backyard is quite different than my front yard especially
during the transition months of Fall/Spring.
ANY movement of a sensor, even if it is only measured in feet can have an impact
on the data’s homogeneity. You don’t need miles, or hundreds of miles. How
can Jones et al present this stuff with a straight face? Statistical manipulation
of meteorlogical station data to represent a GMT seems rather perposterous to
me, especially if we are measuring in 1/10th’s of a degree C.
Steve,
Yes, Russian statistics are a form of weapon, but the apparent contradiction between a growing economy and a ‘declining population’ can be explained.
For the economy, the Russians were starting out at rock bottom. Socialism. Then they switched to a system similar to England’s in the 1720s. Gradually, they moved up to the 1820s. Some time ago they went to low taxes and flat taxes. When the writer Kir Bulychev visted the US in 2001 he described his new tax regime.
At the same time he mentioned that book sales of his popular “Alice” series had hit rock bottom. These are children’s stories, extremely popular, made into TV shows and movies and cartoons (Bulychev was the Russian equivalent of Steven King.) one of which got dubbed into English for Baryshnikov’s “Tales of my Childhood series” _Alice and the Mystery of the Third Planet_. The natural market for his fiction was not being produced.
For three generations Russians have been on an inverted population pyramid. One child, one grandchild. When I was in grad school in the 80s I did a paper on Russian population statistics using all the available biographical data I could find. Most Russians had only one child. Some, various politicians (Krushcehv, Stalin, etc) had more, some — the religious believers who were excluded from power, had large families. For them it was r selection. But otherwise the average Russian woman had something like 0.84 children. When the grandparents die, the population will drop.
One other problem that the Russian population faces today is that abortion has been the method of populaton control of choice for two generations and that has deliterious effects on later fertility (like, for example, sterility.)Many Russian American writers comment on this.
Alright then, the temperature data is every bit as good as the hurricane data, which is to say “not very”. Which means the temperature science is eveery bit as good as the hurricane science, which is to say “not very”. How concerned am I about painstaking conclusions drawn from nonpainstaking obs? Not Very.
[snip- I understand your sentiments, but a little too heated]
I’ve read that for a period, due to a large number of factors, life expectancy in Russia was actually falling.
Bruce,
You really shouldn’t supress your true feelings that way. It’s bad for the blood pressure. ;*)
I always enjoy reading your site to get the other side of the story on Global Warming. This is a bit of a tangent and people on here maybe are already aware of this but since the subject is Russia I thought I would draw people’s attention to this paper:-
http://sunsite.wits.ac.za/paleo/parcs/reindeerantlers.html
To me the main question this raises is that if the climate was significantly warmer 1500 to 6400 years ago enabling reindeer to live on an archipelago just 900 km from the North Pole, presumably a lot of the apocalyptic scenarios currently being peddled by groups like Greenpeace related to melting permafrost in Siberia should also have been happening at that point?
RE: #47 – Indeed. In fact, I would attribute the long decline of Russia until fairly recently to a general regime of cold / cooling. Warming would actually greatly increase Russia’s comprehensive strength. I actually sort of hope we have neither cooling nor warming. Cooling is bad for the mid latitudes in general. Warming would cause geopolitical problems of an entirely different sort.
Climate warning as Siberia melts
11 August 2005
NewScientist.com
“THE world’s largest frozen peat bog is melting. An area stretching for a million square kilometres across the permafrost of western Siberia is turning into a mass of shallow lakes as the ground melts, according to Russian researchers just back from the region.”
Now does anyone have any idea what peat is doing underneath permafrost? Did it get moved North by a tectonic plate? NO. Did it get moved by the Czar or Stalin? NO.
Did it grow there when the region was warmer? Could be.
Anyone know what the radiocarbon dating of the peat says about its age? Does the peat in the permafrost indicate that it was last unfrozen during the (non-existant) medieval warm period?
Mammoths lived above 70 degrees North, above the Artic circle, in Siberia as little as 3700 years ago, 1700 BC.
They ate a lot of plants, ~300 pounds of vegetation a day, and that could not be supported by the present day vegitation. What do the stomach contents of (earlier) Siberian mammoths show?
“The stomach contents of preserved mammoths indicate that they fed on such grasses, as well as mosses, sedges, herbaceous pollens and spores, and fragments of willow and bilberry. Some rare poppies and buttercups have also been found in addition to small amounts of arboreal material such as larch needles, willows, and tree bark. Such variety indicates the mammoths lived in a variety of climates in Siberia. These ranged from dry and steppe-like to slightly wet to swampy to arctic/alpine.”
Of course this happened much more recently:-
GEOPHYSICAL RESEARCH LETTERS, VOL. 31, L06202, doi:10.1029/2003GL019178, 2004
Large-scale treeline changes recorded in Siberia
Jan Esper & Fritz H. Schweingrube
Abstract
Analysis of a multi-species network of western Siberian ecotone sites revealed pulses of tree invasion into genuine treeless tundra environments in the 1940s and 1950s and after the early 1970s. In addition, increases in radial stem growth synchronous to the late 20th century treeline change are observed. Both treeline changes and growth increases correspond with decadal-scale periods of temperature that are warmer than in any other period since observations started, suggesting – even if indirect – the sensitivity of large-scale treeline changes to this climatic forcing. The mid 20th century recruitment period reported here for the western Siberian network is compared with local findings from Europe and North America suggesting a circumpolar trend perhaps related to climate warming patterns. For western Siberia, the presence of relict stumps, nevertheless, indicates that this present colonization is reoccupying sites that had tree cover earlier in the last millennium.
There is one more important flawed conceit in the Jones work that appears to have been accepted by all.
Jones uses rural status as a surrogate for undisturbed status. Yet we know that vegetation change and irrigation has an impact on albedo and temperature that is much greater than the 0.5 degree change in mean that is claimed to have taken place due to AGW.
This vegetation/temperature flux is most pronounced in areas served by towns in the 2,000-10,000 population range and the temp records are entirely consistent with an initial cooling due to forest clearing followed by a gradual warming due to regrowth and irrigation farming over the rest of the century.
This is consistent with known historical activity in the USSR and Australia and has some correlation with deforestation in China during the inter war, warlords period and subsequent regrowth in the Maoist period.
The notion that climate records may have been maintained during the rape of Nanking etc is breathtakingly naieve.
re: #48 [snip- I don’t want to discuss international geopolitics here – there are other places where you can do so]
re:51
Is that your censoring comment Steve M?
1. My comment was not geopolitical, it was merely a brief statement about Russian not being in “long decline”
2. My comment is directly concerned with the topic
3. Your introduction is riddled with political statements about the situation inside Russia
4. My comment was addressed to Steve Sadlov, who also seems allowed to make political comments
5. My comment was not intended to initiate a geopolitical discussion, simply to correct a false assumption
5. Until now this forum has appeared tolerant of differing opinions, hopefully that has not changed
6. Unchallenged assumptions are invalidated.
RE: #49 – I personally question the whole notion of “Siberia thawing.” The actual weather conditions that have been in place there in recent years, especially the last two, simply do not support thawing of any significantly greater extent than what is “normal” (I know, a loaded term) during summer and early fall. I have yet to see any sort of wideapread (e.g. multiple grid cell, wide areas of millions of km sq, etc) metrics indicating overall “thawing” of Siberian permafrost. All I’ve seen have been news articles claiming it (with no supporting data) and the occasional photo of some excavation or road cut where, of course, the now exposed permafrost would indeed be expected to melt back a bit. But nothing scientific. Oh, and there are the many “expected to melt” statements, oh so typical of alarmist hype.
RE: #50 – also, rural electrification, mostly since the end of WW2, and the introduction of pavement onto graded dirt or gravel roads and other graded areas.
I have just posted another map, Map F at;
http://www.warwickhughes.com/papers/wussr38.htm
which has what I think are the Jones et al 1990, 38 Western USSR Rural stations, superimposed on a NASA Earthlights image.
Suggests that ~60% are from locations with pin-point illumination, ie. small populated centres of some type. The xls spreadsheet is updated too.
We now need these station T data. Any ideas ?
Warwick, I’m having trouble locating up-to-date Russian information. What resources have you located so far?
#1 Michael Jankowski. I must say that I for one enjoy the literary and other references SteveM is including more and more. The technical stuff is vital, but v. dry. Amusing interludes are a definately a bonus.
I would go further and say that gentle mocking of the Hockey Team and all its works is the minimum that they can expect, and deserve.
If it were up to me, my approach would be far harsher.
[snip]
Re #57 [snip]
Steve re # 56, I have no Russian data bar what is in, Jones 1994, GHCN, GISS, those early USSR data in CDIAC.
I am hoping some reader can point us to a Russian source because most of the 38 stations are lower order sites than those assembled in the major global datasets.
RE: #55 – Station number 21 appears to be right at the edge of Sverdlovsk or one of the other industrial or military cities along the east side of the Urals. Definitely not rural!
Steve,
I’m not sure if I have picked correctly countries that were
once part of Russia, or the USSR, but for the following
countries, GHCN has recent, i.e. post 1999, data for the
numbers of locations indicated on the right:
211 KAZAKHSTAN 8
222 RUSSIAN FEDERATION (ASIAN SECTOR) 67
229 TURKMENISTAN 2
231 UZBEKISTAN 3
605 BELARUS 1
608 BULGARIA 2
609 CROATIA 2
638 RUSSIAN FEDERATION (EUROPEAN SECTOR) 15
650 UKRAINE 5
If it would be of use, I can post, or email, the list of
station numbers.
An interesting point about the melted permafrost is that this large peat bog is still covered in water for most of the 8 week summer before it freezes again. And we know that peat bogs remain a very stable storage of carbon, especially when under water. This is the case even in tropical locations. It would seem that the claimed massive release of CO2 from this source is, again, of dubious factual basis.
Re my #55 and 59 above.
I have been sent this URL that looks to let you access Russian T data.
If you understand the language.
http://meteo.infospace.ru/win/wcarch/html/r_sel_admin.sht?country=176
clicking on the little arrows seem to take you to station lists and poss of downloading. Is it possible someone with Russian language expertise could check out what could be obtained here.
Or if there is an org behind this where someone speakum English ?
try babelfish russian to english:
http://babelfish.altavista.com/
What you get is some station data from 2000 in zipped form. I tried and this is it:
date,time,db_id,C,Ch,Cl,Cm,dd,E,ff,G,h,N,P,P0,R24,Rd,RH,Rn,SD,SS,T,Td,Tg,Tgn,Tln,Tn,Tw,Tx,VV,ww
#
2000-03-09,00:00,2,,,,,191,,3,,3000,9,987.98,1003.7,,,79,,53,,-2.25,-5.02,,,,,,,22.8,
2000-03-09,06:00,2,,,,,167,,4,,3000,9,985.08,1000.7,,,73,,,,-1.32,-4.99,,,,,,,30.1,
I don know whatⳳ that all about, but I can read Russian.
I’m sure glad that I’ve never given Steve M. reason to [snip]