Since I’ve been able to closely replicate one HadCRU3 gridcell from GHCN v2 data, it’s interesting to compare other HadCRU3 gridcells to GHCN versions. I’ve looked through a number of gridcells and each one has its own issues. Today, I’ll do a comparison of Malye Karmakuly, Novaya Zemlya, which we’ve discussed before, and the corresponding HadCRU3 gridcell. I’ll review some of the relevant data archives that I’ve located so far.
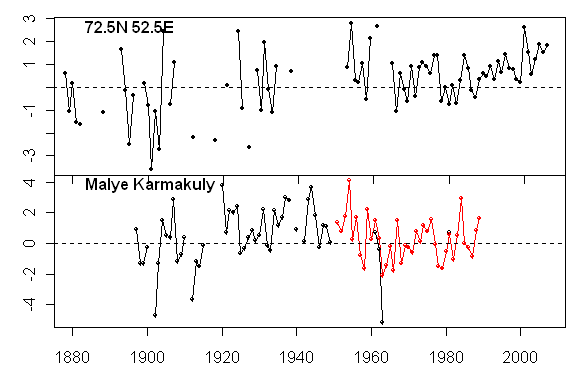
First, here is a simple comparison of the HAdCRU3 record for 72N, 52E against Malye Karmakuly. Where the records overlap, they are related, but for some reason the HadCRU information in the 1930s and 1940s is spottier than the GHCNv2 versions (I’ve required a minimum of 6 monthly values to create an annual average in these graphics.) In addition, the HadCRU3 version continues on to 2006, while the GHCNv2 version ends in 1989. So in this gridcell as well, the assertion by the CRU Freedom of Information officer, David Palmer, that the CRU version is available at GHCN appears to be false. The information at GHCN does not visually give an impression of a warming trend or “polar amplification”.

Figure 1. Top- HadCRU3 gridcell; bottom – GHCN v2 Malye Karmakuly versions
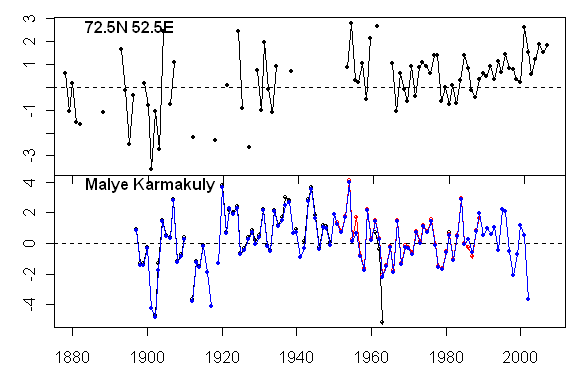
Obviously Jones is not using consistently the GHCNv2 version as archived. I’ve spent a fair bit of time scrounging through possible data locations and comparing different versions. Another Malye Karmakuly version is archived in connection with an archive of 59 Arctic sites for Overland et al (J Clim 2003) with the Malye KArmakuly data up to 2002 here.
This version is shown below, showing a rather pronounced downspike in 2002. What accounts for the difference? This is not discussed in HadCRU3 documentation.

Top- HadCRU3 version; bottom – overlay of OVerland et al 2003 version (to 2002) on GHCN v2 version (to 1989).
There is information from Russia on 233 sites here which is relevant for other locations, but Malye Karmakuly is not here.
There is a very large GHCN archive of daily max-min information here in which sites are coded by their WMO numbers. Malye Karmakuly (WMO- 20744) daily information is here http://www1.ncdc.noaa.gov/pub/data/ghcn/daily/gsn/22200020744.dly . This information for Malye Karmakuly goes from 1995 to Feb. 2007.
If you inspect the daily records for the past 10 years or so, you see many missing values. Were measurements more consistent during Stalinist times? Hard to say. The sporadic measurements don’t make these records look like magic bullets for the supposed lack of homogeneity in American and European records. I’m not saying that they are not usable for some purposes; however, the claimed quality control of Jones et al 1990 seems imaginary. Anyway from the daily information, I calculated monthly tmax and tmin averages (requiring a minimum of 14 measurements to take an average) and then applied the normals calculated from GHCN data to yield anomalies and thus the chart below.
There are some obvious differences between this information and the HadCRU3 series with HadCRU3 showing a stronger recent increase than I obtained from a plausible calculation from original data. I wonder what accounts for the difference. To tie down the differences, you really need to go through their code step-by-step with data as they actually used it. For now, all I can say is that one can derive a somewhat different looking time series using plausible methods on original data.
A final observation – again, there is no obvious “polar amplification” or even warming in this data since the 1930s. Yet Russia is a major center of recent measured warming. I’ll see if I can determine which gridcells are driving results in this area.

Top – HadCRU; bottom: black – GHCNv2; blue – Overland to 2002; red – GSN daily


15 Comments
Steve,
How could one justify anything less than eleven months?
Steve, it looks like you’re getting close to reproducing, or closely approximating, the grid cell set that Jones used to derive his 20th century global temperature measure. Are you thinking of doing a critical audit of the cappo di tutti cappi of all AGW icons?
#2: Pat Frank “cappo di tutti cappi”?
If this is an italian expression, do you mean “the boss of all the bosses”?
In event I’m right…”il capo di tutti i capi”
#3 — You’re right, Paolo. 🙂 I’m still interested in Steve’s answer.
Re #2 & #3
Are you guys so sure that Dr P D Jones is still the “il capo di tutti i capi” of the climate world ?
Note that he is the number 5 and tail end listed author in the mainly Hadley Centre authored paper that birthed HadCRUT3.
My take is that a few years ago, the ruling group in the Hadley Centre found so much wrong with Jones & Moberg 2003 that they engineered a takeover, to the state we now have, where they check the IPCC global fever.
Re #5: More?
The daily GHCN files can also be accesed via FTP for those so inclined.
A sample of a summary (last updated Feb 22, 2007) of GHCN Daily data files
available at ftp://ftp.ncdc.noaa.gov/pub/data/ghcn/daily/
as of February 12, 2007 is at http://www.john-daly.com/ghcndsum.smp
The one megabyte zipped summary of which that is a sample is at
http://www.john-daly.com/ghcndsum.zip
The summary uses the (32,815) stations list at
ftp://ftp.ncdc.noaa.gov/pub/data/ghcn/daily/ghcnd-stations.txt
and follows the line for each station with counts of the various kinds of
that station’s data, and percentage estimates of missing observations,
and missing months that are available (as of Feb 12).
Each summary line consists of:
the starting year
the ending year
numbers of years
number of months of TMAX data (or the word None)
number of months of TMIN data (or the word None)
number of months of PRCP data (or the word None)
approximate percent of observations missing from TMAX data
approximate percent of observations missing from TMIN data
approximate percent of observations missing from PRCP data
approximate percent of missing months of TMAX data
approximate percent of missing months of TMIN data
approximate percent of missing months of PRCP data
#7. I’m going to post up an R function to retrieve this and other data, including certain zip files, where Nicholas has sent me a very pretty method.
BTW, the Karsakpaj file, f35663v4.zip, at
http://meteo.ru/english/data_temperat_precipitation/
included several observations that were missing from the GHCN daily file
for Karsakpay.
Steve: Jerry, Ialready showed these values in the post on Karsakpaj. http://www.climateaudit.org/?p=1203
My Jan 31 post “Huge variations now between the 3 main global T datasets”
takes you to;
http://www.warwickhughes.com/sst/comp2005.htm
where differences between major global databases are pointed out.
The new HadCRUT3 data is explained at;
http://hadobs.metoffice.com/hadcrut3/
P. Brohan, J.J. Kennedy, I. Harris, S.F.B. Tett and P.D. Jones, Uncertainty estimates in regional and global observed temperature changes: a new dataset from 1850. J. Geophys. Res, 111, D12106, doi:10.1029/2005JD006548.
You can download a pdf.
And note that Jones gridded T maps here stop at 2005.
http://www.cru.uea.ac.uk/cru/climon/data/tgrid/
Is this enough to glimpse the truth ?
Warwick, why don’t you do a closer version on the Russia-Siberia data for the various studies.
Re Steve’s comment appended to #9,
Yes, that’s where I learned of meteo.ru. My comment 9 was
to draw attention to an apparent limitation of the GHCN daily
collection.
Re #11 Just right now Steve I am still trying to track down station data for the Jones et al 1990 38 station Western USSR rural series.
I am also hoping to do a similar operation to;
http://www.warwickhughes.com/papers/wussr38.htm
to identify exact stations in their Eastern China rural series, 42 urban/rural pairs in that case.
I have been mumbling for months now about paying for some data processing help to get into the gridded datasets and pull out what I want. To date I have not taken the step of looking for a suitable student with the right smarts, as they say. But they are returning from vacations about now, so I should get on to that.
Reality is that most of my time is taken up with resource stocks and I am scratching to get a few hours here and there for climate work.
The points I have made in my pages;
http://www.warwickhughes.com/climate/ussr1.htm
and for far north Siberia;
http://www.warwickhughes.com/climate/tamyr.htm
are still valid. Maybe I should be flattered that Hadley have pulled away from exactly the extrapolated north Siberian grid cell trends that I attacked.
The sceptic Opus waiting for an author is, “How we were lied to for 20 years about GW”.
This would have to include some key chapters on high north latitudes.
That Russian server in Cyrillic, “Pagoda Rosssiji” has data for much more stations starting from cca 1997-2000 for download in a zipped file. I posted here a start of such file and apparently there are 4 measurements per day.
Maybe there can be more stations in a gridcell than those in the “List of 223” which can be compared with a station from the list at least for the tendency in the last 7-10 yrs?
I made an excel file of all station #’s with coordinates (can’t write the names in Cyrillic), so if someone is interested, I can send it and download some data for a # on request.
Now I found their English archive page working where data from Russia and a lot of other countries from 1997-2000 can be downloaded:
http://meteo.infospace.ru/wcarch/html/index.sht
here’s the link on 1341 Russian stations
http://meteo.infospace.ru/wcarch/html/e_sel_stn_all.sht?country=176&mode=stn