Rob Wilson has referred us to Wilson et al 2007. In addition to being an example of site selection, Wilson et al 2007 uses a type of principal components on a tree ring network – something that should be of interest to many CA readers – and an interesting illustration of non-Mannian statistical methods within the tree ring community.
Update (2016): In comments to this post, there was considerable criticism of the failure of the authors to archive data at the time of publication, with one of the authors taking offence. Unfortunately, as critics had feared, the missing measurement data was not archived until five years later (2012), with one site-species dataset still not archived.
The Sites
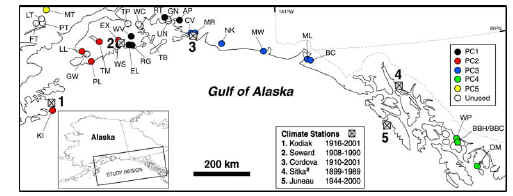
The sites in Wilson et al 2007 are located along the Gulf of Alaska, well to the south of the Brooks Range at about 68N where Wilmking collected samples. On the left is a location map from the article; on the right is a location map within Alaska.
 |
 |
Right panel – red shows sites with archived data.
The selection protocol is described as follows:
For this study, we selected from the region 31 ring-width data-sets, that came up to at least 1986, from the international tree-ring data-bank (http://www.ncdc.noaa.gov/paleo/treering.html) as well as newly sampled data-sets for further investigation (Fig. 1; Table 1).
Wilson et al do not provide ITRDB identification numbers – something that should be part of any SI – but do provide names and coordinates for all 31 sites considered. From this information, I was able to locate 16 series within the ITRDB, none more recent than 1995, and was unable to locate 15 other series, which are presumably unarchived. In the map at right above, the located sites are marked in red. While the statement of selection criterion suggests that the data was selected from ITRDB data, my inspection of the data provenance indicates that unless co-author Wiles was involved in the collection, the site was not included even if it was in ITRDB. So this is really a publication of Wiles’ collection rather than a statistical sampling from ITRDB – which is fair enough, Wiles did a lot of work collecting the data. (One of the problems for data collectors in archiving – perhaps the major problem – is getting scooped by multiproxy scavengers – that Mann or Crowley or that type would steal the limelight.)
Here’s something a little ironic in the selection of sites, that I can’t help but tease Rob about. Rob objected elsewhere at CA to using data collected by Wilmking, who he described as “dendroecologist” who was interested in positive and negative responders.
This whole blog [thread] started with me criticising Steve M about averaging 14 sites without expressing where the sites came from and why they were originally sampled. Your 30 chronology mean is no different I am afraid. Not all the data are from the Jacoby group. Many of these series are from Wilmking. Again, I do not know the details of the individual sites, but Wilmking is a dendroecologist and has been study the divergence’ issue in recent years with respect to positive and negative responder trees.
I didn’t think that his criticism was well-founded, but here’s the irony: four of the sites in Rob’s list – Middle Telaquama, Fish Trap, Lower Twin, Portage Lake – are reported in Driscoll et al 2005,, also see ppt here, coauthored by Wilmking, which was previously discussed in CA in the post Positive and Negative Responders and are type examples for Wilmking’s positive and negative responders. (Also see previous discussion of Wilmking et al 2004 here .) Since Rob did not cite Driscoll et al 2005, he was presumably unaware of this connection.
Multivariate Methodology
First, Rob reduced the population from 31 sites to 22 sites, eliminating sites with a low correlation to temperature. The population was originally 31 sites, consisting of 18 TSME (mountain hemlock), 8 PCSI (Sitka spruce), 4 PCGL (white spruce) and 1 (CHNO) yellow cedar. 3 of the 4 white spruce sites were eliminated in this stage. The only remaining white spruce site, Middle Telaquama, one of the Driscoll sites, has a reported correlation of -0.01 with the other series. I consider this elimination step as part of the multivariate methodology since it gives a coefficient of 0 to these 9 sites in the reconstruction.
After reducing the population to 22 sites, Rob carried out a type of principal components analysis on the remaining 22 site chronologies described as follows:
A rotated (varimax) PC analysis (Richman 1986) using the remaining 22 chronologies identified five principal components (PCs) with an eigenvalue greater than unity.
I’ve collated the network of 16 sites for which data is available here and have experimented a little with it. Obviously without all 31 sites being archived, it is impossible to replicate any of the actual reported results.
Given all the publicity about correlation versus covariance PCs – an issue which I’ve always regarded as a distraction as the two methods merely provide alternative weighting of site chronologies, neither of which is “right” in any meaningful way as far as I can tell – climateaudit readers will probably wonder which Rob chose. It’s hard to say from the description. The “rotated (varimax) PC analysis” appears to be the same procedure as factor analysis . My guess is that he used something like the factanal function in R with the default option of rotation=”varimax” , which also has covariance matrix default but a correlation matrix option. It’s hard to say and, in the absence of a complete data archive, it is impossible to replicate calculations to find out. Yes, it’s possible to email Rob and ask, but a good SI would have all this information and ideally the source code for the calculations.
Some readers will probably wonder what the difference is between the “rotated (varimax) PCs” and correlation/covariance PCs. The difference, as I understand it presently, is as follows: if you do a PC analysis, you often end up with weightings that are hard to interpret (for tree ring networks, dare I say, this is often because the PCs probably don’t mean anything very much at all.) If (say) 5 PCs are selected (truncation) – 5 is the number chosen in Wilson et al without saying why, factor analysis (varimax rotation) attempts to find an orthogonal rotation within the subspace that loads the weights as much as possible on groups. In the Wilson et al case, if you re-inspect the left panel in the first figure above, you’ll see 5 different colors – these represent the 5 groupings from the varimax rotation. In this case, “rotated (varimax) PCs” boil down to being a high-falutin way of simply making 5 “regional” averages. In the case of the Mannian network, while I haven’t tried a varimax rotation, it seems highly likely to me that it would find the bristlecones as a distinct pattern and load them as a distinct factor.
Rob then regressed temperature against the first 5 rotated PC series. (He considers both current and lag-one temperatures as regressands which I won’t discuss in this quick review).. January-September average temperature was selected as a target (presumably others were examined.) This resulted in the following formula:

Let’s leave the lag-one issue to the side for a moment and reflect on what’s being done here. In effect, Rob is doing a multiple inverse regression on 5 weighted averages of the proxies (with the weightings chosen to be orthogonal.) If you do the linear algebra in a different order (and the operations are obviously associative) and can be done in a different order, you could reduce Rob’s expression shown above to”

where 

The obvious question in any of these sorts of analyses is whether there is any justification for not just using an average with at most some regional weighting. This issue was raised by the NAS Panel (and discussed by both Huybers and ourselves.) However, Wilson et al don’t reflect on the matter. The trouble, of course, is that, in the absence of any theoretical reasons why one site chronology within the group should be better than another site chronology, the fitting exercises carried out here seem to me to be simply exercises in overfitting and, if an r2 or other statistic arises from this sort of method, I’m inclined to be mistrustful of it if it can’t be substantiated in a simple average.
In passing, the underlying statistical literature on factor analysis (Ripley has his usual excellent discussion in his text), the inspiration comes from psychological testing, where testers try to associate skills into patterns “linguistic”, “mathematical”. As practiced by tree ringers, it is a type of inverse factor analysis. I’m having trouble thinking that there’s any particular theoretical justification for the procedure or any reason to adopt it, but, at the end of the day, it appears to simply generate regional averages and may not do any immediate harm. The regression step seems more problematic to me – I really have trouble with the idea of multiple inverse regression of temperature against 5 tree ring indexes. I realize that this just assigns weights, but I find it hard to think of any reason not to prefer averaging. Weighting by calculating regression coefficients seems ripe for overfitting.
The Reconstruction
In any event, here is the Wilson et al temperature reconstruction. Once again, I have trouble discerning a HS shape in this reconstruction. I’m also a little puzzled as to why Rob and Mike Pisaric were so quick to conclude that an average of white spruce sites was “flawed!” given what appear to be some commonality to this plot.

Gulf of Alaska Temperature Reconstruction from Wilson et al 2007
As an exercise, I calculated a simple average of the 16 chronologies where data is available. Yeah, yeah, I’m sure that it is somehow “wrong” to simply use data that is available and I’m sure that this analysis is “flawed!” in Pisaric’s phrase, maybe even “flawed!!!!”, but here it is anyway. I’ve only shown values since 1500 matching what Rob showed, but the values as plotted in the early portion are very elevated. The latest value in this average is 1995. The Wilson results shown above are not archived but, guessing, I’d say that the 1995 uptick in the average corresponds to the last uptick in the series (near where the solid smooth ends) and that values have declined since 1995. In both cases, one has rather elevated values in the 1920s, 1930s and early 1940s. The last strong peak (value-1469) is in 1944. There is a marked low in 1974. The simple average of these chronologies ends on a somewhat lower noted than the [arguably overfitted] version in Wilson et al 2007, but the impression of the two versions is obviously similar.
Average of 16 Wilson et al chronologies archived at WDCP.
What does it all mean? Well, there are some interesting points of commonality between the multivariate methodology of Wilson et al 2007 and MBH98. Both carry out principal components analyses of tree ring networks – MBH using Mannian principal components; Wilson et al 2007 using rotated varimax PCs. In each case, the PC analysis is followed by a regression analysis against temperature (or temperature-equivalent PCs), in Rob’s case with an OLS regression; in Mann’s case with a PLS regression (though obviously not described as such in MBH or anywhere other than CA). Mann also throws in a pile of other “proxies” in addition to the tree ring PCs. Rob also uses a stepwise procedure, as does MBH. It’s interesting to make these comparisons to see exactly what lies within tree ring traditions and what were Mannian innovations praised by Bradley for enhancing the detection of a “faint signal”.
But always, always – keep firmly in mind that these operations are all linear and at the end of the day, weights are assigned to the individual proxies and ask yourself whether there is any valid reason to weight one proxy more than another.


104 Comments
Looking at the paper, I see that they used an average of the temperatures from the numbered stations in the figure as the dependent variable . Why not use station 1 for red site near it, station 2 for the rest of the red sites and the western-most black sites, station 3 for the remaining black and western-most blue sites, an average of 3, 4 and 5 for the remaining blue sites and an average of 4 and 5 for the green sites? You could then project the temperatures for each group back in time using the inverse of the fitted regression functions and then average those fitted temperatures to get the historical series. Actually, I would fit each tree ring series to the local temperature separately and then project each of those relationships back in time before averaging the back-casted temperatures. Why fit a weighted average of the tree ring data to an unweighted average of the temperature series and then project the resulting relationship back in time? They justify their procedure in the paper by claiming that averaging the temperature data first “optimize[s] the common signal”. What does that mean? How do we know there is a “common signal” , and even if there is, shouldn’t it show up in the reconstructed average at the end of the procedure?
Steve, here’s the reference to the initial use of Q-mode factor analysis in the analysis of planktonic microfossil assemblages. After some success with formaminifera, factor analysis was used with radiolaria, diatoms, and pollen. Tree rings no doubt followed not far behind. You may find some answers in it or the subsequent literature to your questions about the justification of particular choices and assumptions.
Imbrie, J., Kipp, N., A new micropaleontological method for quantitative paleoclimatology: application to a late Pleistocene Caribbean core, The Late Cenozoic Glacial Ages, editor Turekian, K., Yale University Press, New Haven, 1971, 77-181.
LOL. We all know the reason for weighting certain proxies! What really bugs me is the selection of proxies, based on their relationship to temperature. I could possibly see the case for this if they were related to LOCAL temperature, but not if only related to “global temperature” (whatever that is!). How do these guys justify this?
I don’t think using Principal Components is justified. It implies that temperature changes are geographically stationary over time. The existence of the PDO would contradict this assumption. Also many years ago Jones showed that the present warming and the warming in the 1920-40 time period had very different geographical patterns.
#3. but notice that, in this case, the selection and rotated varimax doesn’t change the shape of the reconstruction very much although the closing portion is a bit higher in Rob’s reconstruction than in a simple average of the 16 archived versions (not all of which he used.) Rob has mentioned elsewhere that he can improve the r2 by doing these sorts of operations. I think that he’d be better off with the simplest possible method and letting the chips fall where they may in respect to the r2.
Maximising r2 has always been known to be a dangerous procedure. But I like Peter Hartley’s idea: use each site to reconstruct local temperature and then average the re-constructed temperature. It seems to correspond with how global average temperature is calculated. I imagine it is effectively equivalent to just not re-weighting, but I can follow the logic clearly.
It’s such a crock to assign temperature numbers to tree ring widths, and it’s a further crock to assign physical meaning to a PC that merely reflects numerical orthogonality. Rob Wilson seems to be among the best of the bunch, and even he closes his eyes to the scientific falsehood that now underlies dendroclimatology. All these considerations about whether this TR series is more appropriate than that, or whether normalizing by covariance is better than by correlation, is no more than theological disputation.
Yes – but it is also ripe for fitting in a way that simple averages aren’t.
Certainly the abuse of OLS to create faux significance can not be underestimated – but it is still a valid tool that can give beneficial results — in the right hands. I’ll certainly grant that the Hockey Team don’t seem to fully understand what they are doing and commit classic errors of overfitting (compounded by the ease of doing so with strongly trending series).
A simple average is very appealing, but the equality of the weights may be more apparent than real. If the sites in the network are not evenly spaced, areas with more sites receive greater a greater weight.
#9. Richard, I agree with this point although I may not have explicitly said so here. I’ve certainly objected to the Team using not just one, but two or even 3 or 4 bristlecone/foxtail series in small 12-18 subsets – where the “multivariate method” is manual picking.
Well, up ’til now I’ve had a very high estimate of Rob Wilson, based on his obvious knowledge, genteel manner, and willingness to answer questions. This paper is forcing me to rethink that.
I say that, not because of any one particular thing that he has done in the study, but because of his lack of recognition that the field has moved forwards, that the old methods of slipshod data handling and method description are no longer acceptable.
My issues with the paper are:
1. Lack of proper identification of the individual series. This is a very, very, very bad start to any scientific study, and in the dendroclimatology field in 2007, it is inexcusable.
2. Apparent lack (can’t be sure because of #1) of archiving of the individual series.
3. Lack of contemplation of the possibility of what I call “Option Z”. The “Z” stands for “Zero”, and I use it to mean that one of the explanations for any result of mine is that either the data is random and contains zero information, or my method contains zero applicability … for example, I’m reading along, and the paper says:
“Oh, good”, thinks I, “we’ve just discussed this very problem, that’s what happens when you cherry pick data” … but they go on to say:
Well, yes, it might be from any of those … or it might be from Option Z, which gets no mention.
4. Mystery methods. The paper says “Comparative analysis identified no significant difference between the monthly time series of both maximum and minimum temperatures and so these data were averaged together and further analysis utilized mean temperatures only.” I’m sorry, but that makes no sense, because it is so content free. Are they comparing minimum and maximum temperatures to each other, or to the tree rings, or the PDO data, or what? What kind of analysis was performed? What level of significance?
5. Ad hoc decisions on data exclusion and method application. In addition to the initial winnowing of the data based on correlation with temperature (with no discussion of the known problems with that procedure), they say:
Data doesn’t fit your theory, even though it correlates strongly with the very Gulf of Alaska temperatures you’re trying to reconstruct? Hey, no problem, just exclude it …
Here’s another example. They say “For 12 of the chronologies (DM, WP, RG, EX, LL, MR, NK, TM, MW, AP, MT and KI), the Cook and Peters (1997) power transform was used to reduce end effect inflation of resultant indices in some select series. It should be noted, however, that the use or none use of the power transform makes little difference to the final reconstruction.” I get real nervous when someone picks half the series with no selection criteria listed, subjects them to a transform, and then says “don’t worry, it makes little difference to the final reconstruction” … hey, if it makes little difference, don’t do it. And if you’re going to do it, either do it to all series, or explain why.
A third example: they say “To remove non-climatic biological age-related trends (Fritts 1976), the individual raw ring-width series were detrended using negative exponential functions or regression lines of negative/zero slope (Cook and Kairiukstis 1990).” Fair enough, but why use two different methods, and how did you choose which one to use?
6) Absolutely no mention of confounding variables, nor any attempt to remove them.
7) Rob complained before that Steve’s post on white spruce made no attempt to select sites that would reflect temperature. The two important factors he mentioned were north facing slope, and altitudinal treeline. But in this study, he says “Most of the sites were sampled at or close to their respective local treeline.” There’s a couple of problems with this assertion. One is “most” … most? Half plus 1? Or 98%? And what justified the inclusion of the rest of the sites?
Next, the location of the “local treeline” is rarely mentioned in the meta-data associated with the archived datasets … we’re left with no information on how this claim of “at or close to” was established. And when the altitudinal treeline is at 400 metres above MSL, as for some of the species in this study, what does “close to” mean.
Finally, of the 31 original datasets, he winnows them down to 22 used in the final study … how many of the winners are “close to their respective local treeline”? If the treeline has meaning, the percentage should have increased … did it?
And what ever happened to the question of north facing slopes?
8) Lack of comparison of the reconstruction with actual temperatures. For example, they say “The GOA reconstruction correlates significantly (95% CL) with both the Pacific Decadal Oscillation Index (0.53) and North Pacific Index (‘€”0.42) and therefore likely yields important information on past climate variability in the North Pacific region.” That’s all good, but how well do the five temperature stations in the study (Kodiak, Seward, Cordova, Sitka, and Juneau) correlate with the PDO and the NPI?
9) Scale. They say “Cook et al. (1995) state that using traditional’ individual series detrending methods, as done in this study, the lowest frequency of climate information that can be realistically recovered is 3/n cycles per year (where n = the mean sample length). Therefore, with a mean (sites equally weighted) sample length of 260 years (Table 1), such individual series detrending will result in chronologies that can only represent variability at centennial or higher-frequency time scales.” If so, it seems that the thing to do with your results is filter them with a 100 year bandpass filter, since the smaller scale information is not reliable. But from an initial look at the data, that’s going to to give something not far from a straight line …
Also, while the equally weighted average sample length is 260 years, that’s not meaningful. What is the weighted average sample length?
10) Autocorrelation. There is no mention of the effects of autocorrelation on their quoted correlation and r^2 results … they might have done it, but it makes me sweat when they don’t mention having done so.
Well, at least they didn’t come up with yet another Hockeystick, be thankful for small favors … but on the other hand, there’s no sign of the LIA either. To me, it looks a lot like random red noise, but what do I know? …
More to come when I get more time.
w.
Recall Esper et al 2003:
Mining promoters would love to have this “advantage” as well.
This is a standard phrase in dendro and probably means that the series were detrended with one of the COFECHA options, that first tries to fit a generalized neg exponential (i.e. neg exponential plus constant and, if there is no fit, a constant. It’s a procedure that’s recognizable to dendro folks. The procedure usually defaults to a constant mean if neg exp convergence is not achieved. I’ve not been able to determine when the negative slope option gets invoked.
Given the many variations in individual tree ring histories, there are interesting issues in nonlinear convergence and COFECHA sometimes misses possible neg exponential solutions, although this doesn’t have a big impact on chronologies as the neg exp that is missed in such circumstances is pretty flat. Sometimes convergence dependence on your starting point and on the number of iterations – that’s why convergence is sometimes missed. This would be an interesting paper for someone to write. There’s also a strange error in the COFECHA version that I examined in which the coefficients of the first core are calculated incorrectly, but not subsequent cores. I noticed this a couple of years ago but never did anything with it.
This http://data.climateaudit.org/data/proxy/wilson2007.txt referred to in the text doesn’t seem to exist…
Re: #14
Loaded here. First couple of lines are:
Re: #15
Strange. It loads now.
NOAA or the IPCC probably needed to edit some numbers before too many people got their hands on the file 😀
Very Quick – I can hardly ignore this post
For DWJ2006, I compiled essentially a mean series of these data. The resultant time-series is essentially the same although with a slightly weaker r2 with GOA temperatures. In this study, I undertook nested PCA. Meaning, that PC regression was undertaken over multiple time-steps (i.e. as the shorter series left the data-set) to allow the quantification of the reduction in calibrated signal going back in time. This is not possible if all the data are averaged together, although, I will admit that one could do nested averaging at every time-step. I used PCA as it quantified nicely the regional differences in growth. I would mention a couple of papers where I have utilised a nested averaging approach, but you guys are busy enough trashing this paper and I do not want to give you more work.
Note also that the sub-fossil extension that goes back to the 8th century is a simple average of all the available sub-fossil data. No screening is possible with these data (except that they crossdate) and, as shown in the paper, the overlap between the sub-fossil chronology and the ‘living’ reconstruction is quite favourable – especially where replication is high.
Please look at the GOA chronology in DWJ2006 (named CSTA) and the LIA is clearly visible in the RCS version. Remember Wilson et al. (2007) was looking at decadal and multi-decadal variability only.
Greg Wiles is very diligent at archiving his data. I am sure when his student has finished with his thesis, the data will be archived.
Thank you for taking the trouble to read the paper. Please feel free to submit any ‘issues’ that you may have to Climate Dynamics, and I will gladly address them through the peer review process.
Rob
For those who have no background in mainly pattern recognition & machine learning, I have to say, that the majority of climate scientists are not aware how many versions out there in the literatures for dimensional reduction, where principal component analysis (PCA) is one of them. Also , there are different versions of PCA with different capability available out there, that climate scientists barely know exist. So, there is no surprise, when you apply different version of PCA to data analysis, you end up with different conclusions. So, I would recommend climate scientists to step out of their comfort zone and read publications in related disciplines as Journal of Machine Learning or Journal of Pattern Recognition, so that they can adopt appropriate methods for certain data analysis.
I have read Rob Wilson’s paper. A bit challenging for a lay person!
I have two (perhaps silly) questions. First, I was expecting to see at least some discussion of the relationship between tree ring thickness and temperature. On my amateur reading of the paper, it seems that it is assumed in this paper that there is a linear relationship between tree ring thickness and temperature, but maybe I have that wrong. If so, I would like to ask where in the paper that relationship is discussed. I certainly couldn’t see it. Us gardeners observe an inverse quadratic relationship between plant vigour and temperature, and we also note that other factors such as precipitation, timing and nature of the precitation sequence, fertiliser application, soil issues, insect/fungal effects etc also affect plant growth and presumably tree ring thickness.
My second question relates to the fact that an attempt is made to correlate the temperature signals extracted from the tree rings (presumably by assuming a linear relationship between tree ring thickness and temperature) with temperature records. However, I note that at least some of these temperature records are those produced by the infamous Dr Phil Jones, who ‘declines’ to explain his data and methods in sufficient detail for his work to be confirmed by independent workers. I note that Dr Jones work has been questioned in other threads on CA in recent times.
I would appreciate guidance from those more knowledgeable than me on these issues.
Rob, thanks for the post.
It seems to me that you could easily have a) identified the sites properly and b) dealt with the archiving issues by posting the data as supplementary online information with proper references. A number of journals have policies that the data must be archived before the work is published. I know of none that make an exception based on some anonymous student’s needs.
I must confess that I don’t understand why all journals don’t require archiving … and in lieu of that, why authors don’t do it as a matter of course. It would avoid any confusion about exactly what data was used, and would allow swift replication and verification of the work. Surely, with all of the problems of unarchived and “gray” data in the dendrochronogy field, you must have realized that publishing a paper that uses unarchived data would raise serious questions.
Simply stating that the data will be available someday, once some unknown student finishes his thesis seems … well, odd, and I can only say that I certainly hope the dog doesn’t eat his homework. I assume that there is some kind of issue with revealing the data until the student publishes his thesis, although I can’t imagine what that would be. But there’s an easy solution to that problem. If the data is not publicly available … don’t publish until it is. Is that so hard to understand?
If I published a killer paper proving beyond question that there was no global warming at all, based on data that oops, sorry, won’t be available until some student somewhere is done with it sometime, you’d rightly condemn my study because I would have made it impossible to check or replicate my work … but you seem to expect some different set of rules to apply to you. I’m sorry, but the “Trust me, I’m a dendrochronologist” claim lost a lot of its force with the publication of MBH98 and some of its soul sisters …
I strongly suspect that you are not doing anything unprincipled or underhanded. But y’all have refused to clean up your own field by taking a principled public stand against the shabby practices of some of your colleagues, and the inevitable result of your tacitly condoning their actions is that the reputation of the whole field has been damaged. So please don’t act surprised if people are suspicious when you use unarchived, unidentified data, don’t act shocked that we don’t automatically trust that you are acting in good faith … we’ve been bitten very badly by trusting certain dendrochronologists in the past, and none of the rest of you seemed to care in the slightest, so why should we assume you are any different from them?
The journal “Climate Dynamics” says that they require that authors “provide enough information to permit repetition of the experimental work” … and as much as I admire your knowledge, generosity, and general style, you have clearly failed to comply with that requirement. I cannot repeat your work, full stop, and Climate Dynamics should have followed their own policies and refused to print it until you complied with their requirement.
Had you done so, you could have avoided what you call the “trashing” of your work. The angry edge in what I wrote was because of my frustration at once again not being able to answer most of the questions I have about the work, because the data is unavailable. After all of the publicity, after all of the examples of “gray” datasets, after Michael Mann’s tete-atete with the US Congress, after the journals have tightened up there archiving requirements, after the NAS Panel and the Wegman Report, I’m upset that once again, some dendrochronologist has managed to get a paper published without archiving his data. I’m sorry that puts a harsh tone in my comments, but really, can it be possible that you guys still don’t get it? The free ride is over. The day of the gray and unarchived datasets is over. The world is looking over your shoulder. Dendrochronologists need to pull up their socks and act like real scientists, and the sooner you do, the better. Until then, I’m sorry, but you are going to be getting some hard questions, and deservedly so.
w.
I can certainly sympathize with a researcher who puts in a lot of time and effort to gather data, and then has some else grab the credit for analyzing that data. One solution would be to have a new electronic journal for data publication, e.g. JGR—Data. The journal would publish data only, no analysis. It would be citation-indexed.
A researcher who also analyzed data would thus get two publications, one for the data and one for the analysis. All papers, by all researchers, that analyzed the data would naturally cite the publication in JGR—Data.
Comments?
19: Bruce. You are on the right track; these issues have been discussed numerous times at CA, and I have yet to see a dendrochronologist address these issues directly. Many of them seem to be infatuated with “teleconnections” and other magic that I don’t recognize as science.
Rob, I re-read my commentary and, other than criticizing the archiving practices, I don’t think that it is fair to describe anything that I said in this review as “trashing”. As you say, Wiles’ archiving practices are by no means bad in terms of the field and, like you, I expect that he will ultimately archive the data. I’ve obviously been on record on many occasions as advocating the archiving of data contemporary with or before publication and I am entitled to make this observation once again without being accused of “trashing”.
This site has obviously had extensive discussion of PCA as applied to tree ring networks and many readers are interested in the issue. More to the point, I’m interested in the issue. I was interested in how you’d done PCA and reflected a little on the meaning of rotated varimax PCA in the context of tree rings. This was a highly pertinent thing for me to comment on. I don’t believe that anything in my description of your methodology was untrue and your quick response did not suggest otherwise.
I think that my comments showed that, in this case (unlike certain other studies), your PCA methodology did not make much difference to the final appearance of the graph relative to a simple average of available sites, a point which I illustrated with a graphic and a point with which you seem in agreement. You’ve said that your use of this methodology enhanced the r2 of the reconstruction. My view would be that such enhanced r2 is likely to be spurious and is not good statistical methodology – an issue which would do you no harm to reflect on.
I view this site as a type of ongoing seminar. Every seminar topic doesn’t warrant the submission of a Comment to a journal, but it doesn’t mean that the discussion is pointless either. A commentary on your PCA methodology, which is of interest to CA readers, hardly warrants the preparation of a Comment to Climate Dynamics and I would not plan to submit one even if I had no other priorities.
People here, including myself, like you. That doesn’t mean that we’re going to agree with every statistical thing that you do. I think that you’re being a little thin-skinned and overly sensitive here. Relax – you’re among friends. If there’s something that I wrote that, upon reflection, still offends you, I can assure you that there was no intent to offend; so write to me offline with particulars and I’ll remedy the situation.
#21. Douglas, if citations are relevant to academic success, as they seem to be, there needs to be some mechanism either along the lines of what you suggest or some other similar mechanism for recognizing the work of data collectors like Wiles, Jacoby, Buentgen, Wilson etc.
AGU has provisions for data-based papers, but this doesn’t seem to have quite done the trick. Another approach might be to have data citation indexes. In theory, AGU policy requires authors to provide accurate and replicable data citations (i.e. to retrievable data files). This policy is breached in every paleoclimate publication, but is still a good policy. If authors actually made proper data citations, then it would be possible to index the data citations and perhaps that would be a way of organizing recognition and an incentive to archive data. So if someone used Wiles’ data, they would have to have a specific citation to the data bank in the data citation section of their publication, which in turn could be indexed.
Doug, you say:
Sounds like an interesting idea, but I don’t understand how that would be different from the current situation. When the proper procedures are followed currently, researcher X gathers the data and analyzes it. When he publishes, he archives the data. How is someone else going to steal a march on him?
And whoever gathered the data currently gets a reference, because their name is on the archive in the ITRDB or whatever archive site they are using, and it is generally cited in any further papers either directly or indirectly.
So how is your system different? The problem isn’t the lack of some place to publish the data, it is people not publishing the data. How will having an additional place to publish the data solve that? Perhaps I’m not understanding what you’re proposing.
The issue in the current paper seems to be that Dr. Wilson agreed not to publish the data so as not to allow other researchers to interfere with an ongoing PhD thesis … OK, that part’s fine, but then Dr. Wilson went ahead and published his research on the data.
However, this could be extended ad infinitum. Say Dr. Wiles decides that he wants to publish further research on the data, so he tells the graduate student he can publish the PhD thesis, but he can’t publish the data … and then Dr. Wiles’ colleague asks if Dr. Wiles could hold off publishing the data until the colleague finishes his research … and then …
The solution seems bozo simple to me, which usually means that I’m missing something, so if I am, please let me know. The solution seems to be, either publish the analysis and the data, or don’t publish either one. Dr. Wilson claims that we’re “trashing” his analysis, but he’s actually beaten us to the punch … an analysis without the data to back it up is not science, until the data is published it is just unsubstantiated claims, without any scientific value.
w.
#21
This is already being done at the pangea.de data depository. All data archived there are given a doi and can be cited and included on you cv.
Like Bruce (#20) as a layman I found Rob’s article tough but also interesting. Interesting largely because the authors seemed to have made a genuine effort to make everything they did transparent. This helped me enormously. I do find the implicit assertion that trw = f(temp) as opposed to trw = f( temp, precip, x1, x2, …, xn) a bit difficult to understand. (The focus on Jan – Sept temp also strikes me as poorly justified in terms of how a temperature signal is associated with the trw – especially given the apparent link with the correlations for pOct,PNov and pDec, in PC3 in Figure 2.)
I am also intrgiued by the pattern of sites and there linkage to the PCs in figure 1. I work more with factor analysis in the area of job surveys. One of the issues you need to be careful of when using factor analysis with this type of subjective data is whether you are generating a set of structures that reflect underlying dimensions of the phenomena you are looking at as opposed to factors that reflect differences among the people you are collecting data from: This is the difference between factor analysis and cluster analysis. Now I am not knowledgeable enough to explain all the complexities, but if this was my data set I would assume that I have simply found 4 microclimates and a weak outlier rather than a temperature signal.
Another thing I am not sure about are the actual decision rules for including and excluding the sites. The 9 excluded sites are not randomly distributed across GOA, they are clustered around Seward and in the area where there is no proximate weather station. The numbers in Table 1do not seem to justify the exclusion of GW, TP, TB and UN. Nor do the numbers seem to justiofy the inclusion of MT. So I am confused as to how precisely to interpret Table 1.
One final thought. I think there is a fundamental problem with the number of tree ring series and the use of factor analysis as the analytic method. Perhaps somebody with a more current grasp of the underlying statistics can help out here. Certainly the 22 sites here seem to be very small. I would never do a factor analysis with that number of subjects. Moreover, given the principle of replication to ensure relaible factors I wouldtypically split a sample and do a confirmatory analysis to eliminate trading on chance.
Hope this “naive” view helps.
Let me add that I think the cluster analysis issue is equivalent to isolating Bristle Cone TR in Mann et al. I normally see FA as a data exploration technique and a way of confirming a predefined theoretical structure rather than a way to extract a coherent structure. But then I work in a theoretical and scientifically immature field with a lot of dirty, imprecise and error filled data – where R2 > 10% is a victory!!!
Bernie: you’re no layman at statistics!
Re #25, Willis, and #26, richardT.
Scientists are often judged by their citation records. For example, someone might go around bragging that he has 2000 citations. Or that he has a paper that has 300 citations. There are even awards for such (e.g.).
The citations that count are those indexed in the Science Citation Index, or its expanded cousin, the Web of Science. Those citation counts can have a huge effect on scientific careers.
SCI/WoS only index work that is published in selected peer-reviewed publications. They do not index data published in ITRDB or pangaea.de. So publishing data in ITRDB/Pangaea earns the researcher little credit. (Pangaea’s doi makes the data more nicely listable on a c.v., but does not affect citation counts.)
You might say that SCI/WoS should change, but they are extremely unlikely to. They seem very resistant to changing their current methods (e.g. calculation of a journal’s “impact factor”), despite strong, repeated, and obviously-valid criticisms.
The intention with something like JGR—Data is that it would be peer-reviewed (for methodology, quality, etc.) and published by a respected publisher. So SCI/WoS would likely index it.
Of course, there is still the problem of people publishing analyses without publishing any data. That is often journals not enforcing their stated polcies. The suggestion here might help that as well.
I have the impression that we are in the middle of an acumulation of cheap Journal Citation’s by a wide range of climatologists.
Take someone elses data, chosen willy nilly from a vast range, but not current (obviously), systematically work way through applied statistics primer, following the examples by rote, as understanding of the statistical implications is not necessary for Publication. Where able, apply hitherto unknown terminology, chosen to obscure rather than illuminate, use quaint and indecipherable computer programming languages, Fortran or (Monty) Python, or somesuch. When all possibilities have been realised, happen while reading a blog, on a free, open access statistical package called R, and start to work way through obscure functions.
At the end, no-one is any the wiser about anything, few if any will bother to read said paper let alone understand it. But the list of attributable Publications has been lengthened. Mission accomplished. The Publishers have filled the space betwenn the adverts, or the required number of pages for subscription Journal. Oh, and the donkeywork is done by ones PhD student who is now to busy to archive, and one obviously wouldn’t stoop to that sort of thing oneself.
http://qed.econ.queensu.ca/jae/ is the archive for the Journal of Applied Econometrics. All articles have to submit their data and code as used. I’m not proposing something that isn’t already standard practice in another field.
Mark:
Sounds like you have moved from skepticism to cynicism. It may be at some more general level justified especially among those given to “catastrophism”. In the case of Dr. Wilson I just happen to see a genuine effort to move the “knowledge” ball forward. I maybe wrong, of course, but I think it is better to assume that there is a genuine knowledge advancement motive rather than than a pure self-serving motive until there is positive evidence of the latter. I think we do better by trying to engage those dendroclimatologists who seem to be open to the spirit of inquiry engendered by SM on these pages.
Getting back to the Climate Dynamics paper, I note that the paper cites Fritts [1976] for its calculation of confidence intervals, in determining which dendrochronologies to include (p.429a). Problems with Fritts’ method have been known since 1990. I pointed this out on ITRDBFOR (an e-mail list for dendrochronologists, subscribed to by about 600 people) and Hal Fritts agreed [1].
A colleague of Fritts, Joel Guiot, published a fix for this in 1991 [2]. I pointed out a year ago, on ITRDBFOR, that the fix is inaccurate (though still a good improvement), and both Fritts and Guiot agreed [3]. Although the inaccuracy is often small, this should again remind ITRDBFOR subscribers of the 1991 paper.
None of this would seem to have a large effect on the ClimDyn paper. Still, I would have expected the issues to have been mentioned, at least to cite Guiot.
Links are not working correctly; they should be
[1] http://listserv.arizona.edu/cgi-bin/wa?A2=ind0408&L=itrdbfor&T=0&P=3893
[2] http://www.treeringsociety.org/TRBTRR/TRBvol51_39-41.pdf
[3] http://listserv.arizona.edu/cgi-bin/wa?A2=ind0605&L=itrdbfor&D=0&F=P&T=0&P=2593
Doug, thanks for your fascinating links. I particularly noted this in Guiot’s paper:
Yep, sure enough …
I was also puzzled by the statement that:
For example, the data that Steve M. has provided for the Wilson paper (16 ITRDB series) has an average lag-1 autocorrelation of 0.67, max 0.95, min 0.49, with only one of the sixteen series having an autocorrelation less than 0.5. Is this just an unusual dataset, or is autocorrelation usually more than 0.5, or am I missing a step in the process?
All the best,
w.
Re #35
Autocorrelations are frequently that high, Willis.
Re: #30
But, nothing in terms of monetary gain, just reputation, notoriety, tenure (no salary relationships, there), grants, etc., etc, etc, because they’re passionate about what they do.
Re #35, Willis. In the quote, common is used in the sense of “not out of the ordinary” or “undistinguished”. Autocorrelations >0.5 are indeed frequent, as Bender (#36) says.
I should also mention that in discussions with Fritts and Guiot (prior to sending out the message a year ago), each of them was both very polite and unhesitant about accepting the problems. And it was Fritts’ idea that we send out a jointly-signed message, with him being the person to physically send it. It would be great if there were lots more scientists with such integrity.
bender and Douglas, thanks for the replies. I had read the quote as meaning that the autocorrelations were usually that low, which didn’t accord with my experience that they were usually greater than 0.5, and often much greater. Thanks for the clarification.
Also, I would like to second the commendation of Fritts and Guin. Some scientists seems to think that people pointing out possible errors in their work is “trashing” it, rather than being part of the scientific process. Others think that asking for details on their data and methods is “intimidation”. So it is wonderful that there are still some “old-school” scientists out there who are interested in truth rather than personal gain.
I would greatly appreciate a thread comparing and contrasting the methods for adjusting for autocorrelation. I use Nychka’s method, as well as that of Koutsoyannis. They often give very different answers, likely due to the fact that Nychka’s method only measures lag-1 autocorrelation, where Koutsoyannis’s method uses the Hurst coefficient, which measures both long and short range autocorrelation.
Nychka’s also seems more of a heuristic method, while Koutsoyannis’s provides a theoretical basis for his method. I’m sure there are other methods as well, but I haven’t found much information about them, or a comparison of the strengths, weaknesses, or applicability of the methods. Any information gladly accepted.
w.
Willis,
I am sure you will be happy to know that I have received the following from the Editors of Climate Dynamics. However, I think you have done yourself and CA a disservice. I contacted my co-authors over the weekend about whether we should archive the new data-sets and I am sure it will only be a matter of time before the data are available at the ITRDB.
You must understand that your aggressive approach to acquiring data only alienates scientists from interacting with Blogs such as CA. I do not have to read this Blog, but choose to do so as I want to ensure that there is a balanced discussion.
Rob
Hello,
@30 “citation record”
This link
http://www.seedmagazine.com/news/2007/03/scientific_method_relationship.php
is interesting.
Best regards
re 39:
Be careful Willis, don’t make the prima donna angry or she will refuse to sing.
Re 39
Willis,
Was this really necessary? Yes the data need to be archived, but there is no harm in waiting a student to finish, giving them the opportunity to write other papers using the data before it is released for scavengers (like me) to pick over.
If Rob had refused to archive the data, then ask the editors to help extract it, but as says it will be archived it must be better to wait than antagonise him and discourage other palaeoclimatologists from interacting with CA.
Asking you to do, what you are contractually obligated to do is alienating?
RichardT,
And how do we know that he won’t come up with another excuse when this one expires.
Waiting for the grad student to finish a thesis is not a valid excuse anyway.
Rob, I am sorry that you are upset, but I don’t understand why. I only requested that you follow normal scientific practice as codified in the policies of the Journal in which you chose to publish … is this now some kind of crime, to ask you to do what most scientists do as a matter of course? You say my approach is “aggressive” … if you had simply followed scientific norms and the policy of the Journal, I wouldn’t have to have an approach at all, much less an “aggressive” one.
We tried the gentle, polite approach, and we were given an excuse with no name and no time frame attached. As I have mentioned before, we’ve seen this type of excuse ( … I’ll get back to you with the data when my schedule permits … it’s on my other hard drive … I lost the disk … my co-author has the data, I’ll archive it later … it will be archived when “X” is done … it’s intimidation to ask me for the data … etc., etc. … ) far to many times from the dendroclimatology community to believe it again. Yes, it might be true in your case … but the sad truth is that at this point, dendroclimatologists have cried wolf too many times to be believed.
I truly appreciate your participation here, as I have said many times, because you have style and humor, and because you have provided much valuable information and insight. However, I also appreciate scientists who follow scientific norms, as well as those who follow the policies of the journals in which they choose to publish. If you don’t like a journal’s policies, you are certainly free to publish elsewhere. If not, follow their policies. Why is this such a hard thing to ask of you?
THE ESSENCE OF SCIENCE IS REPLICATION. That’s why the journals have the requirements they have, to ensure that studies published in their journals are able to be examined and tested when the paper is published. Not at your convience. Not when your co-author’s student’s thesis is done. When the paper is published.
It’s not just a wild idea that the journals had one day … it is the heart and core of science. It is something that you should do without any prompting, not something that the journals should have to require that you do, and most certainly it is not something that I should have to ask the journal to have you do.
In any field of science, this should not require comment. This should not require my action. But in the field of dendroclimatology, where there has been such egregious violation of the normal scientific practices, I am absolutely blown away that you would not be extra careful not to be associated in any way with the kind of shabby, slip-shod data practices that have been decried by everyone from the blogs to the mainstream media to the journals to a variety of scientific committees.
I see this as a tragic state of affairs as it regards your study, for two reasons. First, because I think you are a good guy, and second, because your study appears on the surface to be one of the better that I have seen … but we can’t really say if it is, can we, because you haven’t revealed the data.
w.
PS – Rob, curiously, my inspiration for writing to Climate Dynamics was that you had said above:
I hadn’t thought of that, but it seemed like a good idea, so I did as you suggested, submitted my issue to Climate Dynamics, and now you claim the action that you suggested was “agressive”?
w.
While archiving is clearly a hot button though perfectly legitimate issue for CA, it seems appropriate to recognize that things are not going to change overnight. It would be more helpful to work with Rob and other more open-minded climatologists to ensure that CD and other journals follows its own policies or change them in the direction that allows for replication of findngs. Tone, intended or unintended, counts for a lot.
#44
Its called trust. Rob has archived lots of data in the past, there is no reason to suppose that he won’t in the future. There are plenty of palaeoclimatologists who have archived little or no (useful) data, these are the people who should be chased, not those with a perfectly legitimate reason.
Remember, this paper has only just been published – it’s in the March edition of Climate Dynamics. The student probably has other manuscripts in preparation or review. After the work they have done in the field and lab, its only fair that they get the chance to publish these with interference from other authors.
If you have serious concerns about the validity of a paper, and want to write a comment on it, then its reasonable to demand the data immediately. Otherwise relax and wait. If the data isn’t archived within the year, then its time to start writing to editors.
Richard:
In principle I agree with the request for patience and respect. However, given the potency of the issue and its associated politics, it seems to me that the policy of archiving by the time of publication is the standard to shoot for: 12 months is too long.
That said, I would appreciate further commentary on the current Wilson paper from those here who have a strong grasp of the issues involved.
Willis,
I was talking about the science and going through peer review:
Of course, without the data, you cannot assess my methodology and final reconstruction. Patience is a virtue. The data will come. Greg Wiles is very good at archiving his data.
I do not have a problem with your letter pers se ‘€” I am not even upset – but I am a little frustrated that you did not give my co-authors and I any reasonable time to discuss this issue.
Anyway, I feel I have gained nothing from my exchanges with CA over the past week, so this might be my last post for quite a while.
Rob
Rob,
If you were to review a thesis, and the student would say, ow I give you the data when I am ready. I think you would not give him a pass. How come the editors of the journal gave you the pass and published?
Different standards once you’re graduated.
#48. First of all, I obviously think that the data should have been archived at the time of publication and I agree that not archiving the data is a violation of Climate Dynamics policies. Rob threw down a bit of a gauntlet by saying that anyone who had any beefs should go to the journal and, on one sense, can hardly object when Willis did. Having said that, Rob and I exchanged emails offline that were much more pleasant; I thought about recording this online and, had I done so, perhaps the tone of Willis’ request might have been a little less sharp.
As to Richard’s point in #48 that a year is a reasonable length of time to wait before contacting the editor, the experience in other fields is that , if the data is not archived at the time of publication, the authors will typically move on to other things and there is no guarantee that the data will ever archived. Lonnie Thompson had never archived any data from his Himalayan sites, some taken in 1987, until I started raising the issue in 2004 and then archived the least conceivable information.) The time when the data is most useful is when you read the article. I like to see what actual data looks like before its massaged and the best time to do this is when you read the article. So the data should be online contemporary with publication rather than a year later when you may or may not still be interested int he file.
As it happens, many of Rob’s associates aren’t very prompt about archiving data. None of Luckman’s data is archived; Rob’s ICefields and B.C. data done with Luckman are not archived, other than the reconstruction. None of Esper’s data from Tian Shan is archived. Esper refused to provide data except through repeated requests through Science and even after over 3 years of effort, the data provision is still not quite complete.
Wiles is a different story. He has archived data in the past, although with some delay, due no doubt to the wish of students to use the collected data.
The trouble with this particular request is that, as it unfolded, Rob views the request as a type of punishment for participating here and as a disincentive to defend his views here, and, within his world, it will be viewed as a vindication for people like Esper who tell him to avoid climateaudit with a bargepole.
So what’s my view:
Willis, I think that priorities need to be set. There are any number of data archiving fights that need to be fought and picking one with Rob, regardless of the merits, isn’t one that I would have initiated.
Rob, if the plans of your group was to archive your data anyway, then I would encourage you just to tell the journal that you will do so right away. Perhaps this is a little ahead of the planned schedule, but I can’t see that it’s any skin off your nose to do so. If Esper taunts you about it, maybe you could take issue with him about his archiving policies.
I would also urge everyone to take a deep breath.
@Richard
the article was received April 2006, published online: 17 October 2006.
It may be just been published in the March edition of CD but since submission more than 10 month have passed.
So much for patience.
Rob:
You say you were talking about the science. Perhaps you didn’t notice that I was talking about the science as well.
You still haven’t addressed the issue of being willing to publish first, and keep the data secret until you decide to publish it. That’s not science.
I would very much like to hear your reasons for being willing to ignore both the policies of your chosen journal as well as scientific norms, and I think CA would be a good place to explain your reasons. Perhaps they are good ones, but until you face the issue squarely, instead of avoiding the question by focusing on your frustration that I’ve asked you to publish your data now and not at your convenience, how will we know if they are good reasons or not? While I would like very much to believe that you are blameless in all of this, that there are pressures or other situations that impelled your actions, your decision to abruptly depart without explaining those reasons does not exactly inspire confidence.
You say you have gained nothing from your exchanges with CA, and will not post for a while. I am saddened to hear that, as your contributions have been valuable, and I had hoped that you would explain your actions. I trust that at least you have gained some awareness of how your actions look, and some further knowledge of standard scientific norms and what happens when you choose to ignore them. I also hope that you have learned that we will hold dendroclimatologists to the same standards as other scientific disciplines, and that the free ride is over. The dendroclimatological community stood by and did not protest when Michael Mann and others flouted scientific practice, and so you have no one but yourselves to blame when you have to pay the price of intense scrutiny and mistrust. RichardT says “It’s called trust” … but why should I trust scientists who don’t speak out when they see Michael Mann claiming that asking for data is “intimidation”?
RichardT is right when he says that you have archived data in the past, which is true. This is why I was so surprised that the data for this study was not available, and that you would treat the matter so lightly. It is also why I am surprised that you intend to leave without explaining your reasons in greater detail than saying “some graduate student controls the data and it will be released when s/he is done with it”.
w.
I fear that in 12 months, we will be told that the study in question is “old news”. Or that it has been supplanted by earlier work. Or
that the data has been lost. Or any of the dozens of other exuses that have become standard fare in recent years.
Well, we certainly seem to be stuck between a tree-ring and a hard place. On the one hand, you don’t want to alienate one of the people who has actually been open to discussions on their published findings and yet, how can you have those discussions without having the data available?
Personally, my opinion is if the delay is due to the required use of the data in unpublished form by one or more graduate students for thesis work, then the original study which uses the data should not have been published until such thesis work was complete. This would allow the data to be published immediately with the article, or at least very shortly thereafter. To publish the paper, but not make the data available not only flies in the face of the journal’s requirements, but makes it impossible to attempt to replicate the study. In addition, how can you make a critical review of a paper during the comment period if the data is not available? To me, it’s not enough to publish the data at the time the article is published. It should be made available prior to publishing.
As a follow-up to #56, it would seem to me that you could publish data with the explicit instructions that said data could only be used for comments on a paper soon to be published until such time as the authors release the data to the public domain. Sort of an amended GPL.
Good sites for looking for a temperature signal, if one exists anywhere on earth. Moisture is rarely limited. If anything, sometimes there may be excess moisture – however, most species in that area can handle any amount assuming they are not on perfectly flat land with poor drainage. Very little such land in that part of Alaska.
I agree with Willis E’s stand on the publishing and data availability issue, but would put more of the blame at the feet of publishers and the science community in general. As noted previously monetary concerns, as in salaries, are not perhaps critically important in these issues but those rewards associated with publishing evidently loom large within many scientific and academic communities and thus the availability of data in order to replicate works can be winked at when they get in the way of the ever cherished and sought publication. I strongly doubt that anyone outside the community of scientists and publishers is going to remedy the situation, but that does not mean that healthy reminders and calls for more community responsibility are not called for or cannot have some effect on the process.
Having said all that, I would selfishly like to see this thread concentrate more on the methodologies used in Wilson et al. (2007). I just slogged through a first read of the article and the first question that came to mind is that when the number of options for selection is increased through, for example, the “invalidation” of data sets, use of PCA, choice of seasonal time period start and length and choice of validation statistics’€” unless of course one can, a prior, establish valid reasons for doing these selections and spend time explaining the reasons in the article ‘€” is not one open to data snooping and over fitting the model?
My second question involves Table 1 which shows T and lag T+1 correlations of, I assume, a measure of TR vs Temp. The values for the 22 included individual PCs range from 0.06 to 0.58 and probably have an average around 0.3. The 9 excluded components have an average correlation of less than 0.1. Since I assume that correlation in the table means r and not r^2, would not that mean that the individual PCs on average explain about 10% of the temperature variations. Yet later in the article I was certain I read a statement that indicated that on the whole the analysis could account for 44% of the temperature variation. How, in simple terms, does one get from these small parts making a much larger whole?
The conclusion one might draw from this study’s results, as indicated in the paper’s introduction below, is that natural variations in weather can explain local temperature variation in this micro climate (with no mention of AGW that I was able to find). That one might want to agree with that conclusion should not affect the critique of the methods.
Novice here but if the paper is published then it must have been peer reviewed. How did this review take place without the dataset?
Does variance stabilization lead to a biased estimate or not?
What is the null hypothesis in Fig 7 a and c significant regime shifts? i.i.d Gaussian?
What is the null hypothesis in significant spectral peaks in Figure 8?
Peer review doesn’t generally involve trying to replicate the findings, and peer reviewers do not typically even look at the dataset (unless, perhaps, they have some particular reason to). They are more likely to focus on methodology, how the results are interpreted, and how the results relate to previous research on the subject.
#62, but how can you determine how the results are interpreted if you don’t have access to the data that generated those results. Otherwise, peer review simply becomes an ISO process, whereby you get “certified” for declaring and following a set of processes and procedures to ensure quality control. If that’s all peer review is, then it’s value is greatly diminished.
Jonathon, there have been several threads in which the process of “peer review” has been discussed at length. It is deficient in the very manner you state. There is an automatic assumption that the data are handled properly, which is, as we have seen, not always true.
Mark
Re #60, rpink, and #62, Jonathan.Severe peer-review failures are common. ClimateAudit was founded largely because of the “hockey stick”, whose two passes through peer review are pretty dubious. For an example of a paper on global warming, published in Nature, which has an error that can be understood even by an average 16-year-old, seehttp://www.informath.org/apprise/a3200.htm
There are no effective sanctions for scientific fraud.
Some other fields are worse than climatology. For example, I recently asked the British Medical Journal for some data used in a paper, and was informed that the “authors own the data”—and I had no right to see it. And in the field of pharmacology, where papers are sometimes ghost-written by drug companies, it has been alleged that occasionally even authors have been denied access to the data.
“Please feel free to submit any issues’ …and I will gladly address them through the peer review process”: if one has concluded that
many dendrochronologists are crooks, what is the virtue of a man who is not a crook having his work peer-reviewed by people who may
well be crooks?
UC: After pondering your earlier post on the variance adjustment, I must say it’s baffling how this common procedure in dendroclimatology can be justified. I can see how, looking at a reconstruction with highly amplified variance early in the record, one might desire to obtain a more ‘realistic-looking’ reconstruction by scaling down the variance in the early portion.
But a noticeably-amplified variance is prima facie evidence that the tree-ring indicators are too few and/or too divergent to estimate the variable of interest with confidence. I have a hard time understanding this adjustment as anything other but an effort to artificially ‘pretty-up’ the reconstruction time series, providing false confidence in its reliability in the process.
Jesper:
Here is where we need to get dendroclimatologists to discuss their assumptions. They may be perfectly legitimate, but so buried in standard practices nobody even thinks to explain why it is done. We can’t automatically assume that the process is unwarranted until we understand the issues. Fir example, Wilson et al describe a process that adjusts the widths for age. This makes sense at some level though this adjustment also may be a source of bias. This is why I am a bit disappointed that Rob Wilson has limited his involvement: He could at least provide a quick explanation. Is there another dendro expert in the house?
Re 60 Peer Review Failures:
Peer Review in PLoS Medicine
An interesting editorial with 12 references.
Bernie,
I think you may need to go back to some of the early discussions on this blog. The trouble is that after a couple of years we have a lot of new people who haven’t been through the earlier discussions. I realize it’s a bit of a slog to read stale threads, but if we just keep repeating the back story, it gets boring for those of us who’ve been through it before.
Yes, there’s a lot of questions about the standardization of the rings of individual tree, but it’s not quite as weird as it sounds. Because you normally have overlap between various trees at a given site even if the selected standardization isn’t totally accurate it will average out over the whole site. But there are end effects that can be a problem and also time periods where there are only a few or even only one tree can be problematic.
Dave:
My comment was really addressed to what I saw as an unnecessary aggressive response to Rob Wilson, when I thought that Steve was hoping to engage him in a substantive discussion of methods and procedures both with respects to aggregating proxies and with document the environment within which the trees were found. Alas this discussion has not materialized, though I felt Wilson’s paper was pregnant with possibilities and Rob seemed open to discussions.
On the other hand you are right and I am only a recent reader of these pages. To date this site has been a pleasure in terms of the level of inquiry and willingness to share and work ideas.
Link
I have been wondering for some time now if you would begin to apply “peer” reviews of the most commonly used graphs used for debate. As noted above, the sun spot/ temp graph has been the main focus of attack. Is it worth adressing this issue inside of CA?
Re: #72
If your going to quote something, please cite the reference or give a link.
Thanks
#67
Me too. It seems that radio silence is applied when the in-depth discussion begins. Which is interesting, because even gavin drops by if he finds a clear mistake in our writings.
I have nothing to add to my first question,
but I can elaborate on the other two questions:
Wilson 07 refers to Rodionov 2004. Chap 2., Student’s t-test. That had something to do with sample and population means of normal population, if I remember correctly. That’s fine, we are testing i.i.d Gaussian against i..d. Gaussian. I’d be interested to see what happens if the true underlying process is AR1, for example. Many many regime shifts?
Here the good old MannLees 96 is referred. H0 is hand-waving, some king of AR1 process with unspecified p. Slutsky-Yule effect is not discussed, even though we are clearly dealing with oscillations that have random period and amplitude. I’ve tried to spot the largest mistake, maybe it is here:
mike, can you tell again how did you define signal?
Sorry for the whining, I just think that the paper is not very good.I think that the problem is not in the paper itself, but in the references, Osborn et al 97, Mann Lees 96, Rodionov 04. I’d like very much if those people would bring me down now, if I’m wrong. I’ll promise to admit that when I finally understand where do I go wrong.
It’s even worse with IPCC. I was an IPCC 4AR reviewer and requested data from two then unpublished papers – Hegerl et al 2007 and D’Arrigo et al 2006, Rob is a coauthor of the latter. IPCC refused to provide it and referred me to the authors. The authors complained and IPCC told me that, if I requested data for any of other unpublished papers submitted to IPCC for use in AR4, I would be expelled as a reviewer.
ONe of the temperature proxies in Wilson et al 2007 is yellow cedar. Here is a reference to 4 yellow cedar chronologies from Vancouver Island, B.C. The chronologies appear as follows. Again I find the distinctive HS shape hard to discern as well as the linear positive response to 20th century temperature increases.
The reason that I was hoping to see Rob’s data is that he has picked an interesting site. This is because the temperature data of the various ground stations is actually correlated, because of the effect of the Pacific Decadal Oscillation (PDO) on all of Alaska, particularly the Pacific maritime region. Here is the average of the five temperature datasets that Wilson has chosen:
This is the raw yearly data (no smoothing). As you can see, there is a strong common signal in the five datasets. Next, here is the same graph with the unsmoothed yearly PDO overlaid over the temperature data:
As you can see, the average of the five temperature datasets is well correlated with the PDO (r^2 = 0.53). This means that if there is a signal to be extracted from the trees in any region, it should be visible in this one. (These are for the full year, I haven’t looked at the January – September relationships … heck, I don’t even know why Wilson picked January-September, I haven’t seen that in any tree proxy reconstruction … but I digress.)
That’s why I was so disappointed when, following modern dendroclimatology practice, Rob decided to publish the study without the data … ah, well, I suppose we’ll get to see it someday …
w.
One thing that has been puzzling me.
Given the broad range of temperatures that most trees species are able to survive in.
Given the fact that the earth has warmed up at most 0.6C +/- 0.2C.
Why would we expect to see a discernable change in growth patterns to begin with?
Hello Steve,
@75 You wrote “I was an IPCC 4AR reviewer and requested data etc….”
Would it be possible to put this answer from the IPCC as a Pdf in the blog? This must be told to the world 😉 I really can’t believe it…
Not event Stepehen King could write a better thriller than “real life”… 😉
best regards
Edouard
#77, well I guess the answer is that survival and optimal/higher growth are separate things. Trees survive in very harsh climate conditions, but the same specie grows much better if moist and temperatures are different.
An interesting question would be: What is the optimal temperature ceteri paribus. What if certain trees grow less under higher temperatures? And to make this more complex, summer and winter temperatures differ also, so higher overall may mean better for winter and less optimal for summer. And add to that temperature changes during the centuries have varied unequally during winter and summertimes also.
1. I remember when citations first appeared and people used them in their submissions for promotion or tenure. It occurred to me then and does today; what is the point? A paper can be cited hundreds or even thousands of times because it is so bad; witness the hockey stick paper. There were four phases in its citation history. It was cited by those who wanted its value as proof of a human signal. Then it was cited as evidence of bad research. It is cited for what not to do in research using incorrect, inappropriate, or misunderstood methodologies. It is also cited by those who want to defend the indefensible and reinstate the paper as an important contribution to climate science. Do those who count citations pick only positive ones?
2. I am also puzzled by the failure to submit or have immediately available data from which a publication was produced. In order to analyse data you have to collect it, understand its limitations and strengths and make necessary adjustments using standard techniques. These are all the issues others need to judge the validity of the work. If all this is already done why is further time necessary to make it available after submission? If it is not organized and understood when the article was submitted how was the paper produced? I am reminded of my schooldays math exams, which always had the instructions, “Show your work notes.” In other words the examiner needed to know how you arrived at the answer. The method was as important as the result.
#75
Interesting approach of the commitee…
I’m just struggling with a paper for Fungal Diversity and in the Instructions for authors it says:
Which means that in the submitted paper, the database accession numbers must be already present. So I really don’t understand why especially the political minefeld of climatology allows such a secretive approach.
72: That Independent article has a few good points, but it is mostly wrong. There are problems with the sunspot cycle length/temperature curve, but I don’t think it has been totally discredited (need to wait for a couple more solar cycles to see). To my knowledge, Shaviv’s work has not been discredited. And there is a tremendous amount of evidence that the MWP was warmer than today.
RE; 376 – Vancouver Island is a brilliant non moisture limited area, another excellent place to discern what if any temperature signal we might expect to be part of a tree’s “growth signal.” And of course, no trend.
RE#81,
I have published in Mycologia and had to follow exactly the same procedures. Of course, I was just a lowly graduate student so I assumed that the rules (archiving sequences in Genebank,freezing cultures, saving lab notebooks, SAS programs, etc) applied. Silly me.
#83
Steve:
Is it as simple as that? Would excess rain or excess cloud cover, for a given temperature, have an impact on tree ring width?
RE: #85 – Here on the immediate W. Coast, our trees tend to respond to overall hours of daylight levels (direct sun does not appear to be all that key) and moisture. At higher latitudes the annual growth spurt begins at the outset of Spring, at lower latitudes after the first real rains (typically a few days after the Winter Solstice). The growth killer out here is drought. Interestingly, growth slows after about a month with no rain. Up north that means it might not slow in summer in a given year, further south it slow nearly every summer. Up north, even if there has been a wet summer, fall slows it “the old fashioned way” e.g. due to diminishing light. With deciduous trees, in the south it’s the drought stress which leads to leaf turning up north its lower light and frost. YMMV …
Veizer shows clearly that the growth of most vegetation in temperate zones is limited by moisture.
Come on guys. Lay off Rob. His paper is fine. It has been peer reviewed! So it must be right.
(Hasn’t it?)
jae:
The Veizer article seems to be an excellent and balanced summary – though very demanding form me and I am not really equipped to analyze everything he said. Bottom line he is saying we should look to the obvious before worrying about the marginal, especially given that the obvious – the Sun and water vapor – have such a strong correlation with the observed temperature phenomena. It reads like he miust have been among the IPCC scientists? Has he spoken about the latest IPCC pronouncement? Did I miss it?
jae:
The Veizer article seems to be an excellent and balanced summary – though very demanding for me and I am not really equipped to analyze everything he said. Bottom line he is saying we should look to the obvious before worrying about the marginal, especially given that the obvious – the Sun and water vapor – have such a strong correlation with the observed temperature phenomena. It reads like he must have been among the IPCC scientists? Has he spoken about the latest IPCC pronouncement? Did I miss it?
#91 & #92
My apologies. I got an error message and resubmitted. I will be more patient in the future.
91:
I don’t know if he is an IPCC guy (doubt it), and I have not heard what he thinks of the IPCC stuff. But he teams up with Nir Shaviv, so he may agree with Shaviv on the IPCC documents.
Hello,
Here is a good link about what happened to Shaviv and Veizer:
http://motls.blogspot.com/2006/09/cern-to-create-cloud-with-cosmic-rays.html
Best regards
Edouard:
Thanks for the great link and thereby links to other links. However, apart from the seeming conclusion that Shaviv is not in the IPCC loop, I do not quite understand “what happepened to Shaviv and Veizer.” Am I being dense?
Dear Edouard, I also thank you for posting the link here although for a different reason! 🙂
Well, I heard back from the editorial staff at Climate Dynamics, who said:
Gotta love the journal folks, they have requirements for archiving as a precondition for publication, but when they don’t enforce the requirements, somehow it’s up to the authors and the journal has no responsibility … does this all sound strangely familiar?
I do note that the editor at least acknowledges that archiving is normal and should be done … I guess that’s progress.
w.
I had said:
A couple of people pointed out correctly that I was interpreting it backwards, that it is the cycles greater than 100 years which are not significant. In that case, two questions:
1) It seems to me that if cycles greater than 100 years cannot be recovered, the thing to do would be filter it with a 100 year bandpass filter, and then subtract the filtered data from the original data to eliminate the long-cycle swings. Is this correct? I haven’t found any reference to doing this in Rob’s paper, but I could have missed it.
2) If cycles over 100 years are not recovered, how can we do millennial reconstructions using tree rings?
All answers welcome …
w.
#99
Mann must have used different detrending method in MBH99:
#99
1) There’s no need to remove low frequencies from “traditional individual series detrending” data, as the method automatically removes it with the trees growth trend.
2) Millennial reconstructions hoping to recover the low frequencies don’t rely on “traditional individual series detrending”, but on other methods such as regional curve standardisation.
It is good that Mann didn’t use the traditional method! Required MSL would be more than 6000 years.
So, this RCS method contains following steps (?) :
1) Observe the raw ring widths
2) Cross-date
3) Scale individual series to unity variance (?)
4) Age-align (innermost rings to t=1)
5) Compute the mean value over age-aligned series (+smoothing ?) = RC
6) Compute departures from RC
7) re-align these departures, back to correct age
8) Compute the mean
9) Apply the Osborn variance adjustment
As richardT pointed out, there is no need to remove the low frequencies because they are already gone from the processing.
That said, normally, a filter operation does not subtract the output from the input in such a manner, i.e. a highpass filter would be used to remove the low frequencies, and a separate lowpass filter would be used to remove the high frequencies .
Mann does the subtraction method in his RegEM application, subtracting the lowpass from the composite to generate the highpass (It’s been a while since I read the code, so it could have been somewhere else). I’d have to look at tractability a little closer before making definitive conclusions, but this is generally not done in signal processing apps. The primary problem is that you need to account for filter delay. Mann solved this by using a zero-phase filter, which is non-causal for anyone that wants to investigate.
Mark
One Trackback
[…] commented the other day on the form of Principal Components Regression used in Wilson et al 2007 and prior articles by […]