Dendroclimatologists have told us that they want to root out misinformation like anyone thinking that white spruce chronologies from northern Alberta archived at the ITRDB are temperature proxies. I’ve conveyed that message to CA readers and I’m happy to report that, as far as I know, CA readers agree that northern Alberta white spruce chronologies archived at the ITRDB are not temperature proxies.
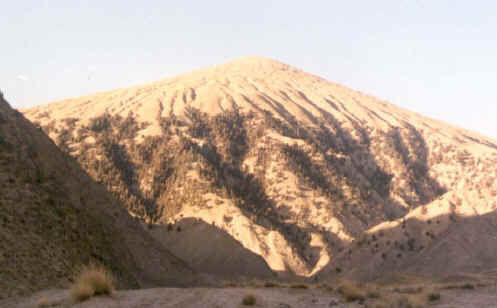
Following that successful mission, I’ve got a project for the Dendro Truth Squad. Shao et al report that Qilianshan junipers are (unsurprisingly) said to be limited by precipitation. The picture below shows Qilianshan junipers and does not contradict the report of Shao et al that they are precipitation limited. (The closing picture in the presentation by Shao et al, see below, evidences precipitation limitation even more dramatically, but, upon checking, it turns out that Dr Shao does not know where this picture comes from and it appears that the picture was inserted in her presentation for dramatic effect only.)
Although Qilianshan junipers are said to be precipitaiton limited, Qilianshan juniper chronologies are directly used as temperature proxies in Crowley and Lowery 2000 and Yang et al 2002, with the Yang composite being used as a proxy in many Hockey Team studies: Mann and Jones 2003, Moberg et al 2005, Osborn and Briffa 2006, Hegerl et al 2006. Obviously this looks like a good mission for the Dendro Truth Squad.
Qilianshan Junipers
Shao et al, the authors of the presentation cited above, have an article online at PAGES about the development of an 11-site chronology in the Dulan-Delingha area, with the following location map. The sites are all between 3700 and 3910 m. Thus there are at virtually the same latitude and altitude as the bristlecones in White Mountains CA.

The authors state (and this finding is echoed in all other articles about the area):
Precipitation and mean maximum temperature in May and June are highly limiting to growth of Qilian Juniper in study area;
Other articles about Qilianshan junipers in the past few years are listed in the references below; long chronologies located approx. 65-150 km south of these sites are discussed in Zhang, et al., 2003. Zhang et al 2007 and Sheppard et al 2005 also discuss this area. In every study, spring precipitation is said to be the limited factor – unsurprisingly when one looks at the sites. Liu et al 2006 say that precipitation is limiting for both upper and lower treelines.
Crowley and Lowery 2000
On slide 3, the authors cite Wang et al (Kexue Tongbao 1983) as being a prior reports on Qilianshan junipers. Crowley and Lowery 2000, one of the most cited multiproxy studies and a study that is often used to make the case that warmth in the MWP was regional, includes as one of their small collection of proxies was:
” a tree ring record from the Qilian Shan Mountains of western China (25)”
Reference (25) is:
25. Wang, Y., Guangyuan, L., Zhang, X., and Li, C. 1983. The relationships between the tree rings of Qilianshan juniper and climatic change and glacial activity during the past 1000 years in China. Kexue Tongbao, 28, 1647—1652.
So Crowley and Lowery 2000 used Qilianshan junipers, known to be a precipitation proxy. Over to you, Dendro Truth Squad.
Yang et al 2002
The story of the Qilianshan (Dulan) junipers doesn’t end with Crowley and Lowery 2000. Yang et al 2002, widely used in Hockey Team studies (Mann and Jones 2003; Moberg et al 2005; Osborn and Briffa 2006; Hegerl et al 2006) also included a “Dulan tree-ring record” , reported as follows:
Four of the series are related to the Tibetan Plateau (TP) (Guliya ice core, Dunde ice core, Dulan tree-ring record in the northeastern TP and a composite tree-ring record from the southern TP) and 5 series were obtained from Eastern China and Japan.
As a source for their Dulan tree ring record, Yang et al 2002 cite Yang , B., X. C. Kang, and Y. F. Shi, 2000. Decadal climatic variations indicated by Dulan tree ring and comparison with other proxy data in China of the last 2000 years, Chinese Geographical Science, 4, 193—201. I haven’t been able to locate Yang et al 2000, but coauthor Kang is also coauthor of Zhang et al 2003 Zhang, Q.-B., Cheng, G., Yao, T., Kang, X. and Huang, J., 2003: A 2,326-year tree-ring record of climate variability on the northeastern Qinghai-Tibetan Plateau. Geophysical Research Letters, Vol. 30(14), 1739, doi: 10.1029/2003GL017425) which appears to describe the same sites (or very similar sites) as Yang et al 2000. Zhang et al:
Our study area is located in Dulan (35 50 – 36 30N, 97 40 – 98 20E) of northeastern Qinghai-Tibetan Plateau (Figure 1)… Sabina przewalskii Kom. is the most important single tree species on south-facing mountain slopes, and usually grows scatterly in open stands at an elevation between 3100 m and 3800 m. … Here we present a 2326-year tree-ring chronology of Sabina przewalskii Kom. for Dulan area of northeastern Qinghai-Tibetan Plateau. We find that the annual growth rings mainly reflect variations in regional spring precipitation…. Twenty samples from the ancient tombs and 68 samples from Dulan living trees, among which 55 samples were collected and examined previously in a separate study [Kang et al., 1997], were successfully crossdated. …The growth of sabina trees is under stress as indicated by the stripbark morphology and partial dieback of some upper limbs.
The most recent article on the area Zhang et al (Dendrochronologia 2007) also stated that spring precipitation was the limiting factor in Qilianshan juniper (Sabina).
Climate—growth response function and correlation analyses show that radial growth of Sabina [juniper] trees is positively associated with total precipitation in May and June of the growth year. Multidecadal variation in Delingha tree-ring chronology exhibits similar pattern with those of Dulan and Wulan chronologies of the nearby areas, suggesting that spring precipitation is a major factor limiting the growth of Sabina trees over a large spatial scale.
So I think that we can conclude that these Qilianshan junipers do not qualify as temperature proxies within any criteria of the Dendro Truth Squad. OK, angry dendroclimatologists, take up your keyboards and demand that the offending authors correct their misinformation.
Update, Apr 15, 2007: This post originally included a picture from the final slide of a presentation by Shao et al here entitled “A Dendroclimatic Study of Qilian Juniper in the northeast Qinghai-Xizang (Tibet) Plateau”, which shows a photograph of a tree in a desert. A reader wrote in that, despite its position in the Shao et al presentation, the tree was not a Dulan juniper. I corresponded with Dr Shao and she said that she was unable to recall where the photograph was taken, but said that it was not a Dulan juniper. The photograph has been transferred to this thread, where other “tree in desert” pictures from western China are shown. Please note the excellent satellite photo submitted by Willis Eschenbach below here which shows the sampling areas – brownish looking south-facing mountains to the west of Qinghai Lake.
References:
Kang, X., Graumlich, L.J., Sheppard, P.R. 1997. A 1,835 year tree-ring chronology and its preliminary analyses in Dulan region, Qinghai. Chinese Science Bulletin 42(13):1122-1124. (also cited as Quatertnary Sciences)
LIU Yu , AN Zhisheng , MA Haizhou , CAI Qiufang , LIU Zhengyu , John K. Kutzbach , SHI Jiangfeng , SONG Huiming , SUN Junyan , YI Liang , LI Qiang , YANG Yinke , WANG Lei , 2006. Precipitation variation in the northeastern Tibetan Plateau recorded by the tree rings since 850 AD and its relevance to the Northern Hemisphere temperature Science in China Series D: Earth Sciences (Chinese. I’ve only looked at the English abstract here)
Lu-San Liu, Xue-Mei Shao, Er-Yuan Liang (2006) Climate Signals from Tree Ring Chronologies of the Upper and Lower Treelines in the Dulan Region of the Northeastern Qinghai-Tibetan Plateau, Journal of Integrative Plant Biology 48 (3), 278—285. doi:10.1111/j.1744-7909.2006.00158. (I’ve only looked at the English abstract here
SHEPPARD P. R. (1) ; TARASOV P. E. (2) ; GRAUMLICH L. J. (1) ; HEUSSNER K.-U. (3) ; WAGNER M. (3) ; ÖSTERLE H. (4) ; THOMPSON L. G. (5) ; 2004. Annual precipitation since 515 BC reconstructed from living and fossil juniper growth of northeastern Qinghai Province, China, Climate dynamics, 23,. 869-881 http://www-bprc.mps.ohio-state.edu/Icecore/Abstracts/sheppard_et_al_clim_dyn_2004.pdf
Shao, Xuemei, Lei Huang*, Xiuqi Fang’€ *, *, Lili Wang*, Junbo Wang*, Haifeng Zhu, A Dendroclimatic Study of Qilian Juniper in the northeast Qinghai-Xizang (Tibet) Plateau, http://web.archive.org/web/20031204084631/http://www.igsnrr.ac.cn/files/sxm20020918.pdf downloaded ~2003.
Shao, X.M., Huang, L., Liu, H.B., Liang, E.Y., Fang, X.Q., Wang, L.L., 2004. Reconstruction of precipitation variation from tree rings in recent 1000 years in Delingha, Qinghai. Science in China (Series D) 34, 145—153.
XUEMEI SHAO, ERYUAN LIANG, LEI HUANG AND LILY WANG, A 1437-year Precipitation History From Qilian Juniper in the Northeastern Qinghai-Tibetan Plateau http://www.pages.unibe.ch/products/newsletters/NL2005_2low_res.pdf
Wang Yuxi, Liu Guangyuan, Zhang Xiangong Li Cunfa: 1983, The relationships of tree rings of Qilianshan Juniper and climatic change and glacial activity during the past 1000 years in China, Kexue Tongbao, 28(12):746-750.
Yang Bao, Achim Braeuning, Kathleen R. Johnson, Yafeng Shi, 2002. General characteristics of temperature variation in China during the last two millennia. Geophysical Research Letters 10.1029/2001GL014485
Zhang, Q.-B., Cheng, G., Yao, T., Kang, X. and Huang, J., 2003: A 2,326-year tree-ring record of climate variability on the northeastern Qinghai-Tibetan Plateau. Geophysical Research Letters, Vol. 30(14), 1739, doi: 10.1029/2003GL017425. http://trl.ibcas.ac.cn/download/Zhangqb.Geophysical_Research_Letters.2003.pdf
Zhang et al 2007 A millennium-long tree-ring chronology of Sabina przewalskii on northeastern Qinghai-Tibetan Plateau, Dendrochronlogia 24 http://trl.ibcas.ac.cn/download/Zhangqb.2007.Dendrochronologia.pdf


127 Comments
Are the chronologies from SOUTH-facing slopes? It looks like the studies INTENDED to study the effects of moisture, not temperature.
Is the Dendro Truth Squad different from the Circle of Wisdom?
Hmmmmmmm. It’s very quiet here…wait, I thought I heard something….no, I guess not.
Well ya see, er, um, moisture on South facing slopes Qilianshan junipers and BCPs grow on, is felt to follow a teleconnection, or set of them, which we feel reflect the global mean temperature. See, we proved it! Throw in some principle components, this here special computer code, this here special correction factor, and, voila! There you have it, proof positive of the warmest decade/year/month/week/day in 150,000 yearrrrrrrrrrrrs! /s
Mr. McIntyre? Just a quick question if you do not mind? What happens to the growth of tree rings, say from December to March when the temperature is, say, 10 or 0 or 20 below?
RE: #5 – But that’s an annual thing. On the average, it will not affect the ring widths. Here is a converse scenario. A tree lives in a place where it always has optimal moisture. In that instance, during its critical growth window, be it only during summer, year round, or something between the two, temperature may well be the limiting factor, especially average summer temperature. Lower average summer temperature may mean lower growth. So, back to this case, with little moisture to begin with, the amount of moisture during the growth window will clearly be the major influence. During a year with little to no summer moisture, little to no growth, ample summer moisture, lots of growth. Same deal for BCPs.
What that means, then, is that tree-rings are at best a proxy for the growth season only.
Mark
“Dendroclimatologists have told us that they want to root out misinformation like anyone thinking that white spruce chronologies form northern Alberta are temperature proxies. I’ve conveyed that message to CA readers and I’m happy to report that, as far as I know, CA readers agree that northern Alberta white spruce chronologies are not temperature proxies.”
Steve, when you repeat crap like this, after it has been pointed out why it is crap and after you didnt respond there, why on earth should anyone continue to take you at all seriously?
http://www.climateaudit.org/?p=1303#comment-99788
Okay, so is that about ring width and density? Do any of these studies use O-18 since that is a proxy for temperature? Can O-18 measures come from tree rings? Or would that be too expensive?
I recall many years ago a similar photograph of a tree near the Sahara. The caption said the tree had roots down 100m into the subsurface water supply, which made it essentially independent of surface precipitation amounts. Obviously there is a relationship between subsurface water and precipitation, but much less direct than possibly even annual precipitation. Water tables can be a function of aquifer areas, recharge locations and rate of recharge. Often these can be 100s of kilometres away.
I am aware of Tamarack located around the shores of Canadian lakes with the ability to tap into the water of the lake directly often anchored only in rock with little or no soil support.
I recall studies of wheat in Manitoba in the summer of 1988 when the temperature and precipitation data were comparable to the drought year of 1936. The plants suffered, some going beyond the wilting point and dying, but a high percentage survived albeit with reduced productivity. It was discovered the wheat sent roots down up to 3 m to obtain moisture.
I would like to know about the root structure capacity of the tree. I would like to see accurate records of the surface, subsurface moisture and the varying levels of the water table before drawing any conclusions. At a seminar on urban heat islands and urban design with city planners I raised the issue of the function of trees in the city. I also pointed out that many trees are completedly surrounded by impervious surfaces often right up to and around the base of the trunk. The question was, how do these trees get their water supply? The answer in may cities is they get their revenge by tapping into sewer and water lines – as any urban water and sewer engineer will attest.
Lee:
I am unclear how your statement is relevant to the discussion about Qilianshan Junipers. Are you saying that the statement concerning their being precipitation proxies not temperature proxies is inaccurate? If so, I for one would be interested in understanding how you in fact partial out the temperature proxy.
Lee,
I think you are clearly missing the point of what Steve is saying. The dendro community is all of the single minded opinion that Climate Audit is “spreading misinformation” and on their listserv, they are trying to figure out a way to combat the misinformation. Steve has given them an open forum all to themselves on Climateaudit in which they can do that. He also has gone back and updated his post to reflect the fact that it was pointed out to him that White Spruce’s are not temperature proxies. Nobody here is in any way disputing now on this website that white spruces are not temperature proxies.
What Steve IS asking for is tit for tat. If the dendro community is going to work themselves all into a lather over the “misinformation” on Climate Audit, then they should be similarly willing to work themselves into a lather when other members of their own community try to “spread misinformation” by using non-temperature proxies such as Qilianshan Junipers in paleotemperature reconstructions. If they are unwilling to criticize members of their own profession for the SAME EXACT ERROR that they have gotten so aflutter over when Steve made it, then their intent in criticizing Steve becomes apparent to all.
I’ve added the phrase northern Alberta white spruce chronologies “archived at the ITRDB” to remove any possible concern that Lee might have had with this phrase. I’m sure that Lee will now get behind or even lead our efforts to get the Dendro Truth Squad to root our misinformation about Qilianshan junipers, wherever the chips may fall.
Steve, I think that this phrase
Might be the key. Maybe you could write Crowley and ask why he included this series in his recon. I suppose if precip and temp are highly correlated (or negatively correlated) in this region then precip could be used as a proxy for temp. You whould have to look at the ecological and climatic conditions prevailing on the sites used to figure this out.
Also, in another thread you asked why I figured you did not read Fritts. Basically it is because you made the boneheaded move in the White Spruce thread. In addition your constant harping that there are no a priori reasons for thinking that a given chronology is a temperature proxy. Most of the chronologies used as a temperature proxy are collected from sites (altitudinal or latitudinal species treelines, north facing slopes, etc.) which are limited by cold temps. In theory these should — and seem to in most cases — be linear responses to the climate. However there are still interesting questions concerning response even at the site level. Hey guys, this is what makes science interesting, not statistics…
JMS, you say:
I’d appreciate a citation for two claims made there. One is the claim that there is a “linear response” to the climate. Another is that “most” samples from north facing near-treeline sites show said “linear response”.
Since the response of plants to temperature is well known to be highly non-linear (both too cold and too hot yield narrow rings), the first one seems extremely doubtful.
And since a number of sites even in the theoretically best locations do not show a positive correlation, I’d have to see a study showing that “most” of those sites are useful for temperature studies.
Finally, what is “the climate” to which the trees are theoretically showing a “linear response”? Temperature? Degree-days? Cloud cover? Precipitation? CO2 levels? Wind strength? Some combination of these? Obviously, all of these affect growth. Are you saying you think the sum of them is “linear”?
w.
JMS, another thought. Your quote says:
Surely if high temperatures are a limiting factor, the site would not be a good proxy for temperature. The quote implies that tree growth stops when the summer temperature gets too hot … how can you disentangle that from the growth stopping when the temperature gets too cold?
The rationale for the choice of north facing treeline sites is the assumption that the tree growth at those sites is limited by low temperatures, not high temperatures …
The underlying problem with the assumption that trees have a “linear response” to temperature is … they don’t.
w.
JMS, at the NAS Panel hearing, Hughes distinguished between what he called the Schweingruber approach – in which one collected samples from a population of sites believed ex ante to be temperature sensitive and analyzed these results – and the Fritts-[Mann?]approach in which did not worry about what was the limiting the factor and used software to sort out the temperature signal. I thought that it was an excellent distinction, although Hughes’ interpretation of Fritts is not necessarily according to your reading. To this, I would add the Jacoby approach which I will describe later.
I’m OK with the Schweingruber approach. That really makes sense to me. Schweingruber made a collection of hundreds of sites in the late 1980s-early 1990s. However, there was never a report on the ring widths of the Schweingruber collection, although Briffa used large subsets of the Schweingruber collection in numerous reports on the MXD series. There is only one passing reference to a composite of the SChweingruber RW population in Briffa et al 1998 – a graphic that I’ve cited repeatedly – it’s the one that starts the divergence problem. The divergence of tree ring widths and temperature is observed in the only large-population collection of temperature-sensitive sites. My objective in seeing the updates is to apply the “Schweingruber approach” – see what happens in updated series across a population of ex ante temperature sensitive sites. The Briffa approach to this result was to bodily lop off post-1960 values and “assume” what seems to be no better than a cargo cult explanation for the post-1960 divergence.
Obviously, MBH did not use latitudinal or altitudinal sites. They used a total grab-bag of sites. In our Reply to von Storch , we showed that virtually none of the sites had a correlation to gridcell temperature, while a substantial number had a response to gridcell precipitation, which is hardly surprising (and a small subset – bristlecones – had a strong correlation to neither, but did to CO2 levels). They obviously used what Hughes called the “Fritts approach”. Whether Hughes’ terminology is a correct attribution to Fritts, I leave to others to sort out – for now, I’m merely using it to denote a difference in methodology.
Now Jacoby says that he searched out temperature-sensitive sites, but, unlike Schweingruber, he didn’t report on the entire population. He picked the most “temperature-sensitive” sites and didn’t even archive the rest. In his famous 1989 collection, he archived 10 sites out of 36! I requested data from the 26 sites that he didn’t use and he refused to provide it. I appealed through the journal, Climatic Chane, which had instituted a data poilicy following my acting as a reviewer, and the journal asked Jacoby to provide the data and he still refused. His letter discussed in the early days of CA is well worth reading.
The trouble with this methodology is that it is prone to make HS shaped series from red noise, as I observe in my earlier post. I shuold really write up the simulations that show that the selection of 10 series from 36 red noise series with the persistence of the Jacoby chronologies produces HS shaped averages in which the HS-ness of the Jacoby composite is rather close to the median. This sort of cherry-pick and average is just as biased as the Mannian PC method.
Your other point about north-facing, as it happens, is not true about the Jacoby sites. One of my persistent complaints about tree ring archiving is their failure to collect and record relevant meta-data about samples like the altitude (of individual trees in sites with varying altitude) and the exposure of each sample (and other relevant data.) Jacoby mentions in passing – not in his treeline composite article – that his northern sites have southern exposure; indeed the one site without a southern exposure that he reported on did not have a HS shape. See discussion here in which Jacoby says:
The selection and picking criteria of dendroclimatologists are by no means as clear-cut as you say – which is why I’m interested in examining individual selection criteria and in seeing what non-cherrypicked averages look like in updated series. Some dendroclimatologists are pretty silent on recent data and I’ll give a stunning example tomorrow.
Re #14, JMS
So you are joining the call for better data archiving standards ?
#17 Steve M
Well since Jacoby has openly admitted that
“As we are mission oriented, we do not waste time on further analyses if it is apparent that the resulting chronology would be of inferior quality. If we get a good climatic story from a chronology, we write a paper using it. That is our funded mission. It does not make sense to expend efforts on marginal or poor data and it is a waste of funding agency and taxpayer dollars.”
Then at least we can give him some credit for being honest as in this cas ehe is clearly declaring his motives. He is being funded to fin proof of man-caused Global Warming and like all good enviromnetal consultant he has done exactly that. He’s had to reject al the evidence which also shows that there is no correlation between tree ring growth and temperature but hey what’s the problem, he’s only doing what he’s been funded to do. In doing this he therefore continues to be funded and so gets to feed himself and his family. What’s wrong with that?
KevinUK
Is it possible to generate an agreed upon list of tree ring widths that are temperature proxies? Wouldn’t this be essential to any validation work? It would also serve to create the appropriate models and protocols for archiving the data and with these standards things could move forward. I have to admit I am a bit stunned if the above is not already the case. Or is it?
Kevin (#19)
Is Jacoby serious? That is the equivalent of designing a drug study that ex post facto exclude all the patients who had a negative reaction to the drug without paying any attention to what they had in common. It is mind-numbing, if true. The only basis for such a procedure is if you already new what made a patient sensitive or insensitive to the drug – the exquivalent of an ex ante selection procedure.
I went over and had read of the dendro listserv. It looks to me like they are doing a bit of soul searching. Some posts are mentioning the “divergence problem” – tree widths after 1950 do not seem to be responding to temperature as would be expected – and the dreaded word “non-linear” response to temperature is being mentioned.
#19 – Refreshing, thanks. Unfortunately, too long for a bumpersticker.
#20 bernie
May I suggest you visit one of my favourite web sites Numberwatch here. In particular can I recommend that you purchase John Brignell’s books “Sorry,wrong number!” and “The epidemiologists” and you’ll read about many instances in which ‘Jacoby-like’ cherry picking science has been carried out by people who claim to be scientists within the environmental and medical fields.
John A soory about my blatent advert above but I’m sure you agree with me that Numberwatch is well worth visiting if you are someone how is interested in the abuse of numbers as bernie seems to be.
KevinUK
A great deal of the descriptions of data selection just reeks of some of the worst practice of data mining.
Hmm.. I was thinking that an individual tree can be BOTH a temperature proxy and a precipitation proxy : If I fill two columns in excel with normal random numbers (one being the rainfall and the other the temperature) and then average the two (to make the proxy) I can regress the proxy against (a period of) the temperature and use that to get the temperatures of another period, back out [sort of]. OK if the two meteorological series were correlated (spuriously or in reality) then the whole thing might be a mess and presumably if one series affects the proxy a great deal more than the other then the extraction of the less influential series might not work too well. But this sort of thing is done so often that all those involved must know when it could work and when it will likely fail?
I can’t speak to the archiving policies of dendrochronology. NASA’s data
archiving policies are:
Bits of Power: Issues in Global Access to Scientific Data
NATIONAL ACADEMY PRESS Washington, D.C. 1997
Emphasis in original.
As the document goes on to discuss there is frequently a delay for the release of data (6-12 months), for instrument shakedown, calibration, and for the PI’s to present first results. All of this is reasonable IMHO.
Jacoby says:
I disagree with Jacoby. First, I suspect the the majority of the taxpayers money is spent collecting the data not archiving it. Second I doubt that archiving the raw data would be unduly burdensome. As an aside, NASA science data often has a data quality criteria associated with it (for data “users”) and different “levels” of processed data are released from raw, to calibrated, to quick-look survey data. Third, I am particularly disturbed by this statement “It does not make sense to expend efforts on marginal or poor data and it is a waste of funding agency and taxpayer dollars. The rejected data are set aside and not archived.” Baloney. Marginal and poor data can often be critical when it involves discoveries that cannot be achieved with the good data. Just because Jacoby thinks the data is poor for his study does not imply the data is poor for some other study. Since the money has been expended in collecting the data, it should be archived.
Jacoby goes on to say: “As we progress through the years from one computer medium to another, the unused data may be neglected” Yes and this is exactly why the data should be archived.
Frankly, I don’t understand why data archiving is such an issue in climatology.
–Pete
#19 bernie, i like your drug analogy.
furthermore, let’s say a new cardiac surgical procedure is developed, and tried on, say, 36 patients. poor outcomes occur in 26 of 36 patients. these are excluded, and the surgeon becomes famous for his technique, which worked in all 10 of 10 patients who were included in the study. just think of the grant money he could get!
Obviously mining promoters would like to report only good drill holes, but you have to report the bad and the good. Watchers of speculative companies also know that when results are slow, they are never because of good results. Good results are rushed out, while promoters tend to delay bad results as long as possible within the regulations in the hope that some subsequent drilling brings in some good news. The wisest policy and the most honest policy is to release the results according to a regular schedule and let the chips fall where they may.
Lonnie Thompson’s Bona-Churchill ice core is now 4 years after drilling and still no word. My prediction is that dO18 levels in the 20th century will not be higher than 19th century drill results (it’s an easy guess since that’s what happened at nearby Mount Logan). Had Bona-Churchill had a big increase in 20th century dO18, I’m sure that Thompson would have figured out how to get the results into play in time for AR4.
If you deal in mining speculations, you learn a little about how “professionals” handle data.
#26. Pete, there’s a perfectly clear policy applicable to U.S. climate change research which I excerpted in one of the earliest posts on this site here. The problem is that NSF, the funding agency, does not require compliance with the policy. I place as much blame on NSF as I do on the scientists. Given that NSF is itself non-compliant and it’s black-and-white that they are not enforcing data archiving policies, I’m surprised that someone hasn’t taken up this issue. It’s not a matter of requiring new rules or policies. The existing rules are adequate. It’s just that NSF doesn’t enforce them.
It just seems so odd, first looking at data, and then determining your exclusion criteria, based solely upon that data.
I can just imagine the R2s I could get if I got to exclude outliers in bunches. Everything would be sooo linear. This is really too funny when I begin to think about it.
I still think alot of the secrecy / resistance to clarifying data and techniques is tied to patents of methodologies held by members of “The Team”.
#26 pete
“Frankly, I don’t understand why data archiving is such an issue in climatology.”
Then you need to visit this blog more often. Its patently obvious why many climatologists don’t archive all their raw data and why people like Mann put data they don’t want others to see in folders labelled CENSORED. It’s because they know if they don’t archive all their data then their analyses can not be fully reproduced and their all too often funding inspired conclusions refuted as a consequence.
From what I’ve read on this blog in virtually all the cases where Steve has been able to obtain data and reproduce the original analysis he has shown that the conclusions of the author(s) are not supported by the data. This is the very basis of good science i.e. application of the scientific method. If you don’t apply the scientific method or use non-falsifiable methods (e.g. climate modelling) then you are practicing bad science, IMO very bad science.
I’m pretty much convinced now after all the evidence that Steve has uncovered that those who refuse to make their data available for audit have something to hide, particularly the ‘Wizard of East Anglia’, Phil Jones the real ‘denier’ (of UHI polluted instrument temperature data).
KevinUK
I can just imagine saying to a financial auditor, “you can’t access that file of inventory or expense or payroll data” or “we seemed to have lost that file” or “the computer corrupted the data.” It really is unimaginable that anyone would pull this kind of stuff.
Bernie said:
Or “someone needs to use that file for the next couple of years” !!
The rules for auditors are clear for this type of issue. The accounts will be qualified on grounds of inadequate record keeping.
Patents and patent applications are public documents. They are available from any number public websites at not charge. The US Patent Office web site is — http://www.uspto.gov/patft –.
Patents are fully public unless classified for national security. Patent applications are held secret for 18 months from their first filing and then “laid open” that is made available to the public. An applicant can request that their application be kept secret until patent issuance but on issuance it is a public document.
Only one US patent relates to dendochronology. This is US patent 4,373,393 Method for determining the age or authenticity of timber structures with inventor Herman Heikkenen. It has only one claim
This patent has expired.
There is a German application — Method for measurement of density or dielectric properties of non-conducting material by use of high frequency electromagnetic waves, especially for wood density measurements required for dendrochronology, etc. with inventors Schincker and Speiker.
fFreddy, yes I think that there should be discipline wide standards on archiving which include all of the necessary netadata.
Steve writes in #29
Thanks for the link. I was not familiar with NSF data archiving policies, but they look very similar to NASA’s and quite reasonable. Does NSF provide funding for the archive process and/or the archives themselves? For example, HEASARC is supported by NASA and the Smithsonian. Presumably HEASARC justifies its existence based on papers acknowledging the archive.
At the risk of belabouring the obvious, JMS, you badly need an irony transplant. The White Spruce threads have brought about an eruption of complaints from those informed dendrochronologists (and it may be added, the plainly ignorant such as yourself) about how those WS are not temperature proxies and how it is misleading to show them as such. None, get that, none, have yet been able to utter even the most timid squeak of protest against the use of acknowledged non-temperature proxies by any of the AGW theory protagonists. Why they are all such lions when attacking Steve, and such mice in other circusmtances I don’t know.
You have yourself fallen into exactly the same hole have you not ? Non temperature proxies should not be used in temperature reconstructions, your exact position, no ? Now, criticise Mann, Bradley, Hughes, Jacoby, Crowley for the same conduct. Or do you need honesty and courage transplants as well ? Mind you, you might need a grant transplant if you do…
Is this a picture of a Qilianshan juniper? I suggest you Steve should re-examine it. This picture (a tree growing in in the desert) is just a picture!! In my impression, there is no desert in Dulan region of China at all. However, you cieted this picture as evidence of tree ring in Qilianshan responds to precipitation. I am somewhat confusing. I suggest Steve should contact Prof. Shao to ask where she get this picture. It is clear what you cited is a defiance to Chinsese Scientists! I am strongly objected it.
Re #41
Good Question.
Also, note 2nd last slide of this presentation:
Doesn’t seem to get much more honest than that: potential species.
The picture is in the last slide of a presentation by Shao et al entitled A Dendroclimatic Study of Qilian Juniper in the northeast Qinghai-Xizang (Tibet) Plateau” online here as I stated in my post. I think that a reader is entitled to presume that the picture is of a Qilian juniper. Other pictures in the presentation show rocky groundas well, so I presume that there is a variety of terrain.
Shao et al said that these trees are precipitation limited and I did not criticize their position; this seems very likely. I criticized the use of these proxies as temperature proxies in Crowley and Lowery 2000 for example and the failure of dendro scientists to correct this.
Thank you for your explanation. Sorry for my strong response. My another question is even if this tree is gronwoing in this desert, it should be responding to levels of underground water rather than precipitation or temperature alone.
!?
Only members of the wisdom circle are “entitled to presume”!
Kidding. No need to presume when we have a truth squad with the authority to audit.
Re: #41
Is this an attempt at humor or do you really mean it? Either way thanks for the laughs it provided.
Ken, please cut the guy some slack … it’s an odds on bet that the person who wrote that does not speak English as a first language. His meaning is clear. He feels that the post is insulting to Chinese scientists, and he objects to that.
w.
Re: #47
I am Chinese. I speak Chinese language as the first language. But I am sure that Science is serious but not rude. TI repeat the tree in the desert that was by the wisdom circle was cited as evidence of tree ring in Qilianshan responds to precipitation is definitely wrong. It is very strange these guys who have not been to these Qilian Shan have the priviledge to assume that “is entitled to presume that the picture is of a Qilian juniper. Other pictures in the presentation show rocky groundas well, so I presume that there is a variety of terrain”. I repeat if you want to discuss it in depth, you should go to these areas to do some investigations firstly, not just say nonsense. In dulan region, there is no desert definitely. You are wrong!! Now I understand why Rob decided not to respond to the wisdom circle —–Willis Eschenbach. You are so offensive. You should learn from Steve. He is polite. Therefore this reply is only to Steve, not you.
re 48:
Not many paleoclimate studies are based on original field work.
Re 49:
Yes, it would be better when you critize some scientists’ work.
twq:
In this blog the ‘scientists’ are criticised that don’t adhere to the scientific method.
Paleoclimate studies consist of three ingredients: the data, the method, the results. If any of these three mandatory ingredients is omitted then it isn’t scientific, then it is “trust me, I’m a doctor”. Furthermore: in my undergraduate geology class I learned that the basis of a geological map is a “fact map” on which all observations are carefully plotted. Being geoscience I expect such standards with paleoclimatology as well. But guess what, you are very lucky if a sample site is reported to the nearest degree. I have never come across a map with individual trees. That is what I call sloppy science, I am certain you adhere to these standards, this blog is about the ‘scientists’ that don’t.
twq, thank you for your post. Clearly, you have not understood my post. I was asking Ken to be more polite to you, which in English is sometimes described as “cut him some slack”. An “odds on bet” means I thought it was likely that English was not your first language. Having explained why your post was confusing, I tried to make your meaning clear, which was that you objected to what you saw as an insult to Chinese scientists.
Because of that misunderstanding, your accusation that I am “offensive” is entirely incorrect. And as a result of your misunderstanding of what I said, you are being very rude to me … you see how easily it happens? I ask someone to be nice to you, and in return, you are rude to me … we all need to be more understanding of each other here.
Finally, you may not understand the meaning of the word “desert”, because you say “In Dulan region, there is no desert definitely. You are wrong!!”. Respectfully, I must disagree.
The Qaidam region, which is in the Qilan Shan Mountains of Dulan, is a desert. The World Wildlife Fund says:
In addition to the Qaidam Desert, the Qilian Shan mountains also have parts which are desert. The Qilian Shan Mountains form the southern border of the Gobi Desert, and are very arid (extremely dry) where they adjoin the Gobi Desert. Here is a satellite photo of the Qilian Shan mountains:
As you can see from the photo, while parts of the Qilian Shan mountains are green with plants, the north slope of the mountains, as well as many other parts of the mountains, are clearly desert. The lake in the center is called Koko Nor, and the Qaidam Desert is the large barren area just below the center left of the photograph, about 400 km west of Koko Nor. Qaidam Desert is enclosed on three sides by the western end of the Qilan Shan mountains. The Qilan Shan mountains in that region are also very dry and desert-like.
I assure you that it is not my intention to be impolite to you in any way.
w.
PS (which means “post script”, or something added at the end of the message) – It is possible that you have not heard about the Qaidam Desert because it is the centre of a very controversial resettlement project.
In any case, it is quite clear that there are in fact deserts in Dulan. So should I say “You are wrong!!!”? No, that would be impolite. I have made many mistakes, and I hope I have become more tolerant of other’s mistakes. As I said above, it is important that everyone, including you and I, become more polite and more professional in our interchanges.
My very best wishes to you,
w.
Willis Eschenbach,
It still has misunserstanding between us. Yes, it is right that there is a big desert in Qaidom Basin, which is very low in this region. However, there is no desert in the Dulan region, where these tree samples were collected at the heights of 3100 m. I have been to this region several times and I did not find the desert, although I know there is desert in Qaidam Basin, where one of 8 biggest deserts is located. You must understand that we discuss the |the tree in the desert|, not the tree in the mountains of the Dulan region. I bet, there is no trees in the desert of Qaidam Desert. My colleagues have consulted Prof. Shao, and She said the tree in the Desert that Steve cited is no existant at all and it is just a picture. I guess that someone draw the tree in the desert, and not real condition.
Willis Eschenbach,
I forgot to say
My best wishes to you!
Another question:
This is a picture of a Qilianshan juniper. Are you sure it is a Qilian Shan Juniper. In my knowledge, it should be a poplar along river sides in the Hexi region. It seems that the Qilianshan juniper is not appropriate to grow in desert.
This is a description of sampling heights in Qilianshan (in the 5th slide of Shao’s), You can see the heights (3600-3900 m) are far above the Qaidam Basin.
twq, thank you kindly for the information. I think we may still be struggling with problems of definition.
The common definition of a “desert” is an area that receives less than 25 cm (10″) of rain per year. It is defined by rainfall, not the presence or absence of sand dunes.
The four nearest meteorological stations to the trees are Wulan, Dulan, Delingha, and Chaka. They have annual rainfalls of 18, 18.8, 15.8, and 21 cm of rain annually. A spot at 37E, 98N, in the center of the region, is said by Shao et al. to get 22.5 cm annually. So clearly, the entire region is a desert.
I believe that you are correct that the photo of the lone tree at the top of this thread is not a tree which was sampled for the study. However, that is a side issue. The main question that Steve M. raises is, are the juniper trees in the region precipitation proxies (as reported by the Chinese scientists listed above), or are they temperature proxies (as claimed by Western scientists such as Crowley and Lowery 2000; Mann and Jones 2003; Moberg et al 2005; Osborn and Briffa 2006; and Hegerl et al 2006).
Me, I think that the Chinese scientists have it right, they are precipitation proxies … I would be happy to see a dendrochronologist prove me wrong, however, and invite their comments.
Best wishes,
w.
While reading through the Shao et al. presentation, I noted that some trees in the region are shown to have a negative correlation with high temperatures in Delingha in April – June, but they have a positive correlation with both the preceding and following September and October temperatures.
This led me to wondering how one would control for the inherent correlation (negative or positive) between the temperatures themselves. For example, both the April and May Delingha temperatures are negatively correlated with the following September temperatures (about -0.2 in both cases). In addition, the April temperatures are negatively correlated with the preceding October temperatures (about – 0.32).
Thus, if a random dataset is positively correlated with April temperatures, it is likely to be negatively correlated with the preceding October and following September temperatures … which is exactly what we see in the Delingha tree-ring/temperature correlations.
Is this corrected for in the calculations of correlation, and if so, how? Any answers gladly accepted.
w.
PS – It doesn’t stop there. October temperatures are correlated with the previous October temperatures in the Delingha temperature database (GISS version). Since the tree-ring widths are positively correlated with both the previous and following October temperatures … how can we tell which one they are actually correlated with?
Like I said … all answers welcome.
Willis Eschenbach, thank you for your information. I mean there is description errors in this sentense in the first part of this thread, that is “This is a picture of a Qilianshan juniper. Qilianshan junipers are (unsurprisingly) said to be limited by precipitation. However, Qilianshan juniper chronologies are directly used as temperature proxies in Crowley and Lowery 2000 and Yang et al 2002, with the Yang composite being used as a proxy in many Hockey Team studies: Mann and Jones 2003, Moberg et al 2005, Osborn and Briffa 2006, Hegerl et al 2006. “. It is clear that steve used this description to support his assumption that the tree ring width in Qilian Shan is an indicator of precipitation change. Now we are consistent with the defination of desert.
Steve listed the blow reference as evidence. I suggested that you should re-visit this paper. In this paper, the authors clearly suggested that the ring width reflect temperature on low-frequency domain and is indicative of precipitation change in high-frequency variations. Therefore it is difficult to say the ring width should represent temperature or precipitation changes at this stage. My understanding is that the Qilianshan ring widths can indicate annual precipitation change, but represent temperature change on decadal or centennial scales, although the mechanism is not clear at present. The puzzle waits for further investigation. In other words, it is arbitrary or rigid to say it should be temperature or precipitation. On the other hand, we should note that in this region, the correlation between temperature and precipitation varies in different months, with positive and negative correlation coefficients. Furthermore, the ring width is correlative to both temperature and precipitation. So we must be careful to attribute the ring width to a response to temperature or precipitation presently.
Last but not least, my experience tell me that Geoscience is not physics or mathematics, and it has uncertainties in many aspects definitely. of course, Dendrochronology like other disciplines, needs further development.
Best wishes,
Twq
LIU Yu , AN Zhisheng , MA Haizhou , CAI Qiufang , LIU Zhengyu , John K. Kutzbach , SHI Jiangfeng , SONG Huiming , SUN Junyan , YI Liang , LI Qiang , YANG Yinke , WANG Lei , 2006. Precipitation variation in the northeastern Tibetan Plateau recorded by the tree rings since 850 AD and its relevance to the Northern Hemisphere temperature Science in China Series D: Earth Sciences
#55. twq, thank you for your thoughtful participation here. You ask about the picture in question: “Are you sure it is a Qilian Shan Juniper?” Put that way, all that I am sure if is that it is the closing slide in a presentation on Qilianshan junipers. So I have re-labeledl the caption and edited the commentary to specify that. Please note that I had already also provided another picture of the mountain form which presumably the Qilian junipers were sampled, but have moved this picture into a more prominent position and added commentary to ensure that readers recognize that this represents the sampling locale. Please advise me if you continue to have reservations with the revised text.
The greater issue is whether Qilianshan junipers are a temperature or precipitation proxy, which I will comment on later today. You say:
Any paper prior to Liu et al 2006 indicated categorically that Qilianshan junipers responded to precipitation. Research into speculation that the Qilianshan junipers respond on a high-frequency basis to precipitation and on a low-frequency basis to temperature is interesting, but, until such a hypothesis is established, I do not think that such proxies should be used in temperature reconstructions.
Regards, Steve Mc
To Steve,
Since ring widths correlate both temperature and precipitation and there is no mechanism to explain till now, why you are so desireble to attribute the ring width signal to precipitation change? The below is another example, showing on the northeastern Tibetan Plateau ring widths reflect temperature change. Please read it.
best wishes to you!
Rapid tree growth with respect to the last 400 years in response to climate warming, northeastern Tibetan Plateau (p n/a)
Xiaohua Gou, Fahu Chen, Gordon Jacoby, Edward Cook, Meixue Yang, Jianfeng Peng, Yong Zhang
Published Online: 25 Jan 2007
DOI: 10.1002/joc.1480
Abstract | References | Full Text: PDF (Size: 244K)
To Steve,
Since you admit the last slide in Shao’s presentation is not correlative to her topic, why do you still list it as a first picture in this thread. I suggest that you should delete it so as not to cause any misunderstanding for CA readers. If you still put in here, it is expected that some CA readers would think it to be a good example for ring width/precipitation correlation in the Qilianshan region. Also why do you write ‘Obviously, it is strong evidence of precipitation deficit in the area’? You mean the tree in the desert should still be regarded as evidence for Qilianshan tree ring widths? I am confusing about it.
Regards,
Twq
(Update: A Chinese reader has written to say that this picture is not itself a Qilianshan juniper, although it is the closing slide of a presentation on Qilianshan juniper. Obviously, it is strong evidence of precipitation deficit in the area.) The picture below is an earlier slide in the presentation and undoubtedly represents an actual sampling site, which, while not as splendid a picture as the tree in the desert, nonetheless evidences precipitation limitation.
Re: #52
My laughing was a more general reaction to the side tracking that seems to appear even when experts/specialists are posting here. Now that we are down to the nitty gritty of previously thought to be exclusively precipitation proxies holding a temperature signal, albeit at a different frequency, I laugh no more. This has become a discussion one can get ones teeth into and enjoy some chewing of solid food.
I’ve caught up to your recent post in which you say:
I’ll make allowance for language barriers here, but I am genuinely puzzled by your claim that the tree in the desert is not “existant at all” and is just a picture. It certainly looks like the tree is real and not a mirage or a drawing. What’s it doing in a scientific presentation?
Maybe cottonwoods in Western China have strange forms, but that tree does not look like any cottonwood (or other poplar / aspen type) I’ve evern seen in either the Americas, Asia or Europe. If anything, it reminds me of a tamarisk or mesquite, FWIW ….
Steve, Yes, there is a tree in Desert. For example, there are tamarisks in Taklimakan Desert or other desert. But wthat you cited is very strange in Dulan region. All the tree samples are collected at the heights 3600-3900m, where no desert exists.
PS – A final question.
Tree ring width is significantly correlated with Delingha temperatures from the previous December. December averages a chilly -9.5°C in Delinga, with a standard deviation of only 2°C. The trees are about 700 metres higher than the meteorological station. Using the rule of thumb of 1°C drop per 100m of elevation, at the trees’ location this would be about -16°C or so … what is going on physiologically with a tree at -16°C in December where a change of a couple of degrees makes a change in tree ring width the following year?
w.
re: #67
I suspect, as I suspect you suspect, that the answer is nothing. Instead, some common factor affects December temperatures and tree ring width the following year. It might be nothing more than the prevailing wind direction which might either bring colder dry air from the north or warmer moist air from the south which would produce a better growing season. And the wind direction might simply be caused by one of the ocean oscillations we’ve discussed here. Since the oscillations are typically decadal or more, that would align with the statement that it’s low frequency trends which are correlated with temperature.
To: A final question
I suggest you consult Fritts HC (1976) and Kimmins (1987), and many papers. It is easier to understand for dendrochronologists. Here I’d like to add some sentences (Gou et al. 2007). For the Tibetan Plateau with a special terrain, if the previous winter temperature is very low, the annually frozen soil layer could be thicker and the thawing time could be delayed in the coming spring. Thus tree growth would be negatively affected adn the tree-ring width of the year after a cold winter could be narrower. Therefore the correlation between tree ring width and winter temperature is reasonable, based on inferences from known physiological processes. For more thoughtful discussion see the below referneces. This is also my final reply.
Kimmins J P. Forest Ecology. New York: Macmillan Publishing
Company, 1987. 1~531
Fritts H C. Tree ring and climate. London: Academic Press,
1976. 1~567
So if that image is a fake/photoshop job, how real are any of the other pictures in the slideshow?
And why is there a fake image of something that is not a Qilian Juniper inserted into a presentation on Qilian Junipers?
The abstract from the twq reference here shows some very high correlations of tree ring growth with local annual precipitation and NH temperatures with a 40 year moving average. I could not find the English version of the paper but these claims are certainly material for further analysis.
anonymous writes in #7 at http://www.climateaudit.org/?p=1304#comment-100568 WRT to this thread:
This implies, if I understand it correctly, that the work of those named at the top of this thread (i.e., those who do use the Qilianshan juniper chronologies) is less-respected by those in the know. If so, what does that say about the IPCC and the scientific journals that publish and promote their work? And, what does that say about those in the know who don’t publicly criticize those authors and their work?
Dr. Anon. put up a very thought-provoking informative post, but I find the excuses for not engaging kinda weak. Of course there are some un-PC posters around here, but not as many as most blogs. That doesn’t stop a truly competitive scientist, who would just tell such people to take a hike. And I wish he/she had identified some of the recent work that surpasses previous work.
The tree picture–it looks very juniper-like to me, but I’m suspicious of it because of the lack of shadows on that sand.
The picture definitely looks doctored. Use print preview and increase the scale. Lots of pixalation around the tree.
Ken F, thanks for your post. You say:
Correlation increases with the filter width of the moving average. The question is not how high the correlation is. It is whether the correlation is significant. To determine this, you must first adjust for autocorrelation. I use the method of Quenouille for this. This reduces the number of data points as follows
Correlations with proper significance calculations, including adjustment for autocorrelation, are meaningless. The correlations in the reference may be significant, but we have no way of knowing that, so the claims are not supported.
w.
Re: #76
Willis E, I am merely the messenger here and wanted to hopefully pique the interest of posters here like yourself, and Steve M, to look further into this paper as it makes some substantial claims and counter perhaps to what Steve M had concluded about these proxies. Since you mediated previously with this party on my behalf I thought perhaps you could do it again. Evidently twq thinks you can use the practice, but that surely is because he does not know you as well as I do.
John Baltutis said:
This is indeed the part I find astounding. I can understand if one paper got through peer review that used trees that are not temperature proxies in a temperature reconstruction. Such a thing could happen in any field. But surely in any credible scientific field a simple correction sent to the journal by a knowledgeable expert would point out the study is using data that does not even claim to be a temperature proxy. At that point presumably any further papers that tried the same stunt wouldn’t pass peer review.
Instead we see this long list of papers published over years doing the same thing. It gets published in IPCC reports and plastered in my kids’ classrooms and no one says a thing. And now after Steve throws down the gauntlet in an open challenge to their credibility we get an anonymous commenter pointing out in the most cryptic way possible that his basic criticism is correct?
Dendroclimatoligists certainly have some work to do to regain their credibility from my point of view.
The field dendroclimatologists are highly credible. They’re the ones who can tell you before you even sample a tree what kind of a signal you’re going to get out of it. It’s the computer geeks who’ve never seen the sampled trees that you need to worry about. As long as the two camps work in close collaboration, you get synergy. Otherwise, a house of cards can be the result.
Here are some quotes from the Kexue Tongbao 1983 paper cited by Crowley and Lowery 2000:
Only four Qilianshan junipers were cored – 3 at the south-facing upper border (Altitudes 3670-3900 m) and one at the north-facing lower border. (Imagine – altitude , lat and long of individual trees actually provided.) They calculated a mean index of the 3 upper limit trees which has a peak in the first part of the 20th century and subsequent decline. They comment as follows:
“In 1816-1923 there was a very warm period. Then in 1924, a new cold period was formed. …Since the 1950s the climate in the whole world has been turning cold. This can also be clearly seen from the change of tree rings. Nevertheless the cold started in 1924…
There exists a close relationship between glacial advance and recession and the climate. Observed data during the past few years whows that the elevation of glacial snowline at Qilianshan has generally fallen, the glacier mass balance has turned positive and a few glaciers are advancing. This is the reflection of the stages of cold since the 1920s and the presage of a general advance of glaciers.”
#75
I’m not so sure. All detailed areas of that photo are highly pixelated.
#74
I think there is a sand dune in the foreground and the shadow would be climbing up to the top of that, and we can see the shadow emerging at the top of the dune. I think I can also make out a long gunman in the tree 😉
Haha, although it is a definitely wrong juniper picture in Qilianshan, the figures of wisdom circles who think they are entitled to still have no intention to correct it. Are you indeed climate auditor with a truth squad with the authority to audit? It is my sincere hope that you stop to convey this wrong information to common people. Otherwise you will continue to make bad impressions or reputations that people will have to dendrochronologists. Thank you!
twq, thank you for your answer to my question above. I appreciate your taking the time to explain it to me.
My best to you,
w.
Maybe the picture shows just an exceptional tree (and a certainly precipitation-limited) from that region and was chosen because of its aesthetical quality for the thankyou slide.
#82 twq:
Your belligerence is improving with your English. May I suggest that you get yourself a grammar checker? Who knows? Maybe you’ll fool somebody into believing that you’re just some jerk writing under an assumed identity.
How can an outsider seriously expect a cultural shift in the field of dendrochronology toward more openess if practitioners won’t even speak out under their own identity?
#84 EW:
I agree with you.
#82. I had previously re-labeled the caption to explicitly say that the picture is the last slide in the presentation by Shao et al about Qilianshan junipers as in the paragraph beelow. I’ve presumed that the picture comes from Qilianshan given its position in the presentation, but have noted that this might not be the case and that a poster has raised an issue has been raised about the picture itself.
twq said above that Shao et al used a fictitious picture:
I find that very strange. twq may well be right that someone “drew” the picture in the desert and the picture in Shao et al is fictitious. If so, it would certainly be an interesting story all in itself. I’m not prepared to assume that Shao et al used a ficititious picture just because someone said over the internet and it is surely not my responsiblity to tracel to Dulan to validate the authenticity of pictures used in scientific presentations.
Having said that, I requested contact particulars for Shao from twq who had emailed me a Chinese language publication presumably about the area. Unfortunately, I don’t know Chinese and the article, however meritorious, doesn’t helo me very much. I asked twq:
I asked him for contact particulars so that I could obtain some explanation from Shao directly and to find out exactly what the picture was, whether it wsa “drawn” as twq alleges. twq said that he had contact particulars for Shao; I requested them from him and he has not responded. This is a matter of only a day or two. I intend to find out whether Shao used a fictitious picture.
Regardless of whether Shao et al used a fictitious picture or not, available specialist literature up to fall 2006 said that these were precipitation proxies, something that seems evident from any of the pictures, including pictures of the rockier mountain terrain above the valley floors.
I have already sent a mail to Dr Xuemei Shao who seems to have taken all the pictures in the report so presumably also the last one and I asked about the location .
I do not believe that this picture is fictious even if it definitely doesn’t look like a Juniper .
It is obviously an irrelevant detail to have the information but I find it amusing to find out .
#88. It is, as you say, amusing. Now that our attention is focussed on the matter, my guess is that it will prove to be a tree from the Qilianshan area, with aesthetic value. I think that the tree illustrates that the area is dry, consistent with the repeated statements in specialist literature that Dulan junipers are precipitation proxies. Given that dendroclimatologists attending here have been quick to observe that Meko’s northern Alberta spruce are supposedly precipitation proxies, I think that it remains reasonable to surmise that there is no evidence that Dulan juipers are less vulnerable to the criticism of being precipitation proxies and dendroclimatologists don’t seem to have taken up this particular cudgel.
For what it’s worth, junipers in the U.S. are also said to be precipitaiton proxies, which is why I looked at this proxy in the first place.
True. As I remember, they only grow naturally in very arid areas, with the exception of Juniperus Virginiana (eastern red-cedar).
Re: 89,
what you said is very interesing. Is it indeed an amusing works with aesthetic value? If so, why you cite it as evidence in the first place? I am disappointed with your altitudes. We should be serious in Science, especially as you alleged as so-called climate-audit.
#91. mmany pictures have both aesthetic and scientific value. Even though the picture was “pretty”, it was in a scientific presentation and it was reasonable to assume that a picture in a presentation about Qilianshan junipers pertained to that presentation and was not a picture of a tree from Paris, France or some other unrelated location or a drawn picture. If it were a palm tree in front of the ocean, it would be obvious on its face that it was just a pretty picture, but that’s not the case here. My guess is that picture is from the Dulan area. If, upon investigation, we determine that Shao et al used an unrelated picture, then so be it. I’ll report whatever we determine from Shao. But again, this investigation while amusing, is irrelevant to the issue of whether they are precipitation proxies.
RE: #90 – One of my geological mapping sites in North Central Los Angeles county, was on uplands which are transitional between the Transverse Ranges’ crest and the Mojave. Junipers there were shrub form, intermingled with sage scrub, yucca and Prickly Pear. Even within the mapping area, as one walked north (e.g. lower elevation, in the direction of the Western Mojave proper) the Junipers yielded to the Prickly Pear, and other cactus such as barrel cacti.
Re: #91
Twq, please forgive the Wisdom Circles for indulging in a sporadic show of good natured humor and even the occasional twitting as they can be distractions from serious science as you imply. Now, could you also please continue with the challenge (I think to Steve M) that these claimed precipitation proxies have a temperature signal.
Some dendroclimatologists coming to the Wisdom Circles complain about distractions and distract from the science.
re: #92 etc.
Since you didn’t bring it up, I seem to recall at the time the first discussion was going on about this tree, someone had a picture of the tree from another angle showing that there was a ravine or whatever leading up or down to the tree. I.e. this wasn’t a tree totally isolated from other vegetation but one at the edge of a watered area. Sort of like the Pyramids. You always see the pictures of them pointing to the desert, but if you’re there there’s a built-up urban area right up to where they are. And of course, lots of tourist traps in the square behind where you rent camels, etc.
1. RE: But again, this investigation while amusing, is irrelevant to the issue of whether they are precipitation proxies.
really? If so, why don’t you attach one tree along the seaside?
2. Re:I’m not prepared to assume that Shao et al used a ficititious picture just because someone said over the internet and it is surely not my responsiblity to tracel to Dulan to validate the authenticity of pictures used in scientific presentations.
Since you have no responsibility to travel to Dulan to validate the atuhenticity of pictures, why you have responsibility to display this unrelated picture to you but important to CA readers? It is strange.
twq, good to hear from you again. It seems to me you’re asking the wrong question. You think the question is, why did Steve include the picture in this thread? The real question is, why did Dr. Shao include the picture in her presentation? Since you are in touch with her, perhaps you could ask her:
1. Where was the picture taken?
2. Why was it included in the scientific presentation?
At present, we are operating without facts in this discussion. You are in the best position to provide those facts. Until you do so, we cannot conclude anything about whether it was appropriate for Steve M. to include the photo here.
I look forward to your answers,
w.
I asked tvq to contact Dr Shao and provide this information. Since he has not done so, I have sent the following email to Dr Shao:
Thanks, Steve M, the world awaits …
w.
A CA reader forwarded the following communication from Dr Shao:
I’ve sent a second email to Dr Shao asking:
I must say that it’s very strange for a scientific presentation to use pictures which are irrelevant to the presentation. But it’s climate science, so anything goes I guess. Perhaps she could use the picture below in her next presentation on Qilianshan junipers.
In any even, I’ve re-stated the post to reflect the additional information – interested parties please take note.
Now everything seems is clear. Now I don’t want to say “you are wrong”. I’d like to repeat what I have wanted to express. You must remember that the Geoscience is a very special science, and it is not like Physics and Mathematics. It is a discipline that needs scientists to make investigations by themselves. Only in this way can you have right to say something. I hope you should act as what you learnt,
“but, hey, it’s climate science. Here is another unrelated picture that doesn’t have anything to do with Qilianshan junipers.”
Therefore I guess that what you think “the Qilianshan ring widths correspond to precipitation” possibly wrong, because you have not been to this area. Another reason is that the correlation between ring widths and precipitation was derived based on only 50 years meteorological data, and the correlation is not necessarily the real condition.
Re 100,
You must understand it is only a closing slide. A closing slide is not meant everything for sure.
Re: But it’s climate science, so anything goes I guess.
Since you understand climate science like this, why do you have so many critical words to this discipline? It is strange .
twq, thank you as always for your contribution. It seems that you still misunderstand what this thread is about, because you say:
I, and I believe Steve M. as well, think that the Qilianshan ring widths do correspond to preciptiation, as do the Chinese scientists. The problem is that the Qilianshan junipers have been used in various studies by Western scientists as temperature proxies. That is what Steve is pointing out, that there is no evidence that they are temperature proxies.
Best wishes,
w.
twq says:
April 8th, 2007 at 2:53 pm
Re: you cherry-pick pretty well in making your arguments. One case in point – the quotes you copied from the discussion on the dendro listserv. A second case in point is the broad Project for the Dendro Truth Squad’ stone
Yes, I agree with you. Steve is definitely cherry-pick pretty in making his arguments. For example, he uses a very beutiful picture ” A tree in the desert” to strengthen his allegation of Qilianshan ring widths. Unfortunately, Through investigation, it is definitely wrong with his arguments. The tree is possibly a tree picture, not a real tree. What do you do aboutwhat what you did that caused imputation to the related scientists during the past two weeks? Why do you have the right to do these wrong things? Who will be in charge of bad effects on dendrochronology? Although the picture is changed from the first place to another place, the unrelated picture is still existant in that thread. What do you mean?
My another impression is that many erronous and unrelated statements are wrong and the arguments by Stevel go atray . as for Qilianshan chronology
the below is my response, which I put in the thread “so-called Project for the Dendro Truth Squad’
Now everything seems is clear. Now I don’t want to say “you are wrong”. I’d like to repeat what I have wanted to express. You must remember that the Geoscience is a very special science, and it is not like Physics and Mathematics. It is a discipline that needs scientists to make investigations by themselves. Only in this way can you have right to say something. I hope you should act as what you learnt,
“but, hey, it’s climate science. Here is another unrelated picture that doesn’t have anything to do with Qilianshan junipers.”
Therefore I guess that what you think “the Qilianshan ring widths correspond to precipitation” possibly wrong, because you have not been to this area. Another reason is that the correlation between ring widths and precipitation was derived based on only 50 years meteorological data, and the correlation is not necessarily the real condition.
Re 100,
You must understand it is only a closing slide. A closing slide is not meant everything for sure.
Re: But it’s climate science, so anything goes I guess.
Since you understand climate science like this, why do you have so many critical words to this discipline? It is strange .
Hi. I’m not a dendroclimatologist, just a visitor.
I’m trying to follow the conversation. It appears to me that there is a subtext understood by one party, but not the other. I don’t think anyone here is actually questioning Dr. Shao’s integrity, or even the quality of her work. Am I wrong?
The issue raised by this thread is whether or not Qilianshan junipers make good temperature proxies. Can there be a resolution to this?
Mr. TWQ indicates that they are likely not good proxies for precipitation. Is the same true for temperature?
If Qilianshan junipers are poor proxies of temperature, then it follows that the western scientists who included Qilianshan juniper tree ring series in their proxy data are likely to produce incorrect conclusions about historical temperatures. Correct?
It also follows that these scientists (excluding Dr. Shao) need to have their work critically reviewed with uncertainly about Qilianshan junipers in mind.
Am I on the right track, or am I making things worse?
The articles by Shao et al report on the reconstruction of precipitation using Qilian junipers. I cited references above. Here’s one of them: XUEMEI SHAO, ERYUAN LIANG, LEI HUANG AND LILY WANG, A 1437-year Precipitation History From Qilian Juniper in the Northeastern Qinghai-Tibetan Plateau url
I don’t know what basis twq has for claiming the Qilian junipers are not a good precipitation proxy as that is contrary to the claims of Shao et al – whose work, as you say, has not been contested here, but the use of these proxies in multiproxy studies such as Crowley and Lowery 2000.
I don’t know why you can’t understand what I said. I have clearly reported that the ring widths have significant correlation with both temperature (winter temperature and autumn temperature) and precipitation (spring) during the last 50 years. Thus, at this stage, it can be served as both temperature and precipitation proxies before its growing mechanism is observed and investigated. In other words, it is not clear if it is better for temperature and precipitation. We should note that any certain allegation for its representativity for temperature, precipitation or other indices needs further investigation. I have listed some papers in this area, in which the ring widths are used as temperature reconstruction rather than precipitation. Is it really unclear for you (steve and your supportors)? I am very confusing about your position. I repeat and suggest you should re-examine what I listed before in this thread, then we continue the next step for discussion. Otherwise, we have no basis for further discussion. On the other hand, I should have previledge for saying its representative because I have been to this study area (Qilianshan and its adjoining area) more than hurdred of times, but for you, just get knowledge from the text. I am sure that knowledge comes from practice. Except that you can report further knowledge (such as its mechanism), it is futile for me accepting your allegation.
tqw:
I don’t think that there’s as much difference between your view and most of those posting here.
Steve is querying whether it is appropriate that Qilianshan Junipers are used as a temperature proxy in Western reconstructions. Shao apparently used them as preciptitation proxies. You say they have been used as both precipitation proxies and temperature proxies in Chinese studies. In fact, the ring widths probably are some combination of precipitation and temperature, but how do you figure out the relative contribution of each, especially when very hot and very cold temperatures can both result in small ring widths?
I don’t think that anyone here is criticising the Chinese scientists. The problem is that some scientists are simply claiming series as temperature proxies without any real evidence that that is what they are. As you note this “needs further investigation”.
As you clearly work in the field, and have been to the site many times, do you have a view on the reliability of the Qilianshan Junipers as a temperature proxy?
Re #108: As you clearly work in the field, and have been to the site many times, do you have a view on the reliability of the Qilianshan Junipers as a temperature proxy?
Steve suggested that I consulted Fritts book. I have read it for twenty years, at that time what Steve was working on? In fact, I have cited Fritt’s explanations why winter temperature have effect on ring widths in the coming year. I know precipitation in the growing year have effect on growth of trees. At that stage, both temperature and precipitation have good correlations with ring widths and have respective mechanisms for explanation. However, which factor, temperature or precipitation have more effect on ring widths? It is still open. Steve, can you provide further evidence? I guess you can’t, you get your knowledge only through the published papers in English, excluding Chinese references. What Imean have been clearly expressed. Yes, it is sure that both temperature and precipitation have their possible mechanisms. But Anyone can tell which is correct at present? It is difficult to say something certain at thsi stage. My experience tell me ring widths definitely contain strong temperature signals, especially in low-frequency domain. It is no problem. Although what I said is not biased, but you suggested me to read Fritts book. Steve, Who should re-examine this book?
Another question is that do you read through Liu et al. (2006) paper? I bet you do not. Otherwise you did not list it in the first place of this thread. In this paper, it is clear that low-frequency change records temperature signals as the original authors suggested. As climate auditor, are you serious?
As evidence, I copy the sentences here again. Please note that reference ‘Fritts, 1976’.
I suggest you consult Fritts HC (1976) and Kimmins (1987), and many papers. It is easier to understand for dendrochronologists. Here I’d like to add some sentences (Gou et al. 2007). For the Tibetan Plateau with a special terrain, if the previous winter temperature is very low, the annually frozen soil layer could be thicker and the thawing time could be delayed in the coming spring. Thus tree growth would be negatively affected adn the tree-ring width of the year after a cold winter could be narrower (Fritts, 1976). Therefore the correlation between tree ring width and winter temperature is reasonable, based on inferences from known physiological processes. For more thoughtful discussion see the below referneces.
Kimmins J P. Forest Ecology. New York: Macmillan Publishing
Company, 1987. 1~531
Fritts H C. Tree ring and climate. London: Academic Press,
1976. 1~567
Gou et al., Rapid tree growth with respect to the last 400 years in response to climate warming, northeastern Tibetan Plateau. International Journal of Climatology. 2007.
LIU Yu , AN Zhisheng , MA Haizhou , CAI Qiufang , LIU Zhengyu , John K. Kutzbach , SHI Jiangfeng , SONG Huiming , SUN Junyan , YI Liang , LI Qiang , YANG Yinke , WANG Lei , 2006. Precipitation variation in the northeastern Tibetan Plateau recorded by the tree rings since 850 AD and its relevance to the Northern Hemisphere temperature Science in China Series D: Earth Sciences
dear twq
it is a little bit strange trying to follow the arguments here. You seem very upset at Steve, yet seem to be saying much the same thing as he is.
I have a big problem with what you write, because it is the antithesis of scientific research. The whole point of scientific publication is that you publish the relevant data; you don’t hide relevant and salient information. If you publish your whole (relevant) data set, you make it available so that other people can critically examine what you have done. This is how we find out that work is good (or bad).
So this is my way of saying that once you publish your data, other people can form opinions about what you have said about your data. And it is really your job to provide a full picture of your data. If a statistician (or botanist/meteorologist) comes along later, and points out that one of your assumptions/ analyses is bad, that is something they can do. It is up to you to argue the case on its merits; not merely to say, I have been there, I am right.
yours
per
twq wrote:
yes, I am getting lots of heat coming from you; but I am not sure why. It seems that you would disagree with someone who said that these trees are a pure indicator of temperature (or precipitation).
Since that appears to be the same position that most people here have, why the anger and disagreement ?
per
I’ve had a chance to look at Gou et al, Annals of Glaciology 2006 and Gou et al Int J Climatology 2007 and plan to do a post on them. Neither of them are on Dulan or other sites in the Qaidam Basin; they are new sites in the headwaters of the Yellow River in a different location. My response was on the Dulan chronologies and a paper presenting new chronologies is obviously irrelevant – other than in the sense that paleoclimatologists always seem to be “moving on”. Gou et al 2006 report a NEGATIVE relationship between temperature and ring width for 3 sites.
steve, I suggest you re-read Gou et al. 2007 paper. I don’t understand why don’t you find it? Yes, in Gou et al. 2006 paper, they reported that summer temperature a negative correlation with ring widths. However, in their 2007 paper, It is clearly there is a POSITIVE correlation between winter temperature and ring widths and this chronology was used to reconstrucition of temperature. Steve, Why don’t you report this? It is typical of cherry picking method. It is a pity! I strongly recommended these auditors keep two eys on these papers. Thus it is possible to make a fair assessment. What do you think? On the other hand, is it really irrelevant to Qilianshan chronologies? This is one reason why I recommend to have a trip to these areas. In this cold and high terrains, temperature have definitely strong effect on increment of annual rings, like Dulan and Qilianshan region. Since the Study area of Gou et al. (2006, 2007) belong to high-elevation semi-arid zone similar to the Qilianshan region (arid and semiarid region), this is why I think Qilianshan ring width reflect temperature change and not only statistically correlative to precipitation.
It is now clear that in the Tibetan Plateau, both temperature and precipitation have their respective mechanisms in the correlation with ring widths. Furthermore, in most of China including this NE TP region, at low-requency domain, temperature and precipitation is charaterized by combination of warm-wet and cold-dry. Why we must explain the Qilianshan ring widths as only temperature change or precipitation change? It is surely correct the ring widths represent temperature and precipitation signals at the same time, it is not contradictory.
From Jae, I found this English version of Liu et al. (2006). I agree with these authors’ ideas. Ring widths cleartly record low-frequency temperature change.
Precipitation and Temperature on the Northeastern Tibetan Plateau: AD 850-2002
——————————————————————————–
Reference
Liu, Y., An, Z., Ma, H., Cai, Q., Liu, Z., Kutzbach, J.K., Shi, J., Song, H., Sun, J., Yi, L., Li, Q., Yang, Y. and Wang, L. 2006. Precipitation variation in the northeastern Tibetan Plateau recorded by the tree rings since 850 AD and its relevance to the Northern Hemisphere temperature. Science in China: Series D Earth Sciences 49: 408-420.
What was done
The authors used three well-dated Sabina Przewalskii ring-width chronologies derived from a total of 77 trees growing in three locations near Dulan, China, on the northeastern Tibetan Plateau (36.0-36.3癗, 98.2-98.6癊), to reconstruct annual precipitation variations in that region over the period AD 850-2002, after which they compared the results with instrumental temperature data for the same region over the period of temporal overlap.
What was learned
Working with 10-year moving averages, the thirteen scientists found that precipitation and temperature were “significantly correlated with r = 0.85 (p
(Kendall’s Advanced Theory of Statistics, Vol 2A)
It would be better to explain the theory first, sounds too much like Cum Hoc, Ergo Propter Hoc without it. (Just a suggestion)
twq, your comments are rambling. And I don’t think it’s entirely a problem of language. I will reserve judgement until we get all of the papers you keep referring to (some not yet printed, some expensive to obtain), but … it seems to me you are trying to have it both ways. Correlation is not causation. If trees yield an integrated temperature/precipitation signal, then the reconstruction problem is a serious one, not simply a matter of inverse regression on the factor you *believe* to be most limiting, based on correlation analysis. If you correlate ring widths with many suitably random vectors you will detect weak false positives 1 in 20 times. Alternatively if you correlate 20 stations’ data with one temperature record you’re likely to get a weak false positive. Scientists need to protect themselves from false positives.
Ring width correlations with factor X do not *prove* X limits growth; they are only suggestive. Granted, if all analyses point in the same direction (upper treeline=temperature limited, below treeline=moisture limited), and the proposition fits an a priori mechanistic theory (effect of evapotranspiration on stomatal functioning, rate of cell division and cell death) then you have some basis for inferring cause and effect. But if the relationships are all over the map … and the process of reporting these relationships highly selective … then there is little basis for inference of causality, wouldn’t you say?
Night-time temperatures, winter temperatures, …, the list of variables that are hunted through seems to go on and on. Has it occurred to you that it is epistemologically dishonest to not report the number of variables that are dredged through in order to come up with these correlations? Double the number of variables that you scan and you double your likelihood of detecting false positives.
Dendroclimatologists need to do more archiving of their data, and not just the series that were selected post-hoc to yield a pre-ordained response. The Gou chronologies, for example: have the raw data been archived for public access? “Gou” and “Liu” are not in the ITRDB archive. (Although I note Q. Zhang is there.) Is there perhaps a more appropriate source for Chinese tree-ring data?
It is curious how you can agree with people here in principle that tree rings are affected by multiple variables, but then, in practice, deny this, in the overly simplistic statistical methods that you defend. It is strange. It is maybe why you ramble? You maybe have the same love-hate relationship with CA that you have with your colleagues? It is strange.
I am sorry that we are not “famous” enough company for you. You can always try the dendro lissterv. Of course, most dendros are too busy to post there thoughts there. But I am told the famous people there are listening. Funny. Listening takes more time than writing, wouldn’t you say?
re #114
twq, the “less than” operator is a special character which will trigger the end of a comment.
RE: #116,
I have clearly emphasized that correlation with temperature and precipitation have their respective mechanism. Not like what you said, Correlation is not causation. Would you please re-read all my comments?
re 116
The Correlation and Causation issue
Isn’t the issue in reconstruction about finding a measurable parameter which correlates with temperature and not proving that temperature cause tree ring widths. If, hypothetically, someone could prove that both tree ring width and temperature were caused by some combination of natural properties and that this resulted in their correlation, wouldn’t this be just as good for reconstruction purposes.
There is only 1 Chinese tree ring measurement data set archived at ITRDB plus 2 other chronologies. The measurement data set is from cin004 in Huashan; the two chronologies are chin003 from 1414 to 1986, labelled “Qilan Mts” and is located at 38 10N 100 20E at 3400 m and is on our present location map; for chin001 (Wulan) 37N 100E 3600m only an ARSTAN chronology is archived (1163 to 1986).
IMO no, but other opinions are welcome 😉 This is a clear problem of observational studies. What if the correlation applies only for a short time? What if the correlation is completely spurious? Like bender said, the list of response variables seems very large.. And in the next post we have a 40-year moving average, please save me from those ..
Uh, pass.
twq, here is where we talk about Dulan junipers.
DaleC, could you ask your graphics colleague to elaborate on why he think this picture is a fake?
UC referred to:
I have a strong sense that this is a large gulf between twq (and many others) and the CA group. We repeatedly see evidence that various AGW promoters are expending great energy to prove “reasonable” correlations, and use that to convince the statistically gullible of their stance.
I found this to be a nice, if dry, summary of the fallacy.
But there’s another explanation I appreciate much more. Unfortunately, it is cultural and perhaps will not communicate well to twq.
The Texas Sharpshooter is famous in some circles, because he’s soooo good at hitting the correlation bullseye. Only problem is, he draws the bullseye around the shots that landed in a tight cluster, and you never get to test his ability to shoot at a fresh target.
I’ll spell it out clearly to ensure language and culture don’t get in the way. Twq, it’s great to find a correlation in a data set. But you’ve learned nothing at all until you go much further:
* Apply your methods and hypothesis to different data (in this case from the same areas since you’re trying to find climate info from a specific area.) It’s not valid to throw out the data that “doesn’t fit.”
* Apply your methods to appropriate kinds of random data, to ensure your method isn’t automagically producing the interesting result.
CA has had many good conversations on these topics before, such as here. The questions I raised before have never been addressed. The more I’ve looked, the more I see work that would never pass muster in my world.
I’ve mentioned before that in the business world, we rather directly feel the pain of poor analysis. Accounts are quickly lost, stocks drop precipitously. Auditors help make sure that’s the case: invalid claims get knocked out ASAP. Sadly, too much of climate science today is distanced and insulated from the impact of bad work.
It’s very very much like the Y2K days. I’ll be glad when this is all over.
bender asked,
I never bothered checking before; I do some of this kind of work. At first I quickly passed it off as a pasteover job (see below for some of the things I saw.) Now I think it likely it’s just a low quality photo, saved for the web by “save at low resolution” software that managed to make the tree look very different due to its different level of detail. A good copy/paste job would look the same; can’t tell the difference.
What I can say with assurance is it is not an original digital photo. But that’s no big deal; we know it was saved into a screen presentation anyway!
Almost anyone can do the following ‘telling’ test. Open up (free) Picasa, click on a picture to edit, go to the ‘effects’ tab and bump up the ‘sharpen’ level all the way. An original digital photo or scan will look much different from one that has been edited, either through low res save and/or copy/paste work.
Here are two screen shots of tests I did.
First, look closely. Here’s a 200% view:
Note how blocky the tree portion is, in stark contrast to the background. Those blocks are characteristic of a low-resolution JPG file.
Then I looked using a more professional tool, NeatImage.
NI allows you to view a photo in Y/Cr/Cb space, which is best for noise analysis. The tree-based ‘blocks’ are very obvious when blown up large. The details on the tree are clearly preserved at a different resolution than details of the mountains or nearby rocks. But low res JPG saves can do this just as much as a copy/paste job.
While the Cr/Cb noise is distinctly different over the tree, I wouldn’t claim anything from that. A tree is distinctly different from sand, rocks and mountains.
(By the way, there’s a free version of NeatImage available. It’s unique in its ability to clean up digital pictures, eliminating all kinds of grain and other noise! I use the pro version for bigger projects)
That was fun, but now back to taxes 🙂
2 Trackbacks
[…] a recent post, I challenged the Dendro Truth Squad to root out use of precipitation proxies in multiproxy studies […]
[…] had some interesting discussion of the following picture of a tree in the desert which was the closing slide in a presentation by […]