(2012 Update…) CA was the first blog to discuss the recent papers by Wilmking and his associates on “positive and negative responders” – the opposite response of trees to recent warming in which – at the same site – some trees responded positively and some negatively. This is an important observation in trying to provide an explanation for the “divergence” problem – ring widths going down while temperatures go up. Previous discussions included:Wilmking in Alaska and Positive and Negative Responders. Other related posts include Upside Down Quadratic, Twisted Tree Heartrot Hill , bender on Gaspé , Survivorship Bias .
Today I’m going to report on some hot-off-the-press results from Pisaric et al in the March 2007 GRL. (Pisaric is the dendroclimatologist who commented on White Spruce updates.)
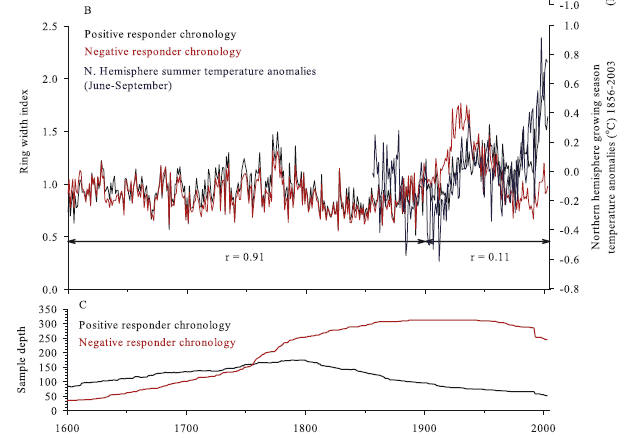
Wilmking et al 2004 had reported:
Our findings of both positive and negative growth responses to climate warming at treeline challenge the widespread assumption that arctic treeline trees grow better with warming climate. High mean temperatures in July decreased the growth of 40% of white spruce at treeline areas in Alaska, whereas warm springs enhance growth of additional 36% of trees and 24% show no significant correlation with climate.
Wilmking et al 2005 extended these findings to many of the classic northern sites:
Here we present evidence that this phenomenon is not a regional abnormality, but is operating in several dominant tree species in forests across the circumpolar North (Figure 1).
They went on to say ( a finding that went unreported in the 2nd Draft of the IPCC 4AR):
Without accounting for these opposite responses and temperature thresholds, climate reconstructions based on ring width will miscalibrate past climate .”¬⤠Our findings suggest that the observed divergent response to climate at circumpolar treeline, overlapping the warming of recent decades, could be important for a significant proportion of the circumpolar forests and their dominant tree species.
Pisaric et al studied sites at the latitudal limit in the Mackenzie Delta, Canada. Whereas Wilmking et al had observed 40% negative responders in the Brooks Range at the Alaska latitudinal limit, Pisaric et al observed no less than 75% negative responders in their study.
Analysis of white spruce tree ring series in the Mackenzie Delta region of northwestern Canada indicates two distinct growth patterns during the 20th century. Approximately 25% of the trees exhibit significant and positive relations with growing season temperatures in the Mackenzie Delta region and with Northern Hemisphere summer temperature anomalies (Table 1 and Figure 2b). The NEG [negative] chronology, characterizing 75% of the trees, shows significant inverse relations with growing season temperature during both the current and previous years (Table 1).
They observed that, if a chronology were made from Positive responders only, they could obtain a chronology that matched NH temperature:
The low frequency trends in the POS tree ring record match the Northern Hemisphere temperature anomalies remarkably well, especially from the early 1900s onwards.
Here is the figure showing the POS and NEG chronologies in Pisaric et al 2007:
If you need to be able to segregate “positive” and “negative” responders in order to produce a chronology, I have no idea how the authors would propose that reconstructions in the medieval period be done. How can one tell by looking at a past core whether it was a positive or negative responder? Having said that, the identification of these traits in modern populations makes it incumbent on practitioners to re-examine data sets used in MWP reconstructions to see if there is evidence of positive and negative responders in those data sets. (Although we do already know that Briffa is a negative responder to requests that he archive the key data sets from Yamal, the Tornetrask update and Taimyr.)
References:
Driscoll, W. W., G. C. Wiles, R. D. D’Arrigo, and M. Wilmking (2005), Divergent tree growth response to recent climatic warming, Lake Clark National Park and Preserve, Alaska, Geophys. Res. Lett., 32, L20703, doi:10.1029/2005GL024258. url
Pisaric,1 Michael F. J.,Sean K. Carey,1 Steven V. Kokelj,2 and Donald Youngblut1 , Anomalous 20th century tree growth, Mackenzie Delta, Northwest Territories, Canada GEOPHYSICAL RESEARCH LETTERS, VOL. 34, L05714, doi:10.1029/2006GL029139, 2007
Wilmking, M., R. D’Arrigo, G. C. Jacoby, and G. P. Juday (2005), Increased temperature sensitivity and divergent growth trends in circumpolar boreal forests, Geophys. Res. Lett., 32, L15715, doi:10.1029/2005GL023331
Wilmking, M., and G. P. Juday (2005), Longitudinal variation of radial growth at Alaska’ northern treeline: Recent changes and possible scenarios for the 21st century, Global Planet. Change, doi:10.1016/j.gloplacha.2004.10.017,
Wilmking, M., G. P. Juday, V. A. Barber, and H. S. Zald (2004), Recent climate warming forces contrasting growth responses of white spruce at treeline in Alaska through temperature thresholds, Global Change Biol., 10, 1724– 1736.


87 Comments
So let’s see: The positive responder response is coincident with the negative responder response from 1600 all the way through to 1900. Between 1900 and about 1940, the negative responders show a more positive response to rising early 20th century temperatures than do the positive responders. From about 1945 through to 1975, both the positive responders and the negative responders respond virtually identically to falling NH temperatures.
Finally, between ~1975-2005, the positive responders respond positively to temperature, while the negative responders go their merry way.
And it looks to me as though the negative responder line may end in an up-tick. Can it be that the next 50 years will see a positive response of the negative responders, so as to put an oscillation in their growth pattern that parallels the pattern already evident in the positive responders?
If, after 300 years of dancing in step, followed by ~75 years of growing divergence, in which the ultimately negative responders respond more positively to the “forcing” than the ultimately positive responders, by what rational argument can anyone possibly think that the latterly positive responder growth patterns are dominated by a temperature response? It looks much more like an adventitious association with temperature by cohort memebers that just happen to be in one phase of growth rather than another.
The emergent pattern looks like the braiding of two complex oscillators driven by cycles with slightly different phase structures, so that their net outputs are in phase for a while and then go out of phase. The overall patterns of growth need have little to do with changing temperature.
Steve:
I find Pisaric’s decisions as to which data to highlight difficult to understand as I assume you do. Bear with me as I think this through. Let’s assume for the moment that White Spruce are good temperature proxies. You have 100 measurements: 25 show one pattern and 75 show another. If the first statement is true, namely that WS are good temperature proxies but simply with variable error terms, then one is forced to question the accuracy of the pattern shown by the 25 proxies and need to assume that these are aberrant wrt the true signal. The open research question becomes why assume that the signal from the 25 is accurate. Does the Inuvik record, after correcting for the recent UHI effects, actually comport to this signal or the signal of the 75? Does Pisaric report the source of his temperature anomalies? Is he truly just using the NH temperature anomalies and not the local temperature signal? If so, why would he do that?
Of course if you drop the assumption about WS being good temperature proxies, then your issue of using at least WS data as part of the reconstruction of pre instrumented temperature measurements is most appropriate.
On a different tact, what would Pisaric’s figure look like if you combined the two curves. Do you get a better correlation with the temperature record corrected for UHI?
Finally, I found this while looking for Inuvik temperature data. Seasonal and Regional Variations of Pan-Arcti Surface Air Temperature
I am not sure how it was presented in the Journal of Climate, but the graphics are sufficiently colorful that the final article may look very different.
This is clearly an area of active research. The dendroclimatologists do not have an answer as to what’s going on. And neither do non-dendroclimatologists. Let’s not torture each other trying to squeeze out answers where none exist. Let’s study the problem.
How does one interpret a 0.65 correlation with NH temps, but a maximum 0.315 correlation with concurrent growing season temps? That amounts to in the post-selected positive responders!. I would guess that the 0.65 NH correlation value is inflated due to the common upward trend. No mention of autocorrelation or pre-whitening which would address this.
Do they really mean to report a significance level near 95% (p=0.061) for a correlation of R=-0.0002 for N
Re-post (not sure what happened there):
How does one interpret a 0.65 correlation with NH temps, but a maximum 0.315 correlation with concurrent local growing season temps? That amounts to
Bender:
You are of course correct, but if so then both dendroclimatologists and non-dendroclimatologists should expect very circumspect conclusions and not the somewhat misleading conclusions derivative of highlighting the 25 proxies that support what for some of us is a somewhat suspect HS anomaly profile.
bender, if you were writing the IPCC section on dendro reconstructions, we’d be in good hands. But there’s no such nuance in AR4. The SPM says:
From which they conclude:
IF they said that dendroclimatologists are good-hearted and good-intentioned souls who like the outdoors and old trees and that they working at resolving the conundrums of using tree rings to reconstruct past climate, I’d be OK with that and wouldn’t pick at scabs. But that’s not what they said. Once again, they didn’t get an objective person as lead author; the Lead Author of this section was Keith Briffa, for goodness sake.
Now when pressed on these reconstructions, the Team says – well, they don’t matter to the big issues. If that’s the case, they should simply remove the section from IPCC 4AR – something that I suggested as a reviewer if the issues didn’t matter. Of course, if they do matter, and IPCC seems to have taken that position by leaving them in, then they are fair game for being analyzed.
From the thread “Positive and Negative Responders” I got the idea that there are 3 groups of tree ring responders: 1) those that respond positively to temperature, 2) those that respond negatively to temperature and 3) those that do not respond to temperature ‘€”and are excluded from analysis.
It might be interesting to look at the overall distribution of responses. I assume that the no-responders are a small part of the overall sample ‘€” otherwise….
Overall I think this line of pursuit of an explanation for the divergence problem is going to be fun to analyze.
http://www.climateaudit.org/?p=527
Cautiously?
Look folks, a correlative model is not an overfit model. Fact: [some] treeline conifers are [somewhat] reasonable temperature proxies. It’s been proven too many times in too many places in too many species for the correlation to be random chance alone. There is no uncertainty here. So don’t waste your brain cells doubting that categorical fact. The uncertainty is in regard to the degree of accuracy of the reconstructions (which ARE based on overfit models). If temperatures are now warming to the point that precipitation is now limiting treeline conifer growth, then all it means is that better models are required to get more accurate reconstructions. This might affect reconstructed temperatures during MWP, but it is not going to change the nature of the debate over the size of A in AGW. The temperature trend may or may not be “unprecedented”. But whether it is a problem or an opportunity is a totally different question.
#2. All of this keeps coming back to the problem of the upside-down quadratic response to temperature observed by botanists.
Added to this is probably a situation where the response coefficients are probably different for each tree – so that some trees are on the right side of the quadratic and some trees are on the left side, perhaps exposure or other things affect this. Perhaps the coefficients follow some kind of distribution and you can fit some kind of complicated linear mixed effects model to the current population. bender, this is a statistical problem and the dendro folks need more horsepower than they’ve got. (BTW I suggested linear mixed effects modeling to Rob Wilson almost 3 years ago.)
I’m not sure that you’d be able to decide which side of the quadratic you’re on by the evidence of the ring width data alone. In some cases, I think that the dendro folks are being wilfully obstinate in their handling of data: Miller et al 2006 is very convincing that California temperatures in the MWP were warm, but bristlecone widths were narrow. I think that any unbiased observer would try to re-interpret this data on the presumption that narrow bristlecone ring widths in the MWP signified drought rather than cold (Lloyd and Graunmlich actually say this), but giving up the bristlecones would be a blow to the Team and they’ve now become stubborn about it.
P.S. My beef is not with you, Steve. It’s with the hounds that scare off the Browns, Salzers, Pisarics, Wilsons, and Wilmkings. How we gonna get answers from them if 10-50% of our time is spent screaming at them?
This time-delay creates annoying cross-postings. (I know it serves a valid purpose. Just pointing out one problem with it.)
Bender
Wrt to #9, I guess I see the problem as twofold: first figuring out more precise ways of using trees as temperature proxies and second, agreeing on what to calibrate them against. Pisaric for some reason chose NH Summer Temperature Anomalies. Why do that when you have local weather station? That was what I tried to say in #2 but I guess I missed the mark. The difficult is that at some point there should be someway of deciding how to calibrate the proxies.
Re #10
My hunch has always been that you are on the right track with this reasoning. That may one of the reasons for dendro silence: they realize you are right and they are scrambling madly to be the first to rescue their field. Calm before the storm. Would be quite the coup if you were to beat them at their own game, getting the answer AND publishing it before they do.
Re: #9
Bender, that reply was not really an answer to the question posed:
A correlation of 0.65 with NH temperatures says the model explains about 42% of the variation in tree ring growth by way of regionally averaged temperature changes and about 10% of the tree ring growth variation by way of variation in seasonal (and local?) temperature. It certainly poses the questions: (1) why a better fit with the NH temperature than local(?) growing season temperatures and (2) when the correlation indicates that other variables, on average, were at work in the calibration period and had significant effects compared to temperature and further that those variables are not known (or they would have been included in the model)how do we know how those “other” variables might change, on average, over time.
I like, you, would want to do everything possible to avoid the personality issues and keep hesitant experts on board in these discussion to further our information base. Contrarily, however, it has been my past experience working with scientists and engineers that the truly informed scientist/engineer who feels confident in their knowledge of the subject matter will want to explain it to others be they friendly or be they adversaries. In fact it was invariably my experience that these informed and enthusiastic people were difficult to shut up — as I learned from engaging them as members of competing businesses.
I do not like personality issues because they waste space better applied to real issues and not because I think they would scare off those who truly want to contribute to the information base. Unfortunately we too often see these hesitant experts themselves engaging in personalities and politics and avoiding the issues.
Hi all. Long time lurker, first time poster here.
I’ve been looking at this paper and the main thing that struck me (aside from the fact that
whoops…
I’ve been looking at this paper and the main thing that struck me (aside from the fact that
Alan, welcome to the site. You can’t use the “less than” symbol in your posts, it interprets it as an html tag and goes off the rails. You used to be able to wrap it in Tex and get away with it, then for a while that didn’t work.
Here’s a test $latex
Thanks Willis, here ’tis…
Hi all. Long time lurker, first time poster here.
I’ve been looking at this paper and the main thing that struck me (aside from the fact that lees than 25% of trees ‘respond’ to late 20th century warmth) is the fact that they have correlated the response to NH, not local, temperatures (thank you Michael Mann). They state that local growing season temps went up around 1.2 degrees C from 1960-2003. It bothered me that they hadn’t used those records in their main analysis so I looked them up. I found that while peak temperatures were recorded in the mid-late 90s, the temperature record from 1960-2003 did not achieve statistical significance for the growing season increase. It seems to me that a more likely explanation for the effect observed is that most the trees are indeed positive responders to temperature increase, i.e. early 20th century increase. Late 20th century temperature increases in this area aren’t significant and accordingly, most trees don’t respond
Unless there were a clear distinction between the plus and minus groups that has both statistical evidence as well as some theoretical understanding where the different sign comes from, I would probably give up this method as a source proxies. It’s just way too much uncertainty.
Things like boreholes are bad but maybe they’re not that bad, after all! 😉
Lubos:
I think the correct procedure would be to treat all the trees as a single signal source and average them out – assuming you believe that White Spruce can be a temperature proxy and that there is no a priori reason for excluding any sub set of the trees. Then recaliberate against the local UHI adjusted temperature and see what you get — it has got to be better than what is showing up now. Of course it does mean saying good bye to the presumed hockey stick – but there is no basis for caliberating the trees against that series anyway.
Well, a priori, there is no reason to exclude any subset of trees but there is no reason to include them either. Later, someone can find reasons to figure out that some trees are useful as proxies and some trees are not. Such a statement could be justified by much better statistical agreements with the past data, by theoretical arguments, or by direct “laboratory” measurements of the effect of temperature on the trees.
Especially in the last case, I wonder why no one is looking at these things in this most obvious scientific experimental way – in well-defined and controllable laboratory conditions. Just create an artificial environment with different temperatures for several copies of the same trees and see what will happen. All problems with UHI-like uncertainties would go away.
It is very likely that most trees are simply not terribly strongly correlated with temperature and they measure moisture or completely different things. By having the dogma that you must include all trees, you could just unnecessarily increase the noise. It’s plausible that one can do better with a subset chosen a priori, by non-statistical arguments. Except that any choice of a subset is of course a possible source of many new fudge factors and must be justified by very strong theoretical, experimental, or statistically significant arguments.
Well, given the reports about these proxies, the divergence, and many other things, I guess that whenever it’s done correctly, there will probably be no significant or unprecedented recent trend and no hockey stick. But there could be.
All these methods to reconstruct old temperatures have serious bugs and it is very questionable whether any of these scientifically looking approaches is already giving us better information than e.g. the chronicles and historical records in “social sciences”.
And a sampling problem. Chronologies should be taken from perhaps 50-100 trees in the same area and ring data for each tree compared year-by-year to see how individuals are distributed across the upside-down quadratic. Do certain ones stay on a side regardless of the temperature? Do some cross-over, and if so, under what temperature regimes? Criteria for sampling would be 1) that it’s likely to be place where the trees are temperature-sensitive, 2) the trees grew in similar conditions of altitude/soil/precipitation/exposure/etc., 3) they’re spatially separated to increase the likelihood of genetic diversity, 4) they’re roughly the same age. There ought to be reasonably local temperature and precipitation records as well and nutrient analysis of the soils would be good to have. With this ecological data you might begin to figure out the meaning of “positive” and “negative” responders.
#9 — Sorry Bender, you’re making an inductive argument. If a fair percentage of tree ring series can be shown to reflect local temperature, that is an invitation for research. It is not a prescription for conclusions.
Re:#11
bender, you say
Unlike in a verbal exchange, in a blog no one is forced to read/hear others’ statements. There is no obligation to even acknowledge someone else’s post. It’s a simple matter to completely ignore “the hounds” and have a perfectly civilized conversation with the rest. This happens all the time in the blogosphere (and bb software commonly even allows each user to specify a “kill file” of posters whose posts are automatically hidden from the user’s view).
If professional dendroclimatologists cannot perform this “feat”, they must be quite shrinking violets, or perhaps so close to the edge of bloodlust that any stray perceived criticism might set them off. 🙂
#25. Armand, you’re right. Most regular participants at the blog know how to do this.
However, what happens with someone like Peter Brown – and we’ve seen this before – is that when there’s a flood of comments, they pick and choose what they reply to and will generally pick the most political and/or the weakest comment to respond to and give the appearance of being responsive without engaging on more challenging questions.
I’d be interesting in discussing some issues with Peter Brown and I’d prefer to do so without online “help” from readers other than bender, who’s knowledgeable about dendro issues. If others have points that they feel are not getting articulated, please email me (if you post on Unthreaded, from past experience, that too becomes distracting.)
There is one possible explanation for the general negative response to the recent temperature rise by the trees in the high arctic that occurs to me. From Seasonal and Regional Variation of Pan-arctic Surface Air temperatures, mentioned in 2 above, May and June temperatures in the arctic have been above normal for the whole region with the exception of Scandinavia. Evergreens are succeptable to stress in the spring when the combination of warmer temperatures, especially when combined with wind, leads to water loss. The still frozen ground prevents this water from being replaced. This added stress would slow or delay the early growth of the trees. Since this growth begins in late May or even well into June near the tree line, a significant reduction in the yearly growth of trees that have an already extremely short growing season could be expected.
There could be significant variation beteen individual trees in a local area in this scenario, as the amount of water loss is variable depending on exposure. There is also a possibilty of signifacant variation of the time when water is available to different trees due to different root patterns and thaw times. The most sheltered trees which also had earliest access to replacement water would benefit from the increased temperatures. Exposed trees that had the least benefit from earlier access to water could show a significant reduction in growth.
Unfortunately this does present a serious problem for reconstructing temperature in past years. There is no guarantee that the same tree will have the same response to a warming period at different points in its life span. A fairly large number of trees must be sampled in any one area to have a high probability of having one or preferably more than one tree with a positive correlation to a temperature rise in the sample.
DougM:
What you say makes sense and raises the ante on identifying the local conditions associated with any potential proxy, not to mention calibreating using local weather data. I am not sure whether Pisaric did the latter, since Steve’s summary simply indicates the use of NH temperature.
Re 26:
Mr. McIntyre; FYI I’ve just provided a continuation of my responses to the questions that Mr. Eschenbach asked in post #13 on the other thread. I will keep any substantiative comments there since that is where you first highlighted research that I am involved in. I would ask which is the most political or weakest comments that I have responded to so far in your opinion, and which are the most challengening that I have not (please do so on that thread). As for picking and choosing, I would hope that an objective observer on this blog would realize that most of comments are simple flames and/or ad-homs, or otherwise add nothing to any sort of discussion. Many posters are simply trying to be provocative. And please be aware I have already stated that I am not a statistician, and would not be able to address any questions of your’s or others on the MBH reconstruction, which appears to be the recurrent theme. That is not trying to pick and choose your questions to answer, simply that scientists do have different areas of expertise.
Peter Brown
Re #26 again: Also please be aware that while this exercise has been interesting to me over the weekend, I will be in conferences most of this week (after Tues) and next and likely won’t have much of a chance to respond to anything during that time. Again, I would prefer any major questions to be posted to the other thread; that is another difficulty with trying to carry on any conversation on a blog, it moves along rather quickly.
#30. Peter, thanks for your visit and we’ll look forward to your return. As I noted, I’m sympathetic to the problem of an occasional visitor trying to cope with the flood of posts. In deference to you, I’ll clear a thread, where things are collected for you.
Obviously, you can do what you want as a participant at a blog. For example, even if realclimate were to allow me to post there – I’ve been blocked in the past- I’m not going to go and debate Lynn Vincentnathan and all the thread posters, regardless of what I might think of their commentary.
My suggestion, for what it’s worth, is that your time here would be best served in discussing things with me – and, even if some readers feel left out individually, that policy would probably work best for readers as a while. My concerns are mostly statistical. While the MBH paper is obviously one example, relatively little discussion on this blog in the last year has been on MBH matters, but on the broader statistical issues involved in reconstruction. I understand that you are not a statistician. However, many dendro procedures are statistical acts – even something as “simple” as making a site chronology.
So let’s see if we can find some common ground for discussion and jointly shed some light for the readership here (and ourselves) on the issues involved. As I say, I’ll set up a “private” thread and we’ll see how it goes. Cheers, Steve Mc
Bernie, re the fact that positive responder McKenzie delta trees show a closer correspondence to NA temperature rise than local temperature rise. This relationship should be expected because:
A. both rise
B. the NA rise is of smaller amplitude than the local rise.
While sheltered trees show a positve response to the local rise in temp, it is quite ridiculous to suppose they do not suffer some effects of increased water shortage in the spring. This of course reduces the expected gain in growth that would other wise occur in response to the local increase in temp.
Somebody with more knowledgd of probability and statistics than I have might be able to figure out what the theoretical reduction in temp might be for positive responders from the number of positive responders vs neutral and negative responders.
FWIW,I agree with #20:
I received this response from Bruce Bauer on my report of negative ring widths in ak053.
Mr. Brown, please don’t take offense at the remarks of a few who are provocative in their posts. No scientist enjoys their field or their individual work being criticised but that is how conclusions are reached that most can agree with. The science is not done before the reports are issued but after when others in the field have an opportunity to replicate the results thereby confirming/refuting them. Most scientists are hard working, dedicated individuals who seek to advance their fields by studying and reporting on it. Criticism or critique should not be taken as a personal affront (like it often is) but should be welcomed in the interest of finding the truth.
#29 — Peter Brown wrote: “I would hope that an objective observer on this blog would realize that most of comments are simple flames and/or ad-homs, or otherwise add nothing to any sort of discussion.”
That’s not true by any stretch.
I’m not a “climate scientist” (my engineering is of a more practical nature, in the pulp and paper industry), so my confusion with this should be obvious.
However, I don’t understand how, when one has a data source that gives contradictory information, one can justify jumping through any hoop to maintain that the source is legitimate.
re: #36 Pat,
I’m not sure if you’re right or not. But I suggest we try treating Peter’s remark in light of the subject matter of this thread and of our own suggestions. I would divide the comments on this blog, or rather some pro ante random selection of it, as negative or positive responders or as having a science signal. The question is just how is the selection to be made and how do we define the responders. If we define a positive responder as a post which contains science content relevant to the blog we can probably also divide them by whether they are also relevant to the particular thread they are in. The question is then whether those which are not positive responders need to be further divided or not. I suppose we regulars would like to divide those in the “flame / adhom” category based on whether they’re pro-Steve M or anti-Steve M. Others might have other desires. But from Peter Brown’s perspective, they’d all need to be lumped together.
Here’s where we can help illustrate some of the general points pushed on this blog. While Peter’s statement can be supported or contradicted via the simpliest metric of number positive responders vs non-positive responders, someone else might want a more detailed breakdown to decide, for instance, if the adhoms come from proSteve “species” or antiSteve “species”. Therefore, assuming Climate Audit didn’t exist as its own archive, it’d be desirable to have it archived for later use.
Just a few thoughts…
RE #13 I believe the main reason the Northern Hemisphere temperature record was plotted with the ring-width chronologies was because it is considerably longer than the Invuik/Aklavik merged temperature record (begins in 1927). Plus the lower frequency trends in the NH temperature record and the POS chronology are quite similar. Based on this, it is not surprising that the r value between these two series is so high. The chronologies were also compared with the local temperature record, and this is included in a Table. So, it’s not as if the hemispheric record is shown in the absence of any mention of the local record.
Also, I’d like to emphasise that no models were derived from the relationship between tree growth and temperature. Some of the earlier comments seem to indicate a model was developed.
RE #14 Go for it! I think the divergence issue, whether between trees within a population or between a site chronology and the temperature record, is quite fascinating. Particularly when you consider that there are many areas which show no divergence. Although the divergence issue presents uncertainty, I don’t think dendros need to start worrying about being rescued just yet.
my few cents,
don
Dear all,
i would like to strengthen the problem, that it is quite difficult to keep up wit hseveral posts runnng at quite some speed. e.g. a colleague emailed me this morning about this one, and i have been only scanning most of the replys. i will take more time to read them all in detail.
some things concerning the neg and pos responders:
after we stumbld across that fact, we tried to find an explanantion and found some type of threshold response, meaning individual trees were complacent to temperature and after temperature indices crossed soem value, growth started to either increase or decrease (GCB, 2004). rosanne d’arrigo found similar phenomenons in her TTHH site in canada. in that paper they proposed to use the “inverted U shape” function, as i recall. i dont have the paper right in front of me.
since we also asked ourselves what this divergence phenomenon means for dendroclimatic reconstrcution, we did two things: looked at other sites around the circumpolar north and found something similar (wilmking et al GRL 2005), and looked for site specific issues (wilmking and juday, global plan change ). there we found that most trees (up to 90 %) in northwestern alaska still responded positively with increasing temps, while in northcentral AK, responses were more mixed, and in northeast AK, most trees responded negatively to increasing temps. there is also a precip gradient along that transect and we hypothesized that trees in the west can still benefit from warming, since they have enough water to growth, whereas trees in the east might become more drought stressed. the new paper by pisaric et al. extends that transect further east and finds similar responses (75% neg on average there,we had in our easternmost sites about 70-80% neg).
sooooooo, once we had cored the trees, thought about it, submitted the papers, did the correction, got them accepted, we are still unclear why this is happening.
BUT WE ARE TRYING TO WORK ON IT!
it takes some time. and in my though process it is actuall helpful to scan all your replies to get some additional ideas. more later, have to run….
ok, back at the computer
some general ideas are:
the limiting factor is shifting. from temperature to moisture. this could be a completely new phenomenon due to some unprecedented environmental “stresses”.
it could also be a normal phenomenon, where a species adapts to new environmental conditions. some individuals are better suited to cope with it and survice, others do not. that might mean that ring width could be used as a proxy for temperature in a limited range of environmental conditions only. however, other factors, such as a widespread divergence of growth trends in populations of trees could be indicative of a situation where the environmental conditions e.g. change quite fast, and the result is decline or death of some parts of the population.
that might be testable, i.e. we would need to look at a similar period (MWP) to see if similar phenomena occured. problem is of course to find enough samples.
so, while we accept this phenomenon as challenging, we do not think it devalues dendroclimatology. rather, we are asking the questions: how widespread is this? how to deal with this issue? what consequences might it have? how can we make use of this phenomenon to a) learn about the ecology of trees, b) study the ecological interactions of trees with environmental parameters and incorporate this new knowledge into our scientific thinking. it is a slow process, but it is ongoing.
martin
Don #39
Whether the NH data series is longer or not strikes me as a secondary issue to the apparent calibration problem. If that can’t be resolved with the local temperature and climate data I can’t see how the amorphous HS series can help at all. Perhaps there is something I simply do not understand about the assumptions governing calibration.
I went back to Steve’s synopsis and he indicates that the local temperature data were used. It would help if as one of the authors
you could post any analysis or charts pertaining to the local climate data.
Let me just add a thank you to those of the dendro community
who have taken the time to post their comments here.
I hope you can ignore most of the noise, and enhance the
signal.
The auditers amongst us are not trying to discredit dendroclimatology as a science. What we want to know is what the hell happened to the MWP in temperature reconstructions! How is it decided that today’s temperatures are “unprecedented” if temperatures a thousand years ago are highly uncertain, (but certainly high)? If tree rings have the answer to that question, let’s go there. If it takes nonlinear models with multiple, interacting climate variables, so be it. Finally, if I were a dendroclimatologist I would want to make sure my science is not misrepresented by IPCC. What are y’all doing to make sure that isn’t the case?
as i said, we are working on it. i am sure several members of the dendro community are thinking about how to answer exactly your question. we try to do it, however, through the accepted way of peer reviewed scientific literature. that means, i am thinking about this now, start the work, write the paper,get it accepted and in an ideal case 6 month from now we can discuss the results on a new blog. we are also interested in what happened during the MWP, and i agree, if it takes upside down standing on your head while making an U , lets go for it
#49, 41. Martin, thank you for your thoughtful contributions. You say:
I’d like to point out that the articles Wilmking et al 2004, and Wilking et al 2005 were both discussed on the blog as examples of people trying to grapple with the issues of ring widths not responding to temperature. On Feb 12, 2006 here, I observed:
You mention that Rosanne D;Arrigo observed something similar at TTHH:
We cited this paper in MM2005 (EE) as follows (in fact, we had observed the phenomenon of declining TTHH ring widths even in our 2003 paper) –
I mentioned this again on the blog in Feb 2005 here
My initial discussion of Wilmking et al 2004 was as early as Feb 2005 here.
So for a blog that covers a lot of topics, I think that we’ve been attentive to your efforts.
Steve:
Do you have any idea how the IPCC TAR will address the non-linear function governing tree ring widths?
Steve, no question. i was aware of your efforts and your citations. it is also in my interest to keep the discussion and investigations going.
Re #41
Martin, respectfully: how are you going to sample the stems that did not survive the “megadrought” years? You know, the ones with the narrowest rings?
#48. Martin, I agree that it’s worthwhile to keep the discussions going. The detailed work that you and others are doing is absolutely essential to seeing what use can be made of this information. Given that I’ve been getting a LOT of criticism from dendroclimatologists lately as being unappreciative of their efforts, is it fair to say that, from your perspective at least, I made reasonable,timely and fair reports on your work.
#50 Steve, yes, i agree. it is fair to say that you did report on our work. and i am convinced that you would also report on it in the future, if we had addressed several of the problems and would come up with support for the hockey team. lets keep this as fair as possible…
#49 at least at some northern treeline sites, as well as some altitudinal treeline sites, stems are conserved standing or lying due to the either very cold or very dry conditions. thats where a lot of the dead material for chronologies comes from. i agree that in other cases, the evidence might be lost, as i stated above.
Well, maybe the negative responders _are_ responding to real regional temperature change, while the local thermometers are not, because they are located where people live?
bender,
IPCC 4AR says:
The nuance here is: exactly what is the “additional data” showing coherent behavior. Now various HOckey Team studies drawing on substantially overlapping data (bristlecones/foxtails, Yamal, etc) have somewhat similar results, but there is precious little “additional data” in these studies – as Mann says, that would require going to “remote” sites with heavy equipment.
But despite Mann, there actually is some new new data. However none of Wilmking’s articles are cited in IPCC 4AR. Why not? That’s exactly the type of article that needs to be discussed most. The issue of positive and negative responders was on the table well before the drafting of IPCC 4AR started. I’d be interested in a “consensus” view as to the implications of these articles on the reconstruction project as carried out in the canonical articles, as the impact may be quite profound.
The actual new data – Wilmking, Driscoll – obviously doesn’t shown from showing “coherent behavior across multiple indicators in various parts of the world”; jeez, it doesn’t even show coherent behavior at a single site. I don’t conclude from this that dendroclimatology should be abandoned. If anything, I’d welcome additional support for extremely detailed studies of the phenomena discussed by Wlmking and Pisaric.
#52. Lars, there are positive responders at the sites too. I think that it’s more likely that additional temperature helps to a point and then doesn’t make much difference. A lot of the correlations are levered on differences between very cold 19th century results and warmer 20th century results and are probably valid within a low-temnperature calibration, but whether they can distinguish between degrees of warmth is at issue.
I can see why. Maybe the dendros can make this a workshop topic at their next conference?
After reading this thread, I must admit my pessimism from another thread at this blog on visiting dendroclimatologists contributing to the information base here must be tempered by what I see as something positive in imparting scientific insights and an enthusiastic attitude towards his science as witnessed by Martin Wilmking’s performance here. Steve M, I know you were in the process of summarizing the contributions from the visiting dendroclimatologist and I would recommend Martin’s contribution be put at the top of the list.
Not that Rob W and Peter B are not honest, hard working, bright, dedicated and personable guys — they just have not contributed much science here — yet.
Re #56,
Ken,
Peter B’s comments collated by Steve into the Dendroclimatologists
Answer Back thread include several contributions (along with
a few zingers, and they seem quite mild).
IIRC, Rob Wilson has made several contributions here over a
considerable period of time.
It’s a process, not an event, as someone likes to say.
Re: #57
JerryB, I read these posts and admittedly integrate them with my own personal view of learning from them. I liked Martin’s enthusiastic and positive approach to posting and he was spending his time addressing science issues as opposed to complaining about personalities.
Just curious, but perhaps you could tell me what Peter B and Rob W contributed to your personal information base. I’ll be honest; I could not even determine how serious or sincere Peter B was in some of his answers.
Ken,
Peter B replied at considerable lenth to Willis’ questions. He
briefly mentioned a number of specifics that are considered,
such as the elevation difference between a “nearby” weather
station, and that of the trees being examined, I would expect
that his answers will lead to more questions, which he, or
perhaps someone else, may address. I don’t expect all, or
even most, of the pertinent questions to be resolved quickly,
or to everyone’s satisfaction, but I look forward to further
discussions,
Rob W has exchanged numerous comments with Steve M over at
least several months, some regarding specific issues, but
I do not now recall details thereof.
#56 to 59 thanks for the flowers. i was inspired by rob and his thread on the itrdb listserv, and i know others are as well. i also know that peter b and rob have contributed significantly here. there are actually many dendro-people out there looking for real answers to real questions. and i am glad the discussion has been fair here and constructive. it did take a good part of my working day though and it is simply not possible to sustain that for very long. but i am sure that if you keep this style of discussion (fair, open, constructive) you will get more dendro-people listening and writing.
an idea: steve, would it be possible to email the author(s) of the articles you use to write your introductions / topics and invite them to contribute? probably many will not, but some will and those will close the gap we all feel exists here. good night.
RE: #40 – That’s a brilliant illustration of one of the truths regarding trees throughout Western North America. In coastal moisture rich areas, they tend to be temperature responders and in arid inland locations, moisture responders (and even, as noted with the NE Alaskan semi-arid sites, negative temperature responders). With the north vs south slope effect, you see a highly localized version of this, with northern slopes mimicing the behavior, to an extent, of more coastal areas and southern slopes being exagerated in the inland sense. Where I live, close to the California coast, we even see this. Some south slopes look like they belong in the Mojave and some north slopes would best fit in in Oregon.
#60. Martin, no harm in trying. I’ll do that. Thanks, Steve
My little sensitivity analysis demonstrates that sensitivity is much greater at high altitudes and latitudes. The divergence problem may well be due to going over the 20-25 deg C “hump” of the upside down U, since it seems to be warming, and most of the trees being sampled are from higher altitudes and latitudes.
RE: #61 – I would add that in my neck of the woods, the winter solstice essentially constitutes the begining of floral spring. The combination of the turn around in day length and the avaiability of moisture via the late fall – spring annual moisture maxium is what tells the plants to kick off their annual growth spurt. This will continue until mid summer, when the lowering sun angle tells them time for a short (very short by midlatitude standards) rest prior to the next year’s growth. During colder winters like the one just past, there can be serious disruption. The growth did not begin, this season, until well after the solstice. In some cases, there was overt damage and die back in the most extreme cases death.
Bernie #42
To satisfy my own curiosity I downloaded the growing season data from the Inuvik airport station.
Theres some missing months in 1995 and 1996 so I’ve left those growing seasons out and displayed the rest as mean with SD.
Ive plotted 1960-2003. Data is available 1957-2005.
The divergence problem is due to a serious underlying mathematical problem, the system is under-determined. Tree growth is controlled by multiple variables but only one quantity is measured, the ring-width.
Imagine a 3D plot with the temperature and precipitation as the two horizontal axes and the ring-width as the vertical axis. The inverted U response of ring-width to temperature and precipitation results in a mountain peak with the vertical height defined by the ring-width. If you’re lucky this shape is the same for all trees of one species and it’s not too full of valleys, folds, and breaks. Now you’d like to use the measured ring-width to determine temperature. You can’t. Knowing the ring-width only gives you a contour line around the mountain at a fixed height, the ring-width “height”. The contour line tells you how temperature and precipitation are related for the measured width but you have no idea where you are on the contour.
The only way to find out is to measure another quantity that is independent of ring-width and has its own relation to temperature and precipitation. Suppose dO18 [this is an example, the dendro’s will know what might be the real deal] is related to growth by a similar mountain peak with its own contours. This would yield a second temperature/precipitation contour which has to be overlaid on the first one. The intersection will then give you the temperature and precipitation for that tree ring with its measured dO18. If you’re unlucky, there will be multiple intersections but you’ll have limited the possibilities. [Murphy’s law guarantees that you’ll be unlucky]
Real trees respond to more than two variables so in reality this game has to be played in more than 3 dimensions, i.e., there is a need to measure multiple independent variables for each tree ring.
Statistical manipulations such as principal components do nothing to solve the under-determined nature of the problem. All they do is transform ring widths into new coordinates without generating any new information.
#66. Paul, in some cases, they measure MXD and other things, but my impression is that the problem isnt under-determination but weak relationships. I’m going to post something interesting on a Rob Wilson site where both MXD and RW are available.
Under-determination is part of the problem as well, Steve. Although, Paul, this is well understood by dendros. Indeed, it is the reason why there is a move now toward process based simulation modeling. You model the biology as much as you can based on lab experiments, guess at what you don’t know, and extrapolate to field observations through proper validation testing. You “reconstruct” multivariate climate by guessing what it had to have been in order to produce the observed ring width/density/chemistry pattern, subject to constraints imposed by the physical model. Sort of like GCModeling except you have the option of building process-based models through controlled experimentation (e.g. greenhouse or FACE experiments). That way you are less vulnerable to overfitting than are the climatologists. (Except of course there’s never REALLY enough $$$/data to get a valid model.)
Clarification.
Under-determination is not the cause of divergence; some poorly understood biological process is. What under-determination IS the cause of is a fundamental inability to reconstruct multivariate nonlinear climate from a single, composite, integrated signal. That is one of the reasons one samples multiple species across a range of site conditions (too cold/hot, too dry/wet); each composite then gives you a slightly different angle on the response function. Do this with a wide enough variety of samples (species, sites, climate regimes) and your problem is no longer statistically under-determined.
re: #68 Bender,
Right. But that means you need all the metadata which we’re always yearning for here and if anyone is going to be able to audit the work, we need the logic used to convert this metadata into predetermined methods. Of course, if you have enough data and you’re aware of what you’re doing, and save some data for verification, you can work out the methods as you go.
Do trace element concentrations in tree rings correlate with anything other than pollution? Laser Ablation- ICP/MS has high spatial resolution and sensitivity and is nearly non-destructive.
I would imagine that the response to moisture would be an upside down U shape as well. Too little water: bad.
Too much water: bad. Somewhere in the middle, just right.
Worse, the Just Right point is likely to vary as other things such as temperature and availability of nutrients vary.
Probably. I’ve read about insects and fungi attacking trees weakened by floods in Czech Rep. in 2002. These trees were overflooded for some weeks and after that the soil was oversaturated with water, resulting in wilting and decline.
#66, Steve. So long as tree growth depends on earth, air, fire, and water, just measuring ring width leaves you with an under-determined system. Adding MDX should help if it’s sufficiently independent of width.
#67, bender.
This is good news, experimental science with proper control of variables is much better at answering questions than purely observational science.
Alan:
I see a slight upward drift in mean temperature and a somewhat greater though still small upward trend in the minimum temperature.
I looked at the population numbers for Inuvik – they move up and down in a somewhat odd way – falling between 1996 and 2001 (3296 ==> 3152) before recovering in 2006 to 3484. The number of dwelling (2001 adjusted) though provides a better indicator for possible UHI effects.
1981 885
1991 920
1996 1125
2001 1391
2006 1542
I do not have a view of the actual location of the weather station – but it certainly seems worthwhile to check what has happened to it over the last 40 years or so.
RE: A problem that has Design of Experiments written all over it. Ring width as a response surface. What are the most important variables in driving that surface? Great area of study for a top gun PhD candidate.
RE: #71 – My observation is, it depends. For conifers on well drained substrates which are adapted to wetter mediterranean or marine west coast low to mid elevations, there really is no such thing as too much water. At the other end of the spectrum, for coast live oaks, in all mediterranean zones, the answer is yes – namely, due to positve correlation of heart rot with excess moisture availability, particularly during late spring.
66, Steve M:
I wonder if you are alluding to something I’ve been thinking about. I wonder if the dendros have tried looking at some combinations of ring width and densities. Maybe something like G = aw + bd + e, where G is an artificial growth parameter, w is ring width, and d is either ring density or latewood density. It seems to me that during cool periods both w and d would decrease. During moderate periods, w would increase and d would be moderate; during hot times (down side of quadratic), w would be small and d would be large. Part of the divergence problem could be increasing temperatures. Average July temperatures at Alamosa, CO (about 6500 ft. elev.) are 18.3 deg. C, meaning that during the day, temperatures spend a lot of time over the 20-25 deg. hump of the upside down U in July. Tree line in CO is approximately 11,000 feet. Assuming the trees that are sampled are about 10,500 ft and the lapse rate is 2 deg. C per M ft., the average July temperature at that elevation could be about 10 deg. So, daytime temperatures could easily be over 20 degrees, even at that elevation.
An interesting sidelight to 77. Alamosa, CO has the highest diurnal temp. variation in the nation: 108.9 deg. F (42.7 C)!
RE: #78 – Consider the implications of that in terms of the growth characteristics of non coastal trees of the Western US. Trees out here, away from the marine modified climate zones, are innately able to accomodate very wide swings in temperature, the highest in the US if not the planet. In terms of temperature limations, the “inverse quadratic” for such trees is wide and shallow. Another typical adaptation, allowing trees in typical inland climates to survive, is their ability to ramp up their metabolism when moisture is available, particularly when it’s available when the sun angle is high. Conversely, they go dormant when it’s dry, even to the point of shedding needles / leaves. I see this with the coast live oaks on my land. They are mainly invese quadratic moisture limited, with a weak inverse quadratic temperature limination term. My doug firs have lesser temperature sensitivity and can tolerate more moisture than the oaks – on the dry side they are seemingly more hardy as well. I am in the transition zone between what I’d term wet northern mediterranean and inland semi arid northern mediterranean mid elevation. Go inland and you get pure play. Take for example, just to pull one out of my hat, Cedar City, UT. There you’ll truly see fire and ice over the course of a year, and during the high sun angle times of the year, the diurnal variation, like Alamosa, not all that far to the east of there, is immense. The trees living there might as well be cactuses. That’s their mode of operation.
I had a post here addressing the fact Bishop has the greatest annual variation. What happened to it?
There seems to be a problem with this thread. New posts are not being added. Even accounting for the cache, there is clearly something wrong.
Redoing the earlier post the best I can…..
On the link posted by jae in #79 – the number 1 place in CONUS for annual variation is Bishop, California. Bishop just so happens to be the closest major ground measurement station to the White Mountains.
Re: opening graphic.
Wait a sec, is this a case of NEG vs POS responders, or EARLY vs LATE responders? Because look at the divergence pattern 1900-1920. It’s opposite of that observed in the late 20th c.: the POS are NEG and the NEG are POS!
RE: #79 – also of note – among the top 50 cities, there are two that are amazingly close to the coast – Santa Rosa and Hollister. Santa Rosa is the most amazing, since the lone range of the Coast Ranges separating it from the Pacific is quite low – only a bit over 1000 ft. It’s actually only 50 miles north of SF and even gets a bit of coastal overcast at times. Hollister is even closer to the coast in terms of straight line distance from Monterey Bay, but, the mountains, with the exception of the Pajaro River gap are higher than the ones separating Santa Rosa from the sea. Also of note, there are no mountains betweenn Hollister and the south end of SF Bay – when there is a sea breeze from the NW it does reach Hollister (but only just, and quite well warmed at that point by the passage over 40 miles of Santa Clara Valley floor). Some others not as close, but not much further from the shore – Paso Robles, Ukiah and Cambrian Park. The first two are quite interesting cases. They are both in piedmontish areas, separated by 2000ish foot ridges from the ocean. They both get below freezing nightly in the winter and have semi arid climates, with notable grass land and black (deciduous) oak savanna. Both are also known as excellent terroirs for Syrah, Zinfandel and other heat tolerant vines. You can count on 100 deg plus temps. I’d say based on my experience, Ukiah has higher absolute summer highs than Paso, but Paso is less variable during summer, hanging in the 90s daytime high wise instead of swinging between 80s and 100s like Ukiah.
Bumping this up so jae can see my comments about some of the top 50 annual diurnal range cities I am most familiar with from personal experience. A final set of anecdotes in this regard.
Where there are not overt “fog gaps” along the California coast (and also, along the lowest latitude portions of the coast, where SSTs start to rise a bit), there can be some truly amazing mid summer thermal gradients. For example, there are places along the central coast and south coast, where you can literally go from 55 – 64 Deg F, with overcast, and possibly even local drizzle, to over 90 or even higher, over a distance of no more than 10 miles. When I lived on the south coast, 20 plus years ago, I used to sometimes want to get away from what is called the “June gloom” – days on end of coastal overcast that never burns off. Such a condition is actually caused by the combination of persistent oppresive heat inland, combined with a net Westerly (but not enough of one to cool the interior). I would quite literally hop in my car, overcast, low 60s. I would drive over the first range, 3000 feet tall. Even prior to reaching the summit I’d rise above the marine layer into the sun. There, it would be 85F. Crossing the summit, and dropping into a piedmont area (~ 1000 ft elev) which was not getting any of the marine layer, it would literally be 100 deg F. Nearly a 40 deg F gradient, over less than 10 miles.
dendrorumination:
The “positive” responders are hypersensitive responses to “temperature” – in reality permafrost-melting, leading to increased MOISTURE availability early and late in the growing season (thanks, Jarkko). They are more likely to be found at frozen tundra/bog treeline. Briffa is making good use of these in the case of Yamal larch.
.
The “negative” responders are responding to increasingly DRY conditions in alpine scenarios. Hughes explains why he wants to avoid these, in the case of California bcps.
.
The trees are reacting mostly to changes in moisture.
.
Briffa and Hughes probably already figured this out and are sitting on a mountain of data, waiting for Copenhagen to pass.
.
Just a WAG.