As noted yesterday, Jacoby and Cook didn’t get the memo about not using the Dulan juniper chronology of Wang et al 1983 (also used in Crowley and Lowery 2000) and used it in a panel diagram in Gou et al [Ann Glac 2006]. Wang et al 1983 is unusual in a dendroclimatic publication, because they identify the location and altitude of every core that they took. This is made easier by the fact that they only used 3 cores, not even close to minimums required according to dendro standards. Of the cores, one was nearly 200 km away from the other two. As shown below, there has been a great deal of subsequent dendro work done in the area, much of reported in the Western literature, consistently reporting that junipers in the Delingha-Dulan area are precipitation proxies and using the site chronologies to reconstruct precipitation over more than a millennium. As noted below, the Dunde ice core location is close to the Dulan junipers and, in fact, the Delingha temperature station is used to calibrate the Dunde ice core. Additional understanding of information from Dulan junipers may shed light on the thorny issues of the Dulan ice core.
Gou et al 2007, cited by twq as supposed evidence for a correlation between Qaidam Basin (Dulan) junipers and temperature, is a new study of a site in the headwaters of the Yellow River rather than the Qaidam Basin and, whatever its merit or lack of merit (and there is much to criticize in the study), hardly stands as evidence one way or the other in respect to Qaidam Basin junipers.
Wang et al 1983 list the location of the 4 cores in the table below, of which they only use the first 3 cores. Core 1 is about 200 km away from cores 2 and 3 and core 4 is another 200 km or so further away. Wang et al 1983 shows the ring widths for each of the cores, indicating a visual similarity between cores 1,2 and 3 to justify the chronology. Core 4 was excluded from the composite due to a different pattern. 3 cores are not considered sufficient to ground a chronology and the continued use of this chronology must surely be regarded as surprising.
Core Rings Lat Long Altitude Faces
1 913 37 00N 98 48E 3670 S
2 935 37 18N 97 12E 3900 S
3 718 37 18N 97 12E 3750 S
4 296 38 42N 99 54E 2600 N
The three cores used in the Wang et al 1983 chronology all come from south-facing slopes of mountains in the Qaidam Basin. More recent studies have sampled similar sites.
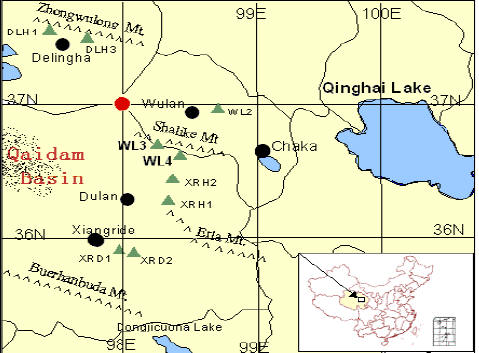
Shao et al (Chin Sci Bull 2005, PAGES 2005 and others ) are a series of precipitation reconstructions from juniper sites in the Delingha-Wulan-Dulan area. Shao has some pictures in this online presentation., from which the location map below is taken. Wang et al 1983 Cores 2 and 3 are taken a little to the west of Shao et al site DLH1; Wang et al 1983 Core 1 is taken close to Shao et al site WL2. Shao et al are much larger and more modern collections. Dendrochronologists are always rushing to ”¬Åmove on”¬? – here’s a case where it would be OK for them to move on. I can think of no valid reason for continuing the use of the Wang et al 1983 chronology in place of Shao et al. Or, at a minimum, if Jacoby and Cook want to use Wang et al 1983 as a comparandum, they should at least note the existence of subsequent work in the area.
 |
 |
Left – Location map from Shao et al online presentation. The locations of Shao et al sites are: WL2 37°02′ 98°40′ 3620m SE10°; WL3 36°45′ 98°13′ 3730m; WL4 36°41′ 98°25′ 3700m SW25°; DLH1 37°28′ 97°14′ 3730m NW60°; DLH2 37°28′ 97°13′ 3780m SW20°; DLH3 37°27′ 97°33′ 3920m SW10°; XRD1 35°58′ 98°02′ 3820m SE10° ; XRD2 35°57′ 98°09′ 3840m SE15° ; XRH1 36°21′ 98°22′ 3910m SE70°; XRH2 36°31′ 98°23′ 3830m SE70°. Right – location map from Sheppard et al 2004.
Sheppard et al 2004 was a reconstruction of precipitation since 515 BC obtained from chronologies derived from juniper stands located at 37.0N, 98.5E, 3,800 m elevation near the town of Shenge and 36.0N, 98.0E, 3,800 m elevation near the town of Dulan. The location map for Sheppard et al 2004 is shown in the right panel above. You will notice that the Dunde ice core is located in the top left corner of this location map.
Zhang et al 2003 was a 2326-year reconstruction of spring precipitation derived from juniper sites described as being in the Dulan area (35 50 – 36 30 N, 97 40 – 98 20 E) on south-facing mountain slopes between 3100 m and 3800 m. They do not provide an adequate location map or more precise location information. This is an important study which I will return to because they reported that they used 20 samples from ancient tombs and 68 samples from living trees, of which 55 samples had been collected and examined in a separate study [Kang et al 1997]. Because the Kang et al 1997 chronology was applied in the Yang et al 2002, a composite used in many subsequent Western multiproxy studies as a temperature proxy, this particular network deserves further attention.
Zhang et al [Dendrochronlogia 2007] report on another set of samples taken from living junipers on south-facing mountain slopes northeast of Delingha city at 37 27 N, 97 56E (a bit to the east of DLH3 in the top left location map), ”¬Ågrowing sparsely in open stands at an elevation between 3500-3900m in our study area”. They report the collection of 62 increment cores from 42 trees.
twq has written in to climateaudit, condemning my characterization of Dulan junipers as precipitation proxies and challenged my ability to report on this topic since I have not travelled to Dulan and he has. He cited Gou et al 2007 as authority for the use of Dulan junipers as temperature proxies. I will discuss this separately in a later post. For now, it suffices to that the site studied in Gou et al 2007 is located at 34 45 57N 100 45 44 E in the upper headwaters of the Yellow River. It would not even appear on the location map shown here which covers an area no less than about 400 km by 300 km, although it would appear on a similar scale map to contiguous with this map. Even if the Gou et al 2007 site is a magic thermometer, such analysis does not prove that Qaidam Basin sites are valid temperature proxies. Gou et al 2007 not only does not overturn the interpretations of Shao et al 2005a, 2005b, Sheppard et al 2004, Zhang et al 2003, 2007, it doesn’t even consider them.
While I think that there is much evidence that Qaisam Basin junipers are precipitation proxies, my view on the matter is irrelevant to any arguments made here. All that is relevant to an audit perspective is that qualified specialists – Shao et al; Sheppard et al; Zhang et al – have said so. Even if some subsequent specialist were to come along and prove otherwise, if one is verifying the use of these proxies in multiproxy temperature reconstructions for IPCC 4AR, one has to say that specialists describe them as precipitation proxies and, accordingly, they should not be used in temperature averages.
Given the nearby presence of the Dunde ice core, it’s interesting to look at these reconstructions as precipitation reconstructions and reflect a little on what it might mean for the interpretation of dO18 values in nearby ice cores and I’ll try to do that in a future post.
References: (two of which are inaccessible to me)
Kang, X., Graumlich, L.J., Sheppard, P.R. 1997. A 1,835 year tree-ring chronology and its preliminary analyses in Dulan region, Qinghai. Chinese Science Bulletin 42(13):1122-1124. (also cited as Quatertnary Sciences) [at present inaccessible to me]
SHEPPARD P. R.; TARASOV P. E.; GRAUMLICH L. J.; HEUSSNER K.-U.; WAGNER M.; STERLE H. ; THOMPSON L. G., 2004. Annual precipitation since 515 BC reconstructed from living and fossil juniper growth of northeastern Qinghai Province, China, Climate dynamics, 23,. 869-881 http://www-bprc.mps.ohio-state.edu/Icecore/Abstracts/sheppard_et_al_clim_dyn_2004.pdf
Shao, Xuemei, Lei Huang, Xiuqi Fang, Lili Wang, Junbo Wang, Haifeng Zhu, A Dendroclimatic Study of Qilian Juniper in the northeast Qinghai-Xizang (Tibet) Plateau, http://web.archive.org/web/20031204084631/http://www.igsnrr.ac.cn/files/sxm20020918.pdf downloaded ~2003.
Shao, X.M., Huang, L., Liu, H.B., Liang, E.Y., Fang, X.Q., Wang, L.L., 2005a. Reconstruction of precipitation variation from tree rings in recent 1000 years in Delingha, Qinghai. Science in China (Series D) 34, 145-153.
SHAO, XUEMEI , ERYUAN LIANG, LEI HUANG AND LILY WANG, 2005b. A 1437-year Precipitation History From Qilian Juniper in the Northeastern Qinghai-Tibetan Plateau. PAGES http://www.pages.unibe.ch/products/newsletters/NL2005_2low_res.pdf
Wang Yuxi, Liu Guangyuan, Zhang Xiangong Li Cunfa: 1983, The relationships of tree rings of Qilianshan Juniper and climatic change and glacial activity during the past 1000 years in China, Kexue Tongbao, 28(12):746-750.
Yang, B., X. C. Kang, and Y. F. Shi, 2000. Decadal climatic variations indicated by Dulan tree ring and comparison with other proxy data in China of the last 2000 years, Chinese Geographical Science, 4, 193-201, 2000. [inaccessible to me at present]
Yang Bao, Achim Braeuning, Kathleen R. Johnson, Yafeng Shi, 2002. General characteristics of temperature variation in China during the last two millennia. Geophysical Research Letters 10.1029/2001GL014485
Zhang, Q.-B., Cheng, G., Yao, T., Kang, X. and Huang, J., 2003: A 2,326-year tree-ring record of climate variability on the northeastern Qinghai-Tibetan Plateau. Geophysical Research Letters, Vol. 30(14), 1739, doi: 10.1029/2003GL017425. http://trl.ibcas.ac.cn/download/Zhangqb.Geophysical_Research_Letters.2003.pdf
Zhang et al 2007 A millennium-long tree-ring chronology of Sabina przewalskii on northeastern Qinghai-Tibetan Plateau, Dendrochronlogia 24 http://trl.ibcas.ac.cn/download/Zhangqb.2007.Dendrochronologia.pdf


45 Comments
I’m interested in this statement: “Core 4 was excluded from the composite due to a different pattern.”
Does the study give any more data regarding why core 4 was rejected?
If I were to run an experiment in physics, and if I was given the latitude to reject any results that did not
show the result that I was looking for, I too could prove anything that I wanted.
Maybe a site visit would be warranted. I may be in the area in late Fall, depending on my travel plans. I’m sure others who participate here may also be heading out that way over the course of the year.
Re: #2
Steve S., it would be great to get some first hand perspective. I for one would really appreciate your observations if you can make it there. Either way, hope you have a good trip.
Sinan
Like the the Dunde ice cap, since the study site of Gou et al is also located in the boundary of the map above, why don’t your make a sythesis of all proxies in this region? In this way, maybe you can draw some conclusions. I have made a Preliminary comparison, and find there is good agreement between Dunde ice core Oxygen isotopes, Wang et al. (1983), Shao et al. (2004), Zhang et al. (2003,2007) and Gou et al. (2007) in low-frequency domains. Considering the fact that temperature change has more spatial similarity than precipitation,this suggests that seemingly all the junipers are controlled by temperature rather than precipitation. Please examine it.
PS: Like I said, the Qilianshan Junipers maybe be controlled by temperature or precipitation because they have their respective mechanisms. The final conclusions need long-term monitoring on-site. At this stage, it is surely incorrect that the junipers was only regared as precipitation proxy as Steve think. Only one grasp their growing patterns, one can conclude which effect (temperature or precipitation) dominates. What do you say?
Re: Kang, X., Graumlich, L.J., Sheppard, P.R. 1997. A 1,835 year tree-ring chronology and its preliminary analyses in Dulan region, Qinghai. Chinese Science Bulletin 42(13):1122-1124. (also cited as Quatertnary Sciences) [at present inaccessible to me]
In this paper, the juniper ring widths were used to reconstruct 1835 years of temperature change.
There are nice-quality images of this area on Google Earth – don’t have the time to post anything – perhaps someone else does.
#4,5. twq, can you email me a copy of Kang et al 1997 as it is not at my library and is inaccessible to me.
You continue to misunderstand my position as to what I “think” about the Qaidam Basin junipers. It is irrelvant what I think. All that matters is that Shao et al; Sheppard et al; Zhang et al are aware of Kang et al 1997 and describe these junipers as precipitation proxies. KAng et al 1997 would appear to be superceded in the specialist literature. Additional to the references already provided, Tarasov and Wagner specifically consider and criticize Kang et al 1997 here
The point is not whose right or wrong, but that there is no agreement (“consensus”, if you prefer) as to the meaning of these ring widths, with a distinct majority of specialist opinion saying that they are precipitation proxies.
The temperature information is of little help to you: even if there is a slight positive correlation between prior winter temperature and ring width, there is a strong negative correlation between current spring temperature and ring width (with spring temperature and precipitation being inversely correlated.) So ring widths become a very complicated integral, which is impossible to invert with the information at hand to make a temperature reconstruction.
#4.
twq, the Gou et al 2007 site is NOT located within the location map presented here but OFF the location map as I said above.
None of the information is archived so there’s not much more that I can say about it beyond what I can post here. If you email me some datasets, maybe I can look at it some more.
twq #4
The inference that temp OR precip
Steve, I have intended to express my ideas that the Juniper in Qilianshan has very complex physiological mechnisms and it is premature or too early to make final conclusion which factor (temperature or precipitation) dominates before the monitoring is done. I am sorry for misunderstanding your position. Generally, temperature and precipitation change is in phase on decadal to longer timescales in most of China. In other words, there is high correlation between them. It is also one of factors which cause the complex response of ring widths to climate and consequently is difficult to separate one from another. Thus it seems that whether temperature or precipitation (annual) are used for reconstruction of low-frequency signals (decadal to centennial) should be no problem. How about your opinion?
I’d happy to continue this discussion.
#5,
It is very long ago that I read through this paper. Now it is inaccessable to this paper from the website. When I get the ecopy of it, I will send it to you.
#5, Gou et al. (2007) discussed the juniper ring widths and thought as temperature proxy, which was collected from the semiarid regions and has similar setting to Dulan region, and even high-cold regions of America. Since the Qilianshan Juniper can be regard as an illustration of bristones of America, it is of course that I use the Gou’s study site to strenghen my argument.
RE: Tarasov and Wagner specifically consider and criticize Kang et al 1997 here
Usinga rather weak correlation between juniper tree rings and temperatures of the autumn months Kang et al. (1997) have reconstructed a succession of “cold” and “warm” intervals and tried to correlate it with the Medieval Warm Period and Little Ice Age found in European records. However, further evaluation demonstrates that ring-width data from Dulan much better respond to the precipitation of the water year’ (Tarasov et al. 2004; Sheppard et al. 2005). This relationship is easy to explain by the physiological processes limiting tree growth in the semi-arid regions of China, where precipitation varies between 100 and 400 mm per year.
Only judging from the correlation, Kang et al. (1997) and (2000) gives a high correlation 0.79. Is it a weak correlation?
Correct: correlation is 0.69
Only judging from the correlation, Kang et al. (1997) and (2000) gives a high correlation 0.69. Is it a weak correlation?
twq #4
Your inference that temp OR precip OR some complex relationship I believe is the point.
To “extract” the temperature signal through earth history is impossible from this type of non-unique phenomenon. As Steve points out in #7, this is a complex integral with no unique solution and the point is that many more qualified experts seem to agree.
Wow, 4 to 16 inches of precip. per year is not prime tree growing climate!
How acout “tree ring circus”, or “three ring circus” for this one’s title?
RE: #13 – Not unlike the mountains to the east of the Owens Valley. Annual diurnal variation is probably similar as well. Remember, #1 in the US, from the excellent link you posted on that topic on another thread, is Bishop, CA. Plants in Eastern California, including trees, are well adapted to:
1) Grow in an environment with very, very wide temperature swings
2) Grow in an environment with episodic high, parching wind.
3) Taking advantage of liquid water, even when the temperature is low enough to prevent growth of Eastern, Northwestern and other perhumid and semi humid species (cactus effect)
4) Going dormant prior to reaching the wilt point
5) Scaling back metabolism or even becoming outright dormant, when it is hot, in order to conserve water
My coast live oaks hint at these behaviors, BCPs are type examples.
Re #12
RW is the integral of multiple, interacting, non-independent inputs, response to any or all of which is nonlinear. That’s four problems in total, not just the one (of non-invertibility). The way to solve this is through botanical/physiological process modeling, not statistical modeling.
A few observations here about these high altitude tree ring series. They are growing at an approximate altitude of 3500m. A quick calculation suggests that the concentration of CO2 at such a altitude would be about 250ppm (assuming 380ppm at sea level). Before we atarted pumping CO2 into the atmosphere the sea level concentration of CO2 was about 280ppm, hence at 3500m about 180ppm. So over the last 100 years or so the CO2 concentration for these trees has risen from a very limiting 180 to 250ppm. This will not only have had a marked effect on photosynthesis, but also on water use efficiency, as it is well known that increased [CO2] reduces stomatal densities.
So what we have got are trees that over the last 100 or so years will have increased their photosynthesis and water use efficiency, irrespective of any changes in temperature or precipitation. No wonder there is a “divergence problem”! It’s not rocket science, just another example of the insularity of the dendroclimatology community.
re: #17 Don,
While I know what you mean, you’ve stated it wrongly. ppm means parts per million and I doubt it changes much at all with altitude. What you want to do is change to an absolute measure of pressure or amount present. Something like g/m^3 would work.
R# 18, yes you are right- the actual changes are best expressed in mb.
At sea level current partial pressure of CO2 is about 0.38 mb, that at 3500m is around 0.26.
100 years ago the respective figures would be 0.28 mb and 0.18 mb.
I was using approx sea level equivalents (in ppm) to show the changes that these trees will have experienced in the last 100 years.
My use of units here makes no difference to the conclusions.
#17
This almost certainly isn’t a problem with this data set. It probably has the growth trend removed by fitting a negative exponential or a spline. This is the traditional procedure. This will also remove any gradual change growth rates as water use efficiency as CO2 increases. This could only affect data sets standardised with procedures like the regional curve standardisation which try to retain the long term variability.
Re #16
Bender, I asked the question at Unthreaded: How much physiological process modeling is being currently performed regarding TRW — lets say as compared to crop plant modeling to predict yields?
Don Keiller says:
R# 18, yes you are right- the actual changes are best expressed in mb.
At sea level current partial pressure of CO2 is about 0.38 mb, that at 3500m is around 0.26.
100 years ago the respective figures would be 0.28 mb and 0.18 mb.
I was using approx sea level equivalents (in ppm) to show the changes that these trees will have experienced in the last 100 years.
My use of units here makes no difference to the conclusions.
Don, here’s a post and references on changes in dC13 in high-altitude bristlecones that shows a pronounced change in the last 150 years or so, consistent with theory on water use efficiency. It amazes me that climate scientists acquiesce in the continued use of proxies with such properties as temperature proxies.
#21. Ken, Here’s what the reputable dendroclimatologist Hal Fritts said at the dendro listserv about this very question a couple of days ago:
Steve re #23 is a link missing?
But while we are on the subject, just how difficult would it be to grow bristlecones in environmentally controlled chambers for a few years and look at the effects of CO2 fertilisation?
Cambridge University have just spent ⢭illions on new plant growth rooms. Controlling CO2 (c.f FACE) should not be too difficult. Some will argue that it would be too expensive and would not exactly replicate outdoor conditions. My reply would be that its cost would be a minute fraction of implementation of Kyoto and that years of experiments have demonstrated broadly similar plant responses to elevated CO2 in both indoor and outdoor experiments. Who might be afraid of the results?
#25
As much fun as criticising the Bristlecones may be, the science of climate change does not stand or fall on the reliability of this proxy.
#26. Richard T,
No one here has ever said that.
Indeed, as an IPCC reviewer, I specifically said that, if these arguments are not relevant to the science of climate change, they should not be included in AR4. I looked at review comments by other reviewers to the First Draft and no climate scientist said: these climate reconstructions are irrelevant to the science of climate change and should be excluded.
I’m OK with climate scientists renouncing these millennial climate reconstructions. But if they want to do so, they have to do so. If they don’t want to renounce them, then they’ll have to justify why they continue to use bristlecones.
I agree that the science of climate change doesn’t stand or fall on this. But it’s the only area that I’ve studied in detail and it’s a mess. IPCC appears to be incapable of determining this – so the question goes to the reliability of their due diligence in other areas. It would take me a very long time to go right to the bottom of other arguments. I’m not saying that they are right or wrong – I don’t know. But as long as they prop up the bristlecone-based arguments, they sure lose credibility in my eyes. – And it’s not as though I didn’t suggest a reasonable way out for them.
RE: #26 – the overall science indeed does not stand or fall on it. However, certain demogogic things that have happened within the a certain subculture of the community over the past 10 years certainly would be impacted by it. For said demogogues, the utility of “making the MWP go away” and claiming “warmmmmmest in one thoooouuusssaaannnddd years” etc, heightens the importance of BCP ring series – ill or good as the effect may be.
Don Keiller says:
“But while we are on the subject, just how difficult would it be to grow bristlecones in environmentally controlled chambers for a few years and look at the effects of CO2 fertilisation?”
I had a different idea, there are large numbers of parks where trees have been transplanted to, for instance Central Park New York. The ring data of transplanted trees should show what happens when trees are moved from one place to another. If you know the ppt rate and average temperature of the Park and the location they were taken from you should be able to get a whole lot of data.
IMO, that is precisely why they continue to use the data. They have backed themselves into a corner where spewing the party line is the only way to save face. After one’s career, whether scientific or political, is wholly or partially predicated on a given set of beliefs then those beliefs must be sustained or else…
I agree with Richard T in some way. It is ture that whether these millennium climate-reconstructions show an increasing trend or not is irrelative to make a conclusion that the release of co2 is primary factor responsible for recent climate warming.
re: #31 twq,
The connection between millennial climate-reconstructions and allocation is that before determining how much of recent warming is human-caused requires knowledge of what amount of natural variation occurs. The greater the amount of natural variation, the greater the possibility that a current warming is partially or totally of natural causes. The claim that the current temperature is higher than any time in the past millenium means that the odds are smaller that current warming is of natural origen.
Showing that the millenial reconstructions are not reliable increases the chances of natural warming and therefore is relevent to deciding if CO2 is the primary cause of current warming.
No, now it looks like it stands mostly on the reliability of massive computer models that can’t even account for the many effects of clouds.
Re #32,
I understand and thanks for your comments. However, there is still too much uncertainty to draw such a conclusion that the recent warming is attributable to natural or artificial results even though these millennium reconstructions show greater variability indeed in the past, because the mechanisms of long-term climate change is still open.
twq,
I appreciate your openess. I can tell you that I have debated way to many people recently, some noted scientists, who are willing to declare, without any reservation that it is completely proven that close to 100% of the recent warming is due to man.
Twq:
Depends on what you are calling “recent warming”.
Climate is on warming trend for 150+ years, CO2 is noticeably rising for less than 100 years, antropogenic CO2 emissions rose noticeable for only 50 years, from 1.2 Gt C per year in 1950 to 6.5 Gt in 1990 (and about leveled off since):
If “recent warming” is for 150 years, antropogenic emissions of GHG could cause it only from the point of view of somebody traveling back in time.
If “recent warming” is for last 30 years ‘€” yes, it is theoretically possible.
In science never exist the last word
Re: #26
The science of climate and how the reliability of its outputs are to be evaluated do, in my judgment, stand on how the scientists of climate change (and their layperson supporters) react to such criticism. In the consensus of scientists on climate change one needs to know if there are any prejudices and cherry picking of results. I think a number of supporters of the current state of science on climate change do not necessarily see this aspect of the issue very clearly.
RE #26 “As much fun as criticising the Bristlecones may be, the science of climate change does not stand or fall on the reliability of this proxy”. No, but as Steve said, the continued use by the IPCC of such questionable data as factual proof of AGW casts doubt on their other endorsements. Loehe’s(Ecol. Mod. 171, 433-50) 2004 paper casts more doubt- as does Svensmark’s Solar Climate connection (e.g J. of Atm. and Solar-Terrestrial Phys., 59 (11) (1997) 1225-1232. AGW, as a theory, has a number of competitors- credible ones at that. I and many others have yet to see a knockout blow from the AGW camp. Dodging the contenders is an old (and past it) boxing champion’s modus operandii. But sooner or later you have to face up to reality.
Current Int JClimatology:
Drought reconstruction for North Central China from tree rings: the value of the Palmer drought severity index
Jinbao Li 1 2, Fahu Chen 1 *, Edward R. Cook 2, Xiaohua Gou 1, Yongxiang Zhang 1
1CAEP, MOE Key Laboratory of West China’s Environmental System, Lanzhou University, Lanzhou 730000, China
2Tree-Ring Laboratory, Lamont-Doherty Earth Observatory, Columbia University, NY 10964, USA
email: Fahu Chen (fhchen@lzu.edu.cn)
*Correspondence to Fahu Chen, CAEP, MOE Key Laboratory of West China’s Environmental System, Lanzhou University, Lanzhou 730000, China.
Keywords
dendroclimatology ‘€¢ drought ‘€¢ PDSI ‘€¢ north central China
Abstract
We present a drought reconstruction for north central China based on a tree ring-width chronology developed from two sites of the Chinese pine (Pinus tabulaeformis) in the northern Helan Mountains. The drought reconstruction, spanning 1788-1999 A.D., was developed by calibrating tree-ring data with the Palmer drought severity index (PDSI), an index that describes the regional moisture condition properly. The reconstruction was verified with independent data, and accounts for 45.7% of the actual PDSI variance during their common period (1941-1999). The full reconstruction indicates that the regional drought variability was relatively stable during the nineteenth century, but became more variable and persistent during the twentieth century. The drought epoch in the late 1920s was the most severe one in our reconstruction. In contrast to a wetting trend in the western area of northwest China, a clear drying trend has occurred in north central China since mid-1930s. The multitaper method (MTM) spectral analysis indicates the existence of some decadal (11.4 year) and interannual (9.1, 6.8, 4.0, 2.7 and 2.1-2.0 year) cycles, which may potentially be the fingerprints of some proposed climate change forcings. Copyright ⧠2006 Royal Meteorological Society
40: Now THATS the type of study where tree ring information is useful, IMHO. An R2 of 47.5% ain’t bad and makes good sense.
I wonder, Steve M., if the 11.4 year cycle in that paper is perhaps indicative of the solar cycle?
Interesting, btw, that 47.5% of the variability in tree-rings is attributed to _moisture_, not temperature, in this study. Also interesting is that the variability is increasing, i.e. it is not stationary.
Mark
1. The link between solar cycles (bidecadal and decadal) and drought in the continental US has been reported in the literature, and is well-known. So why not China?
2. Are the tree-ring data archived? They don’t actually show their data in this paper, just the reconstruction.
3. They are using Picea. In N. America that would be a bad idea for the number of outbreaking insects that feed on Picea, many of these genera occurring in Asia. How do they rule out insect outbreaks as a source of variation? The word “insect” is not even in that paper. Many insects are more prone to outbreak during droughts. Including species that feed on Picea.
4. They show the spectrum of the reconstruction, but not the data on which the reconstruciton is based. It would be interesting to see where in the frequency domain there is gain and loss of signal.
Re #21
Very little, IMO. I could answer quantitatively via a literature search, but it’s hardly worth the effort. I do not think the physiologists have tuned into this particular gem of a debate. Not yet.
Re: Li et al’s Fig. 3.
The 1944-45 event is exerting large leverage on the reconstruction calibration. Take those years away and watch the significance of the reconstruction drop. Meanwhile dry episodes in 1948-51, 1961-63, 1981-83 are not well reconstructed at all. Looks like the reconstruction might actually be failing in the decadal range. The 1970s and 1990s events are reasonably well-reconstructed. Wet events in 1959, 1988 are not at all well-reconstructed.