One of our readers asked how it was to read a thermometer. I’ve got a slightly different question: if I can locate daily maximum and minimum readings for Dulan airport on the internet, why can’t NOAA? This is not as trivial a point as it might seem, as it turns out that Dulan airport is one of a very few stations contributing to a lurid blotch of big temperatures on the NOAA gridded March map.
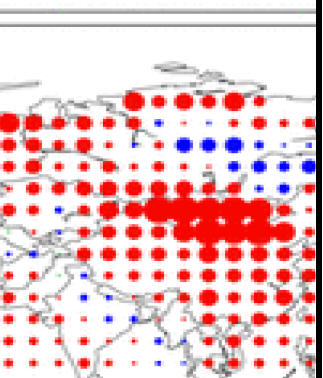
Here is an excerpt from the NOAA MArch 2007 map announcing the xth warmest month since the Eocene or 1960, whatever. The big lurid red dots are 5 deg C positive anomalies and, iin west China, go, on the 42.5N latitude line from 92E to 112E and on the 37N latitude line from 97E to 117E. Dulan, which we’ve been discussing, is in one of these gridcells.
The readme for the NOAA gridded series says:
This data set contains gridded temperature anomalies calculated by the “anomaly method”. Gridpoint temperatures are calculated by averaging the unweighted raw data from all stations within the grid box, and then the anomaly is the difference from 1961-90 mean.
If one then examines the monthly station data in the GHCN compilation of data for the corresponding gridcells, one finds that some of the gridcells contain no data more recent than 1990. However, GHCN has a roster of daily data. I’m not sure how these are integrated in the calculation of the anomalies. In any event, if one then examines the roster of sites with daily data, separately listed here , one finds that there are 6 reporting stations to cover the 10 most lurid red dots, as listed below. Dulan is an old friend, appearing here in a new role.
205 52203 000 42.82 93.52 737 CH HAMI GSN 52203 703
205 53068 000 43.65 111.97 965 CH ERENHOT GSN 53068 707
205 52533 000 39.77 98.48 1477 CH JIUQUAN GSN 52533 776
205 52836 000 36.30 98.10 3191 CH DULAN GSN 52836 776
205 53614 000 38.48 106.22 1111 CH YINCHUAN GSN 53614 778
205 53772 000 37.78 112.55 778 CH TAIYUAN GSN 53772 779
The daily data updated as of April 17, 2007 for Dulan is located here http://www1.ncdc.noaa.gov/pub/data/ghcn/daily/gsn/20500052386.dly. If you look at the March 2007 readings for TMAX and TMIN, you will notice that there are 28 max readings and only 14 min readings. The graphic below shows the number of readings by month during the history of this record (Starting in 1961). There is a hiatus around 1990 – does this represent an inhomogeneity? Inquirigin minds want to know. While measurements were regular as clockwork back in the day, now the number of readings per month is erratic. Indeed, March 2007 set a record low for the number of minimum temperature readings.

Number of minimum temperature readgins, Dulan, by month, collated from NOAA file.
But while the NOAA record has become progressively more erratic, with a click of the mouse and a simple google, one can locate daily maximum and minimum temperatures for Dulan airport for March 2007. Indeed, one can get temperatures at 3-hour intervals.
Is there any bias in the NOAA record? I haven’t checked. There are some oddities. The NOAA record shows a high of 1.9 deg C for March 9, 2007, while wunderground.com shows a high of only -2 deg C. I just looked at some values manually and couldn’t figure out how to obtain a digital file of the Dulan airport readings. If someone else can figure this out, it would be a useful exercise to compare the two records. The more puzzling thing is why the NOAA record for Dulan is so incomplete.
Update: Here’s a comparison of wunderground.com March 2007 max -min’s converted to deg C in red as compared to NOAA (black plus dots). I wonder what causes the difference in reporting availability.


36 Comments
Some time ago I tried to find explanation for this, but I gave up.
Steve, when checking Tu Tiempo and NASA-GISS …they
don agree either NG have colder temperatures than TT…
one thing is clear that gridcell is 1-2 deg C warmer than
1961-1990 average…When UHI is removed there is not much
left but as you know 1 billion Chinese citizens can be
wrong so chinese cities are the first in the world to
have outdoor air conditiong hence the 80 or so new
carbon-driven power stations a year…HWGA! SL
PS Ironically Erenhot was the least hot 1 C …DS
Steve,
It appears that you can retrieve the daily temperature data on a month by month basis without too much hassle. If you could write code to modify the year and month in the following URL, which generates comma-delimited daily temp records, you could loop and capture it to your heart’s content:
http://www.wunderground.com/history/station/52836/2006/5/1/MonthlyHistory.html?req_city=NA&req_state=NA&req_statename=NA&format=1
I’m not sure if this is the data for which you are looking so it may not be helpful. Just a suggestion.
“how hard is it to read a thermometer?” Obviously very hard indeed. So hard in fact that less and less readings are taken as years go by. You just can’t get the staff these days!
Steve,
NOAA had a similar map for Dec-Feb, in which the very warm early winter anomalies were featured. Also in that link was a map of the Feb anomalies. To my surprise, Alaska was covered with red dots. I checked a number of stations, as well as a very weather site, and most of Alaska had below normal temps and precip for Feb.
For the life of me, I couldn’t figure out why there were only a few blue dots in the Alaskan grid cells. Maybe someone from Alaska can elaborate on this . Below is the link:
http://tinyurl.com/3dz424
Steve:
It looks like the Dulan temperatures at this site goes back to June 19, 2004. It may be worth making direct contact withth the site and simply ask them for the data.
@All
This is a rather crude R-project script to retrieve daily values from wunderground.com – one of my early wretched attempts learning R-project:
## Import von meteorologischen Daten aus wunderground.com#
Wundergroundm/s
mr$WindSpeedMeanm/s
mr$GustSpeedMaxm/s
mr$TempMax
Test:
dulanSorry, won’t work, although code-tagged … sigh….
Will send this to Steve via mail.
It could be a case of a rural area vying for an expected doubling of spending on environmental spending from current levels to about $170 billion US over the next 5 years. These articles evidence a sea change in china…
http://www.berkshirepublishing.com/blog/?p=617
http://www.china.org.cn/english/features/guideline/156529.htm
http://www.china.org.cn/english/environment/189348.htm
Am I reading this right?
If you have a station with more max temps and fewer min temps recorded, wouldn’t averaging the raw data bias the average strongly upwards?
#10. I doubt that that’s what they do
Here’s my effort: http://x256.org/~hb/wunderground.r
The only thing I’m not happy with is the way it returns the list, but I’m somewhat constrained by the way R likes to do things.
That was a lot harder than I would have liked, but I learned a lot about R.
Here is Wolfgang’s go at this:
Usage:
dulan< -Wunderground("station/52836", c("2005","2006"))
names(dulan)
plot(dulan$TempMean,type="l")
All the best, you're doing hellofajob kicking a…s you know that? I wish I could be of more help.
Wolfgang Flamme
## Import von meteorologischen Daten aus wunderground.com
#
Wunderground<-function(a,b){
if (exists("mr")) rm("mr") #temporäre löschen
jahre<-b #zB c("2005","2006")
station<-a #zB "station/10113" (Norderney) oder "airport/GMAD" (Agadir)
url1<-"http://www.wunderground.com/history/"
url2<-"/1/MonthlyHistory.html?format=1"
mr<-data.frame(CET=character(0), TempMax=numeric(0), TempMean=numeric(0), TempMin=numeric(0), DewPointMax=numeric(0), DewPointMean=numeric(0), DewPointMin=numeric(0), HumidityMax=numeric(0), HumidityMean=numeric(0), HumidityMin=numeric(0), SLPMax=numeric(0), SLPMean=numeric(0), SLPMin=numeric(0), VisMax=numeric(0), VisMean=numeric(0), VisMin=numeric(0), WindSpeedMax=numeric(0), WindSpeedMean=numeric(0), GustSpeedMax=numeric(0), Precip=numeric(0), CloudCover=numeric(0), Events=character(0))
scanwhat<-list(CET="", TempMax=0, TempMean=0, TempMin=0, DewPointMax=0, DewPointMean=0, DewPointMin=0, HumidityMax=0, HumidityMean=0, HumidityMin=0, SLPMax=0, SLPMean=0, SLPMin=0, VisMax=0, VisMean=0, VisMin=0, WindSpeedMax=0, WindSpeedMean=0, GustSpeedMax=0, Precip=0, CloudCover=0, Events="")
monate<-1:12
tageimmonat<-c(31,29,31,30,31,30,31,31,30,31,30,31)
for (jahr in jahre) {
allurls<-paste(url1,station,"/",jahr,"/",monate,url2,sep="")
for (i in monate) {
thisurl<-allurls[i]
mr<-rbind(mr, scan(thisurl, skip=2, dec=".", sep=",", what=scanwhat, nlines=tageimmonat[i]))}}
mr$WindSpeedMaxm/s
mr$WindSpeedMeanm/s
mr$GustSpeedMaxm/s
mr$TempMax<-(mr$TempMax-32)*5/9
mr$TempMin<-(mr$TempMin-32)*5/9
mr$TempMean<-(mr$TempMean-32)*5/9
mr$DewPointMax<-(mr$DewPointMax-32)*5/9
mr$DewPointMin<-(mr$DewPointMin-32)*5/9
mr$DewPointMean<-(mr$DewPointMean-32)*5/9
mr$SLPMax<-mr$SLPMax/29.921*1013.25
mr$SLPMin<-mr$SLPMin/29.921*1013.25
mr$SLPMean<-mr$SLPMean/29.921*1013.25
mr$VisMax<-mr$VisMax*1.609344
mr$VisMin<-mr$VisMin*1.609344
mr$VisMean<-mr$VisMean*1.609344
mr$Precip<-mr$Precip*25.4
return(mr)}
Small worry with Wolfgang’s script – what happens with non-leap years when February doesn’t have 29 days? I think perhaps you are safe because, although the server seems to return 31 days even for 30 day months, it might only return the appropriate number for February. However, I’m not sure of that, and the files it returns have a comment tag on the last line, so I’m not sure the result will be correct for non-leap years. You’d have to test it, I guess.
I decided to take the approach where I don’t assume anything about the format of the data, other than the column types (I wish I didn’t have to, but the R function don’t seem to be capable of auto-detecting safely, for a reason I can explain but won’t get into here). Surely there must be a more elegant way to concaternate 2D lists than the way I am doing, but I’m not sure what it is.
BTW what’s the R function to rotate a matrix?
#14. The transpose of a matrix is t( ). R is a champ with matrices. You multiply matrices by A %*% B
@Nicholas
I’m well aware of some painful constraints – this woeful script was one of my first R-scripting attempts so pls bare with me, will you? Starting from scratch today I’d probably use seq.Date instead.
Oooops, that should have been “…bear with me”, right?
LOL! PLEASE DON’T!
To read one of the monthly data, I’d be inclined to try the following:
loc<- paste("http://www.wunderground.com/history/station/", station_id, "/", year, "/", month, "/1/MonthlyHistory.html?req_city=NA&req_state=NA&reqstatename=NA&format=1", sep="")
test<-read.csv(loc,skip=1,header=TRUE,sep=",",fill=TRUE)
test<-test[1:(nrow(test)-2),]
Ah, that’s slightly more sensible.
The problem I have is that both read.table and read.csv are by default converting the data into “factors”. If I then try to copy the data into another table, the “factors” lose their association and become integers. I have to specify the column types explicitly to avoid this behavior. Perhaps it is a bug in the version of R I have installed.
Wolfgang, you did a pretty good job. I’m quite new to R too, and it’s taking me a little while to understand how things work in R-land. For this task, I learned about dim() and dimnames() – which let you take a 1D piece of data (list, vector) and turn it into 2D, or 3D, or whatever, as well as assign names to the rows/columns. Pretty handy. It also lets you investigate the format of matricies returned by functions like read.table and read.csv . I’m still not 100% happy with my solution since the matrix I create doesn’t behave exactly the same as the one you get from those functions. But, I like the approach of returning data in a matrix with labelled columns/rows rather than a set of vectors – it seems like exploring that data should be easier and you’re less likely to accidentally introduce bugs.
Thanks for pointing out seq.Date, I will use that next time too! I’m impressed you managed to beat me to a working solution, actually. It took me a while to get anywhere with R at first, because it’s so oriented towards matricies and statistics that the lower level functions are a bit secondary.
Well I checked into my question in #10 a bit more Steve. From what I can see, there is no sensible way to come up with their “mean” value. The March 2007 mean value in the monthly mean dataset from the link you provided for the GHCN data is -0.2C. If you take the GHCN daily data, there is only one set out of the several they use that has data for March 2007 and it is the spotty one you plotted. Taking the average of all the raw data (as described in their note you quoted) gives a mean of +3.1C. Taking the average of all of the max values and the average of all of the min values and then averaging them together gives a mean of -1.5C. Throwing out any day that doesn’t have both a max and a mean in the set and averaging the raw data from the values that remain gives a mean of +2.0C. Finally, taking the weatherunderground data for the month of March 2007, their mean is +0.7.
Using either set of data, I don’t see how it is possible to calculate a mean of -0.2C as they apparently have.
#19 @Nicholas
No need to be impressed because I sort of drew this out of my pocket. I used the concept before teaching some german wind power enthusiasts lessons with respect to energy reliability.
We probably need not dive very deep into R details because it’s different from what most ‘ordinary programmers’ like myself are accustomed to – except for LISP that is.
However it is painfully true that most information about R is about how to deal with data but not about real-world online data acquisition – which I consider as being essential nowdays. OTOH we might be lucky that still so much data vehemently defends against being broadly interpreted.
It appears since 1995 GHCN has been using GSOD data for Dulan. That’s what the ‘S’ flag represents. I did manually check a few max temperatures and they appear to be equivalent to GSOD. I haven’t collated the GHCN file.
The GSOD file for Dulan 2007 has all the Tmin temperatures listed, so I don’t understand why GHCN doesn’t have them all.
The column for Tmean in the GSOD, which includes all readings for the day, seems to me a more accurate way to assess daily temperature.
RE #5 JP, a Feb 07 temperature anomaly map for Alaska is here .
Canada piques my curiosity. Such a huge area with near-normal temperatures seems odd. I’ve been looking for an Environment Canada report for comparison but with no luck so far.
RE #5 & #23. A few Feb 2007 temperatures for stations in Saskatchewan from Enviornment Canada.
Station, Normal(1971-2000), Feb 2007, Difference.
Brandon, -13.8, -17.9, -4.1
La Ronge, -15.9, -20.2, -4.3
Saskatoon, -13.0, -18.0, -5.0
Lloydminister, -12.6, -17.4, -4.8
Swift Current, -9.6, -12.9, -3.3
Regina, -11.9, -16.6, -4.7
Estevan, -10.4, -16.0, -5.6
Kindersly, -11.4, -14.9, -3.5
Another example of conveniently missing data?
David Smith,
What is even odder about Canada is how they have managed to keep all that cold air, that was in the northern United States in February, confined at the border. I suspect the Canucks have developed force field technology.
Dulan data can be obtained from my favorite website Pogoda Rossii (eng. version) since 2000. The data can be obtained by clicking on the Data Source diskette icon. Chose then .zip.
The page of March 9 is here, for comparison.
Dulan
“I’ve got a slightly different question: if I can locate daily maximum and minimum readings for Dulan airport on the internet, why can’t NOAA?”
Someone brought this up to me a different blog Steve and I have an answer for you….
You can’t locate daily maximums and minimums for Dulan on the internet. That’s right you are not reading actual daily maximums and minimums at weather underground. You are reading their predictions. Says so right on their site.
When I googled weather underground and dulan earlier today it said “Please, note this station is not reporting.” I suspect that the same thing will happen often if I was to google at the time Dulan would generally be reporting, or not reporting, its minimum.
When I looked a little further by going to their own wiki-site:
http://wiki.wunderground.com/index.php/FAQ_-_Sources
I found that “weather underground” in fact doesn’t have the missing data: It says that they get weather at many International stations by um… winging it (my words not theirs). They take information put out from the AVN model of the “U.S. National Weather Service’s National Center for Environmental Prediction” and “comes up with” forecasts for 6000 international cities. That is right they “come up with?” Then it says and I quote: “The forecasts do reasonably well for a large number of locations, but do poorly in some locations, particularly mountainous areas. We are developing new software enable us to improve these forecasts in the near future.” So in other words, they are NOT reporting actual weather for most of the international sites. They are PREDICTING it.
Now next I wondered where is Dulan weather station that you have decided to use as an example of the accuracy of weather underground?
The answer Qinghai! One of the most mountainous places in the world – Within the Tangula and Kunlun mountain ranges and on the border of Tibet. Isn’t it isolated mountainous regions exactly where weather underground said that their predictions were poorest? Sure was.
I suspect that can explain the differences between some values reported by NOAA vs weather underground. One is using the actual temperatures and the other is making predictions.
Appears you are wrong. Too bad none of your visiters use such a critical eye as to pick up on it and just assume that the NOAA is wrong.
Hmmm, who is RIGHT, here?
I also compared the two sites that are actually reporting weather for Dulan every 3 hours. The one is weather underground which Steve was using the other is Russia’s Weather Service which was brought up by EW. Now if they are reporting the weather then their numbers should match as they are just inputting data. If they are predicting the weather when Dulan is not reporting then their numbers most likely won’t always match as I am sure they would use different methodology to calculate the weather. So lets see:
March 9th 2007 as EW brought up:
RWS – Mean -4.4C; Max +1.4C
UW – Mean -6C; Max -2C
Clearly there is a difference.
If nothing else, I try to encourage people to cast a critical eye on everything. That’s the purpose of “audit” and verification. I don’t claim to be infallible. I don’t pretend to be an authority on Dulan airport and it’s possible that I’ve made a mistake here, in which case I’d be happy to correct it. However, I’m not convinced from what you say that my comment is erroneous. Your source says:
The situation at their website seems to be a little different right now: their website is displaying current conditions for their site, but the “current conditions” link says that “This station is not reporting.”
It’s hard to deduce what’s going on with such contradictory information. It’s almost like climate science – anything’s possible.
BTW maybe you could comment on a more substantive issue: if Dulan airport is so erratic in reporting now, why are all the reports during the Cultural Revolution and all that turmoil, regular like clockwork. Is it possible that they filled in some of this data the way that you say that wunderground is doing right now?
Steve, I can’t say for sure, but my suspicion is when Mao was leader something was reported whether it was accurate or not, same as most things in Stalinist USSR. After the end of the cold war, I suspect that the appearance of communist superiority was no longer a priority. But again that is just a guess.
#31. I think that this is a plausible explanation. ONe of the reasons for looking at the Russian and Chinese stations was that the Stalinist and Maoist period records were the major evidence against UHI in Jones et al 1990 – evidence which seems that one should use cautiously. I liked the story from Russia where thermometers were used as weapons by gangsters (they poured mercury into the ears of sleeping victims).
Why don’t you see what you track down about what wunderground actually does to obtain their “Current conditions”. Something isn’t right.
Also, while you quoted my correctly. In the following sentences, I said (and the update is from a long time ago):
So the post really left off with a question. If the answer is that wunderground plugs forecast values rather than actuals (despite the statement in their wiki that they do not report from stations with missing values), then that is an answer to the question. You might clarify at another site which you’ve presented this supposed gotcha, that the post ended with a question, and a reasonably posed question.
Steve, I have sent an email to weather underground, I will post any reply here as soon/if I get one, which I expect will take several days.
Of course my other question is how Russia’s Weather Service and weather underground can have such different results for Dulan as I pointed out for March 9th. I see no way that both of them could be using only actual reported data.
I did get a response from weather underground, but it was most unhelpful. It simply gave me a link to a wiki-page with both Steve and I have already read.
When I check the site for Dulan I still find that it is not reporting around half the time, and the differences in results for RWS vs WU leave me with little confidence that Dulan is reporting weather consistently.
#35. There’s a big difference between the regular as clockwork reporting during the Mao years and at present. What credence would you put in the old measurements? Or for that matter in the modern measurements when they are so irregular?