I pointed out the hot spot in northern Minnesota in the contoured USHCN trends. There was a really interesting discussion of Minnesota sites by their state climatologist, JAmes Zandlo, in 2000, a couple of years ahead of Roger Pielke Sr’s investigations in Colorado. He showed the following contour for Minnesota (which prompted me to do a more general contour), the time-of-observation adjusted version is below, observing:
From Leech Lake Dam to Walker to Park Rapids (a total distance of less than 50 miles) the apparent changes per century are [TOBS – 3.19, 1.34, and -0.53; filnet adjusted – 2.92 to 1.57 to 0.36] respectively; … While it is generally found that global warming will be more pronounced in northern areas, it is difficult to understand how such a strong local variation in warming could be due to global climate change’.

Contour map of Minnesota USHCN TOBS trends. Leech Lake is the western station in the hot spot and the others are in a line to the SW. Other stations in the hot spot are Leech Lake and Pine River; Winnebigoshish is just to north (1.20)
Headwaters Corps of Engineers Sites
Zandlo did a thorough investigation of the sites, determining that the three sites in the hot spot were all at dams constructed by the Corps of Engineers in the early part of the 20th century. He reported:
The only 3 sites that have trends of +3 deg/century or more in the nonhomogenized data sets are all roughly within 50 miles of each other, all started in 1887, and all have been operated for the entire period by the Corps of Engineers at dam sites. It can be seen from the map HCN +’ Trends’ that all but 1 of the 6 stations with trends of 1.5 degrees or greater are all tightly clustered in that same vicinity. See Figure Map HCN +’ Trends’.
The Corps of Engineers sites in this northern Minnesota neighborhood all have zero or near zero homogenizing corrections for their entire records. The notations in the History files typically show station start and then no other entry at least until the 1950s.
From interviews with people familiar with the area, he reported the following:
– logging in the areas in and around the headwaters’ dams was already heavy early in the 2nd half of the 19th century and peaked early in the 20th century
– dams increased Leech/Winni/Pokegama areas from 173/117/24 sq.mi. to 234/161/45 sq.mi. for a 126 sq.mi. total increase from pre-dam conditions
– 1900-04: rotting dams were reconstructed, riprapping done at Winni
– 1902-04: dam tender residence at Leech built. Later, service building, barns, etc. were added. Apparently extensive floodplains no longer flooding (because of dam control).
– Congress approved money in the early-teens for straightening and improving’ the channel of the upper Mississippi River – work progressed into the 1920s
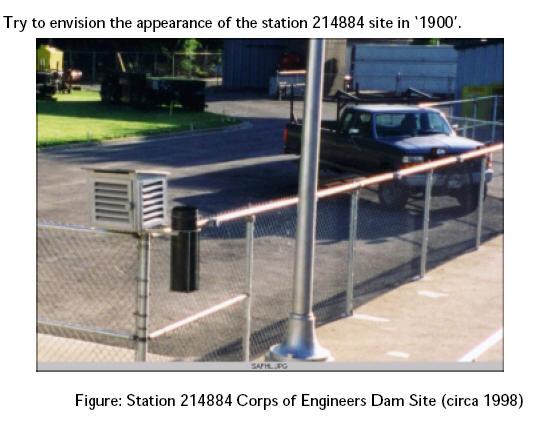
Zandlo showed the following picture of one site, asking the musical question:
What would happen to observed temperatures if the Weather Service required that each COOP site be paved with asphalt?’
Leech Lake
There are notes about Leech Lake in the Appendix, including the following:
Preliminary examinations of other stations indicates that this pattern of large trends relative to non-HCN (typically more distant) stations and more modest trends relative to an HCN neighborhood appears to be most pronounced for the Corps of Engineers (COE) Headwaters’ stations…. Recall that most COE have essentially empty histories in the early years.
One relevant but difficult to use detail was a note found in the Leech Lake file which indicated that for long strings of days both the minimum and maximum temperature were identical at Winnibigoshish and Leech Lake dams. An exhaustive search for days with identical min and max values suggests that data sharing’ has occurred at other times for those two stations (see graph below).
July 1955 “All equipment had been painted this spring. The Thermometer support was repaired. Recording gage cleared and calibrated. A tree SE of the recording gage is getting quite big. I spoke to the observer about this and they are planning on doing some work around the gage.”
May 1964 Substation Inspection. “Exposure of the precipitation equipment at this station is [still?] poor due to tall trees, this was discussed with the obsvr, he advised me that he and his men had planned on moving the equipment about 100 feet west to get it more out in the open. He was asked to remember the date he moves the equipment.”
Sep 1966 Substation Inspection. “CRS is painted a silver color.”
Sep 1967 Substation Inspection. “Instrument shelter still painted a silver color. … Removed ⻠deg from the minimum thermometer. They had relocated the weather station equipment some time ago to avoid tree growth. … He advised that they had relocated the equipment the equipment some time ago, but could not remember the exact date. … began applying [white] paint to the shelter while we were still visiting
Oct 1968 Substation Inspection. “CRS found to be facing toward the south. Turned CRS to face north.”
Jun 1971 Substation Inspection. “CRS is in bad shape. Rotted and broken in spots. CRS is set in concrete. When new CRS arrives observer will install. He will break up and remove concrete at that time.”
Jan 1977 note in paper history file: some daily min and max data are identical to Winni
June 1983. First new site map since 1983[SM-?]. It appears that CRS has moved from N of precip in 1967 to East of it in 1983.
Here is a plot of the various versions for Leech Lake (Giss adjusted in bold red.) Thee are only two values for 2006 (which account fro the high close). Why are there no values after Feb 2006? Only the Shadow knows.
Pokegama
About this station in the hot spot, Zandlo observed:
Pokegama is the station with the largest slope among station time series corrected just for time-of-observation but it is essentially unaffected by the homogenizing process. It is perhaps germain to point out that Pokegama formerly held statewide daily record cold of —59 (Feb 1903). However, when data was examined at nearby stations, all were 17 to 21 deg warmer (Kuehnast, 1976) for that date. Notes on forms by editors (State Weather Service?) as late as 1905 state that minimum temperatures are considered unreliable’. Kuehnast believed that the thermometer at Pokegama was an exposed thermometer’ as called for by mid-19th century Smithsonian instructions.
This site has no readings since 1989 for the months October-April and for 2005 only has 2 months of readings. Hansen and Karl were not cracking the whip on their reporters, that’ s for sure.

Pine River
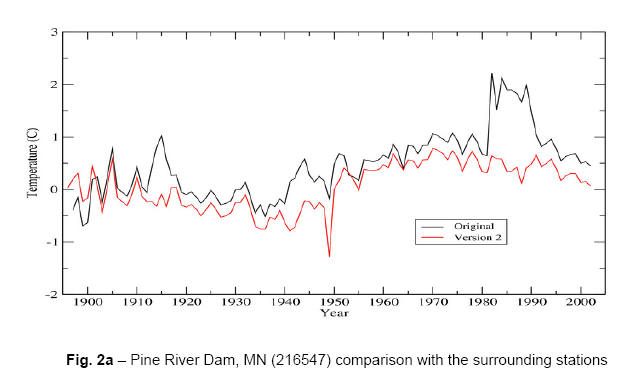
Pine River is not specifically discussed by Zandlo, but oddly enough turns up as a type example in a preview article of the new USHCN calculations to be unveiled in July 2007 as an illustration of the new homogenization method. The article illustrates the old and new Pine River versions as below, with the new version notably lowering values in the 1980s.
For comparison, here is a compilation of the existing versions with GISS once again going only to Feb 2006 and USHCN as usual ending in Dec 2002. The closing uptick reflects only two months.

So what are we to make of this three sites? Zandlo identified them as anomalous but sort of left things hanging. No explanation is provided for the “gradient” between Leech Lake and Park Rapids, which prompted Zandlo’s discussion. Here’s a graphic for PArk Rapids which has a similar shape as Leech Lake but without the long-term increase in temperature:
It is inconceivable that there is a climatic reason for the difference between Leech Lake and Park Rapids? Is one “right” and the other “wrong”? How would one tell? Is it OK to just throw this data into a hopper and hope it’s OK? Or can non-climatic biases from these sites impart a bias to the overall record?


28 Comments
Well, lets see what we have for Leech Lake Dam in 1998
1- Nonstandard screen size. I’ve never see one like that before
2- Asphalt
3- Metal fence and street light standard (this is a lights=1 station for sure)
4- convenient parking
And unbelievably “CRS is painted a silver color.”
I guess I’ll have to update my whitewash -vs- latex paint test to include “Rustoleum”
An exhaustive search for days with identical min and max values suggests that data sharing’ has occurred at other times for those two stations
I asked one observer what they did if they “missed” some readings, such as went on a 3 day weekend. Answer: We used the published highs and lows from the local newspaper or the TV”.
But wait! It’s not important, since the science is settled and everything. Who cares if any of the data is accurate or anything silly like that.
This is really puzzling. The three dam stations exhibit surprisingly constant (monotonic?) increases. No sudden changes like one would expect when asphalt was installed. No wonder Zandlo (and Steve M) left the matter “hanging.”
Of the USHCN with GISS lights=0, here are the top 20 for 20th century trend in the USHCN adjusted version. Leech Lake and Yosemite Park Headqtrs are both on the list.
name state
1058 HANKSVILLE UT
74 INDEPENDENCE CA
34 SELIGMAN AZ
885 MCKENZIE BRIDGE RS OR
108 YOSEMITE PARK HEADQUARTERS CA
543 FORKS 4NNE MT
559 MEDICINE LAKE 3SE MT
1071 PANGUITCH UT
452 LEECH LAKE DAM MN
574 ALBION NE
1054 ESCALANTE UT
1122 CONCONULLY WA
421 CHATHAM EXP FARM #2 MI
878 HEADWORKS PORTLAND WTRB OR
58 BRAWLEY 2SW CA
540 EKALAKA MT
596 HAY SPRINGS 12S NE
718 PENN YAN 8W NY
542 FLATWILLOW 4ENE MT
563 NORRIS MADISON POWER HOUSE MT
Since they mentioned paint, I thought I’d share this experiment with everyone. You may recall that I’m conducting an experiment measuring the differences in temperature imparted by different coatins on the Stevenson Screens. Early screens were spec’d to have whitewash. I made up a batch of whitewash based on a known historical formula and setup a test rig:
Here is one day’s worth of plotted data related to whitewash -vs- latex -vs-
bare wood I have three weeks of this logged data and they all look pretty
much the same. Russ Steele was kind enough to plot the data for me for a day, May 21st.
These are temps recorded in a 1/4″ borehole in the center of the wood slat
along with air temperature from an aspirated stacked plate IR shield. The
datalogger I used is NIST calibrated, and the probes are NIST calibrated.
Error is 0.1 degree F or less, and they are quite linear.
I have made it available on
http://www.surfacestations.org/downloads/paint_test1.zip These are all comma
demilited text files, suitable for import into R or Excel. This is three weeks worth of data.
The columnar format is:
date, time, Air Temperature, Bare Wood Temp(control), Latex Paint Temp, Whitewash Temp all in degrees F
I have my three new Stevenson Screens in, so I’m going to switch now from
wood borehole tests of the painted slats to actual air temperature tests in
three standard Stevenson screens. I expect the temperature differences to be
smaller, but still measureable.
I have aquired the exact formula for lime based whitewash and the exact
materials from a chemist at the National Lime Company. They are watching
closely too becuase whitewash appears to be a superior coating for buildings
to create energy savings for air conditioning.
Will advise when the new experiment is up and running, it will be live online.
RE4 Are listed below are on http://www.surfacestations.org now
MCKENZIE BRIDGE RS OR http://gallery.surfacestations.org/main.php?g2_itemId=1513
YOSEMITE PARK HEADQUARTERS CA http://gallery.surfacestations.org/main.php?g2_itemId=710
HEADWORKS PORTLAND WTRB OR http://gallery.surfacestations.org/main.php?g2_itemId=1499
Re #3 jae, changes in nearby trees and shrubs could cause decadal monotonic changes in temperature. Trees and shrubs grow slowly but steadily, affecting both radiation and wind nearby. I suspect there is a temperature maxima located somewhat outside the canopy, where the tree does not affect incoming radiation but does partially block exiting IR and does reduce wind.
Experiments like what Anthony is doing, but with more points and under more conditions, could probably demonstrate the effect of vegetation proximity on near-ground temperature.
5: It’s interesting how much lower the temps are in the Stevenson Screens at night. What gives here?
Here is a Google Earth link to the area.
http://maps.google.com/maps?f=q&hl=en&q=47.2467N+94.2228W&ie=UTF8&ll=47.262922,-94.194717&spn=0.217148,0.485458&t=h&z=11&om=1
It appears that there is a large deforested areas near the sensor…looks like possibly tree die off due to rising water levels, though not quite sure. Could be that dam created marshy area to west os sensor. It appears the dam was created around 1948
RE: #5
I would love to see a similar comparison of Stevenson screens: weathered, new, and one with several coats of paint. A standard temp based on a forced flow apparatus would be nice to in the mix.
Is there a way to only see temperatures on days with a certain minimum wind speed – and compare the difference to rate site quality?
BTW- white paint does not exactly have low emissivity. Picking a best surface is complicated. TiO2 (the stuff that makes white paint white – used to be lead oxides) has an emistivity of 0.77. White paint with :
a = 0.28
e = 0.87
a/e =.32
Obviously does not have an A/e of 1.
It is also important to note that painting the inside of screens can also make a difference.
Other emissivities of interest:
Wood – planed oak 0.90
Snow 0.85
Water 0.96
Dry soil 0.92
Wet soil 0.95
Brick – common 0.93
Concrete 0.92
Aluminum Polished sheet (I would guess aluminum foil would be similar) 0.05
Emissivity changes with temperature a bit. These numbers are from Infrared System Engineering by Richard Hudson JR. I did some work with non contact temperature sensors that dealt with IR draft.
Two things to keep clear when thinking about emissivity, it is commonly under stood that emissivity = absorptance. This is just not true for solar radiation. (Comes close for some materials, but not for others. Polished aluminum has an a/e of over 14!)
Also, the darkness of a color is not a good judge. I quote from Hudson’s fine book:
White Paint a = 0.28 e = 0.87 a/e =.32
Sherwin Williams (A8W11)
Concrete a = 0.60 e = 0.88 a/e =.68
Aluminum foil a = 0.15 e = 0.05 a/e = 3.00 (aluminum foil get very hot in the sun for this reason)
Asphalt a = 0.9 e = 0.95 a/e =0.95 (not sure I believe this number?)
So the best selection of a surface for a screen would be a low e value combined with a/e close to 1. The understanding of emissivity was not so good when the standards for screens was developed – during the space program it became critical to have craft with an a/e close to 1 and low emissivity so as to not cook or freeze the electronics.
I won’t get into CO2 and Water vapor here – but rest assured it gets even more complicated as a mixture of gases and the effect of coupling of emission and absorption bands. To ignore human changes of water vapor is just insane.
In the end, it is foolish to list ground readings with so many confounding variables proof of anything. Much better data can be found from satellites as seen here:
Where is the hockey stick?
Lost link.. hmmm
http://xtronics.com/reference/christy-spensor/global.png
>Sep 1966 Substation Inspection. “CRS is painted a silver color.”
>Aluminum foil a = 0.15 e = 0.05 a/e = 3.00 (aluminum foil gets very hot in the sun for this reason)
I remember my father using a lot of ‘aluminum paint’ in the 1960s. It had a silver color…
RE: #4 – (s)Well, ya see, “lights=0” means none of those really bright lights or massive LCD screens, ala Times Square. It doesn’t really mean, literally no lights. Then of course, one must consider the question of how we define the word “lights.” Do we literally mean, any man made source of light, or other electrical device? Not unlike the profound question of how one defines the meaning of the word “is.” (/s)
Running through Anthony’s paint_test1 data I get
mean daily max latex_temp – whitewash_temp
= 4.1 F
mean daily min latex_temp – whitewash_temp
= -0.8 F
mean daily latex_temp – whitewash_temp
= 1.2 F
mean min latex_temp
= 53.5 F
mean min whitewash_temp
= 53.9 F
mean max latex_temp
= 96.8 F
mean max whitewash_temp
= 93.5 F
The spread for mean min/max temps for latex paint is 43.3 F; the spread for mean min/max temps for whitewash is 39.6 F.
“I asked one observer what they did if they “missed” some readings, such as went on a 3 day weekend. Answer: We used the published highs and lows from the local newspaper or the TV”.
That’s really just human nature, if oversight isn’t diligent. The guy did the best he could within reason and in the context of what was actually expected of him. Now think about the same guy way out in Siberia in the winter in the 1930s. The 1980s. Or Central or East Africa during rainy seasons. Heck, nobody’s watching, let’s see what was the temperature yesterday…. Oh and my communities food and supply rations are increased when it’s colder, so let’s just round this down a little… Any of the foregoing seem possible in the context of what we are seeing in California or Minnesota, let alone Magaden or Olduvai Gorge.
Hey!
Just Monday Night I drove through Pine River, past Leech Lake on my way to Warroad, going past the western shore of Lower Red Lake. On my way south, I drove past the eastern shore of Upper Red Lake.
I’ve been to Park Rapids, too…
I don’t have much “scientific” to tell about this part of north-central MN. I’ve lived in the area for 7 years and the locals all say they don’t remember it this hot. The “old timer”, though, all tell stories of the past when for a few years at a stretch it was “much hotter.”
RE 16, Paul could you go to http://www.surfacestations.org
download the “how to” guide and site survey form and do station surveys on these locations?
It would be immensely helpful.
I converted the minute readings from one week of Anthony’s data into anomalies from the mean hourly air temperature. So the mean hourly is the zero line. I’m curious as to why the anomalies go negative. Dew??
RE18, “I’m curious as to why the anomalies go negative. Dew??”
Remember I’m measuring the temperature of a solid, not of a gas. I expect this is caused by IR emanating from the solid (wood slats) causing a cooling, much like IR from the ground on a clear night will chill the ground, and air near the surface to form fog.
Thanks Anthony,
I think I follow. Looking forward to the Stevenson Screen tests.
The air temperature will be different because of the difference in height.
In looking at the map I noticed the other hot spot in NW Minnesota, which I take to be Hallock. It looks like the station is at the
Municipal Airport plus there appears to be a water treatment site nearby. Anybody know anything more? Hallock according to is an unlikely site for any UHI effects, but clearly there is a chance for micro-site effects.
By the way the report makes fascinating reading. The authors appear to be somewhat guarded in their acceptance of AGW. They also seemed to have been engaged in a similar station by station analysis of other States. Are they still active in the field?
RE #17:
I can, but can’t promise how soon I might get there… Very interesting.
This is interesting. The coatings slightly increase the radiational insulating effect of the bare wood. The temp changes are “forced” from outside the box (radiational), so the wood is colder (night) or warmer (day) than the thermometer itself.
I don’t know if the temp differences are enough to significantly affect the thermometer readings tho.
#22. Here is a plot of the Hallock data. There have been no measurements there since 1996. “Adjusted” USHCN data is plugged for the last 11 years!
Steve:
That was quick. The last 11 years of data certainly modifies any 20thC trends. It begs the question as to the source of the adjusted USHCN data. Does the relative geographic proximity to the other hot spot play a role? Does teleconnection occur through the adjustment process in this case?
#26. It’s hard to tell how the adjustments work operationally without playing with the code.