As noted before, climateaudit readers have helped UCAR find the lost civilization of Chile and today, we are happy to report that we have helped NASA find the lost city of Wellington NZ.
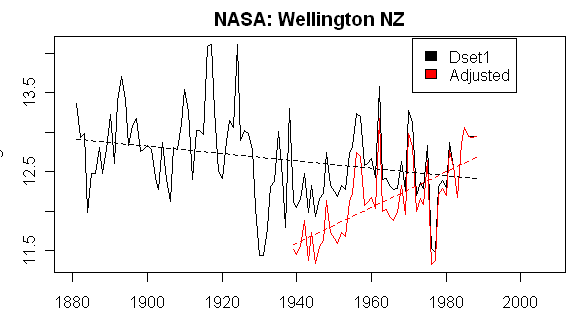
NASA’s records for Wellington NZ were mysteriously interrupted in 1988 – an interruption so severe that we assumed that Wellington NZ must have been destroyed by Scythians. We are happy to report that Wellington NZ is still in existence.
This is not the only good news. We are also happy to announce that there is still a functioning meteorological service. Not only that, but can announce contact with the indigenous representatives.
Although NASA (and NOAA) appear to have lost contact, an indigenous NZ climate scientist familiar with the lost records has contacted climateaudit. I have passed this exciting news on to NASA and urged them to restore contact with their lost cousins in NZ.
Previously, we had shown the following graphic showing the termination of NASA records in 1988 and the adding of a substantial trend to the Wellington NZ record in the Hansen adjustment.
David Wratt of NIWA, the indigenous New Zealand meteorological authority, wrote to CA as follows:
It is time to put on record “ once again “ what some contributors here already know: Fitting a linear trend to the entire unadjusted NASA GISS plot for Wellington is physically meaningless. This is because as time progresses this unadujsted plot uses measurements from different sites at different altitudes.
Much of the data used by GISS comes from the site at Kelburn, which is in a park at about 125m above sea level. This data set does not start until January 1928. Before this, the Wellington measurements were taken much closer to sea level. For example from July 1912 until December 1927 they were from a site in Thorndon, at 3m above sea level. As you know, there is a drop off of temperature with height which occurs (on average) in the atmosphere.
We have made this point already to some people who continue to publicly misinterpret the unadjusted NASA GISS plot for Wellington in this way.
I should also mention here that there is a further data set from measurements 4 m above sea level at Wellington Airport, commencing in January 1962.
To find the real trend, you must make appropriate homogeneity adjustments which take account of the differences in height between the various measurement series and also use the time when the Kelburn and Wellington Airport temperature series overlap. When you do that, you will find a long-term warming trend for Wellington through the 20th century.
It is interesting that NIWA should be so alert to perceived mis-steps at Climate Audit and yet have never taken the time to inform Hansen that he has erroneously failed to update his NZ records or, as we shall see below, to question Hansen’s “adjustment” of the Wellington records. Although Wratt commented that fitting a trend to the NASA unadjusted record was “meaningless”, I note that he did not comment on whether there was any meaning to the “NASA adjusted” record. I presume that this was out of “professional courtesy”.
Separately, Warwick Hughes emailed me that New Zealand station records could be downloaded from here , a service which has been free since August 2007. The data seems to be available only in an inquiry form, so scraping will be required at some point. I manually checked Wellington NZ and obtained information for the following 7 separate identifications:
Wellington, Kelburn Aws 25354 -41.285 174.768 125 G Metsrvice
Wellington High, D Pk 3382 1427H -99941.263 174.784 120 G N/A
Wellington, Knowles Ob 3383 E14270 -99941.283 174.783 27 W N/A
Wellington,Kelburn 3385 E14272 -99941.286 174.767 125 G Metservice
Wellington,Bowen St 3389 E14276 -99941.283 174.783 18 W N/A
Wellington,Thorndon 3391 E14278 -99941.283 174.783 3 W N/A
Wellington,Karori 3392 E14279 -99941.284 174.737 152 G N/A
Wellington,Buckle St 3431 E14370 -99941.300 174.783 34 W N/A
Wellington Aero 3445 E14387 -99941.322 174.804 43 G N/A
Here is a first cut comparison of the two NASA series (black) to the 7 NIWA series (red.) A couple of immediate observations:
the GHCN-NASA “raw” record is not the same as any of the NIWA records, so some sort of unreported combining of stations has already taken place in the GHCN-NASA “raw” record
there are indeed NZ records more recent than GHCN-NASA’s 1989 termination

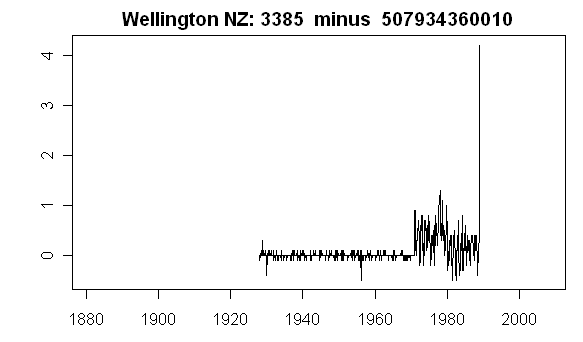
Parsing the records in detail, here are some specific comparisons of GHCN-NASA versions to NIWA versions. The figure below shows that the GHCN version 507934360010 is pretty much identical to Kelburn 3385 from 1928 to 1970. However, the GHCN version has values prior to 1928 and it differs from the Kelburn version after 1970.
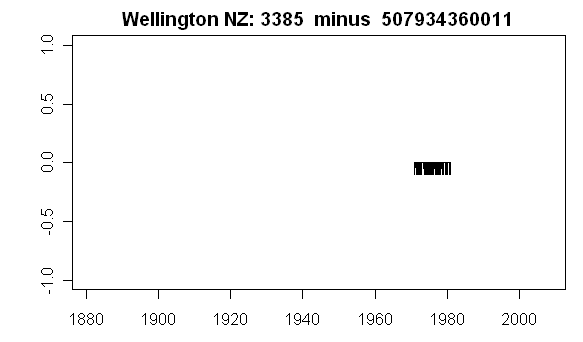
Next here is a comparison of a short GHCN version 507934360011 to Kelburn 3385. These two versions are essentially identical for the period 1970 to 1980. Thus we have the odd situation, where GHCN-NASA switches provenance from Kelburn to some other station in 1970 (and I can’t identify the other station so far) and puts the continuing Kelburn station as a different version. Bizarrely, Hansen will then calculate a “Hansen-bias” between the two on the basis that the 1970-1980 portion of version 0 is the continuing Kelburn series, whereas the 1970-1980 Kelburn series is in the other version 1. One sometimes gets a little dizzy.
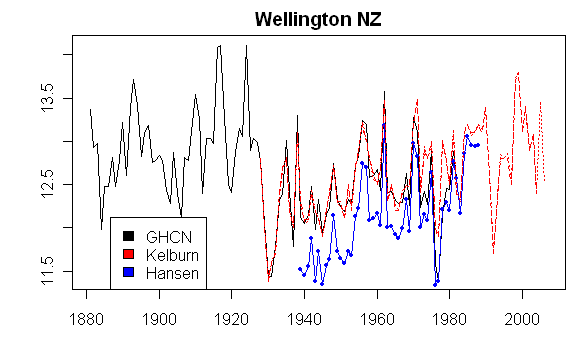
For some inexplicable reason, Kelburn 3385 after being a continuous record since at least 1928 is discontinued under that identification in August 2005. A new station Kelburn Aws 25354 has a short overlap and is within a tenth of a degree in the overlap. As a quick representation of Wellington, here is a plot of the GHCN-NASA version (black) against the average of Kelburn 3385 and Kelburn Aws 25354.
Update: Nov 2009, NIWA adjustments:

End Update.
What can we conclude from this? First, GHCN has combined stations that are not homogeneous. NIWA says that, properly homogenized, the stations show a warming trend. One would certainly expect that. Indeed, there’s no doubt in my mind that the late 20th century is warmer than the 19th century. But why is GHCN-NASA using different stations as though they are one? And in this case, why is one version split into two parts and then a different station spliced into version 0 – what a mess. Where did the early portion of the NASA record come from?
And something that the NIWA spokesman did not comment on: what of the Hansen adjustment? The NIWA spokesman, said with an almost Gavinesque sigh, that
It is time to put on record “ once again “ what some contributors here already know: Fitting a linear trend to the entire unadjusted NASA GISS plot for Wellington is physically meaningless.
However, he didn’t comment on the NASA adjusted version. If one is allowing for urbanization in Wellington for the period since 1928 (presuming a non-homogeneity at 1928) to the present, then there is no physical theory under which the adjustment should reduce earlier measurements as Hansen has done. Exactly how Hansen’s algorithm effected this reduction still remains somewhat of a mystery (which we are working on). Whether this particular Hansen error, whatever it is, creates an overall bias also remains to be determined. But the adjustment makes no sense in this particular instance, so there is obviously something wrong somewhere. It would be nice if, just for once, someone like DAvid Wratt of NIWA, could simply agree about something like this.


107 Comments
My guess is that the Kelburn 2005 “split” represents a changeover to an Automated Weather Station.
It’s amazing how much analysis has been done apparently without even spot checks of the underlying data by humans.
Wratt appears to like hockeysticks and the same type of photos as Gore.
Re #2. According to Mr Wratt’s presentation, slide 8, all continents except antarctica have warmed. How come he knows where Waldo has been hiding?
RE: #3 – Completely bogus temperature history, totally underreports the 1930s and overreports the time since the late 1950s – early 1960s. But hey, it’s Climate Science ….
Just an observation:
On teh last graph, it appears Hansen’s plot eliminates (or adds?) a bias around 1980. This either a) raises the current temp, or b) lowers the historical temp. Each having the same effect of showing a warming trend through the 2nd half of the 20th century.
Why am I not surprised?
I see a warming trend from about 1920 to the end of the final graph, but I do not see a warming trend from 1900 to 1999. What am I missing?
I cant speak intelligently about Wellington, NZ. However, in my hometown 4m above sea level is always within less than ¼ mile of the sea. 125m above sea level is at least 4-5 miles inland. Ocean water affects air temperatures around here very dramatically even over short distances of just a mile or two. Perhaps Mr. Wratt has already done an experiment by placing two identical sensors at the former and current locations so that he can be sure that an adjustment for height above sea level at his location over-rides any needed adjustments for proximity to ocean water. However, in my hometown I would not be surprised if a positive adjustment for the elevations stated by Mr. Wratt would not be actually be backwards because of the thermal effects of seawater.
#7 4m is always within 1/4 mile of the sea –
There is an uptrend in the minima from ca 1882 to ca 1919, and a similar trend with about the same slope fro ca 1939 to 1970. If one eliminated the big downward discontinuity that started about 1927 by joining these 2 trends, leaving a minimum at ca 1930 that is clearly below the trend line, one might have a reasonable correction for the relocation to higher elevation. Interestingly, as expected by AGW theory, there would not be much trend in the maxima. Mr Wratt’s statements seem fair.It would be nice if he would supply the homogeneity adjusted data/plot. Murray
RE: #7 – In Marine West Coast and Mediterranean Climates (the latter, in the case of exposure to cold oceans) proximity to the water lowers summertime highs and in certain cases, summertime lows, versus places further inland. In winter, the more coastal places will have both higher highs and higher lows than places further inland.
NZ population statistics, kudos to Jan Lahmeyer
http://www.populstat.info/Oceania/newzealt.htm
re) 10
gee, maybe looking at the monthlies might provide some sort of homogeneity test?
10 SteveSadlov says:
September 25th, 2007 at 1:38 pm
So, can anyone say anything definitive about yearly mean temperatures for some particular town on the ocean without specific consideration of that particular location, including how many months have winter-like trends, how many months have summer-like trends, predominate currents, etc.? Would something as simple as a one-size-fits-all adjustment for height above sea level be sufficiently accurate for searching out changes in temperature trends at the level of precision under discussion? Is it known to all work out in the yearly mean for every ocean front town in the world, or is that just an assumption?
Wellington NZ has fairly steep terrain, one can get to + 125m within 500 m of the sea in many places. Kelburn is a suburb and relatively inland, probably within 2 km of the harbour. Kelburn is probably a good deal more sheltered.
Over the period covered, the population of Wellington will have increased enormously, probably something in the order of 3 – 6 times. Using the Torok UHI results, this should give a significant UHI correction although this could be mediated by the placement and by the strong local effects, Wellington is a notoriously windy area. The airport in particular is placed in a narrow area between the open sea of Cook Strait and the harbour, very open to the prevailing West/South-West winds.
You may want to consider making some trend comparisons with the air temperatures being reported by ships in their surface marine observations in the same and adjacent geographic areas. One of several datasets which may be useful in doing so is:
Since Wellington is an urban site, its trend is adjusted to match surrounding rural sites. A quick search at GISTEMP shows four rural stations within 1200km of Wellington.:
Hokitika Aero 507936150000 (353km away)
Whenuapai 507931120000 (503km away)
Whenuapai 507931120001 (503km away)
Kaitaia 507930120000 (699km away)
Chatham Island 507939870000 (765km away)
Records from all of these stations stop after December 1991. As I understand it, GISTEMP throws out any urban stations that can not be corrected by rural neighbours. That probably explains why Wellington data is not used anymore, but not why it stopped in 1988 (instead of 1991).
Whenuapai and Kaitaia have sparse records with many missing months.
Hokitika Aero and Chatham Island have long records with few missing months. The latter two show a strong warming trend from 1940 onwards (the period of SteveMc’s original plot here). That probably explains why GISTEMP adjusts Wellington to show a warming trend.
I’m not saying it’s the right thing to do, but it does seem to match the GISTEMP algorithm as I understand it.
Whenuapai is an ex air force base and I think only recently decommissioned. records should be A1 here.
Re #16:
Perhaps this is related to the 2/3 of the record length test by Hansen? If there are 14 years of data prior to 1991, then the 2/3 rule applies up to 1998, doesn’t it? Just a thought.
Steve S and jcspe,
I believe that any assumptions about the effect of altitude when sites are near large bodies of water (particularly bodies of water which are deep very close to shore) must be verified experimentally. Microclimes impact local temperatures around here (California’s Cenral Coast) to such an extent that assumptions that temperature decreases with increasing altitude would more often than not be wrong.
Whenuapai is 500km north of Wellington, ina predominantly N-S oriented country.
It’s actually just north of Auckland and in a completely different climate zone from Wellington (hint – it snows in Wellington). Kaitaia is even further north, near the top of North Island.
To a New Zealander, the idea of using Whenuapai, or worse Kaitaia, to adjust Wellington temperatures seems absurd.
cheers,
Robert
Sorry for my usual shorthand, my statements about marine influence and its effects on temperature were based on a mythical semi infinite near sea level plain. Clearly, altitude would have its own effects as well.
Steve,
That’s entirely OK. I do not seem to be able to spell “Central.”
Re: 20
Yes. Look at a map and see that NZ is sub tropical at top of North Island and Alpine on South Island. Start at the top and you can feel the tenperature change as you drive down. To use Kaitia to adjust Wellington IS ABSURD.
Most of the urban growth in Wellington in the last 50 years has been out in valleys 10-30km away to the north west and north east. There is still a significant greenbelt between Wellington and these other urban centres. The predominant wind direction is actually northerly http://www.wwa.org.nz/Weather/How%20windy%20is%20Wellington.htm However, with the very steep topography, there are a lot of micro-climates. Whenuapai is not only in north Auckland, it is also very suburban and has been that way for the last 20 years. Hokitika and Chathams are is the only sites on the list that have not significantly changed.
With regards to distance from the coast, the weatherstation is at the top of the cablecar run. The bottom of the run is Lampton Quay, which was the waterfront before the 1855 earthquake, though reclaimation has pushed the sea edge another 500m further out.
RE: #20 – Wellington climatologically resembles Portland, OR (or even arguably, Seattle, WA). Some of the places in the north more or less resemble Northern Cal. Most of the more coarse climate classifications show NZ as Marine West Coast from end to end (think of a similar span from say, just south of Santiago Chile down to near Tierra Del Feugo, or, from north of SF up to SE Alaska). Perhaps. in terms of NE Pac analogues, some classifications show the Mediterranean – Marine West Coast Boundary just north of SF, Cal, where it intersects the coast then wedging inland, poleward, from there. Others show a more latitudinally defined boudary further poleward. In truth, there is no particular boundary between Marine West Coast and Mediterranean, it’s a subtle transition. I would argue that if one excepts a set boundary, then that boundary will move poleward and equatorward with ENSO/AO, and other variations, over time.
I have had the pleasure of two visits to NZ, 1983(summer) and 2001(winter). The preceding comments sum up my concerns of using rural sites up to 1200 km distant, and two climatic zones removed, to “correct” data. Hokatika is definitely rural, exposed to the Tasman Sea on the north-west coast of the South Island and across the north end of the Southern Alps from our problematic Wellington. As chris m #24 mentions the predominant wind at Wellington is northerly, off of the bulk of the North Island. The South Island has a rainfall profile like the West Coast of Canada; rainforest and very wet (Hokitika) north-west coast with glacier-filled valleys along the spine of the Southern Alps and a rain-shadow to the east. Predominant wind direction carries the moisture from the Tasman Sea dumping over the Alps and dry winds scour the Canterbury Plains.
Chatham Island? That is absurd!
Either of these locations have as much to do with Wellington’s weather as Medicine Hat does to Vancouver!
Yet more evidence that the “Because-I-said-so” school of thought in climatology is a growing phenomenon.
Hope this is on topic for all of your data miners. There is a fantastic new data manipulation program that is being open sourced by NASA Ames that enables the mining of vast datasets in an intuitive and easy manner. I think that it would be very applicable to some of your efforts here.
Information can be found at:
astrophysics.arc.nasa.gov/viewpoints
I have no connection with this other than meeting the guy that wrote it last week and being blown away with what he has done with the last 100 years worth of global earthquake data. This led me to thoughts about temperature data.
Enjoy!
Please ignore my last post. It was meant for the Juckes thread.
Long day.
# 2, 3 — The plots on Wratt’s slide 8 reproduce a figure from the IPCC SPM that, typically, shows GCM projected temperature trends without any physical reliability limits. But just recently I realized that the usual IPCC GCM temperature projection misrepresents the numerical uncertainty as well.
The numerical uncertainty is presented as though it were a time-series of independently measured points, each with Gaussian error. Rather like one of Mann’s paleotemperature reconstructions. They may be right about the Gaussian part, but they’re not right about the independent part. Time-series GCM projections are not at all like time-series paleotemperature reconstructions. In a GCM projection, each T(n) temperature point in a time-wise temperature series projection is calculated using the T(n-1) point as its initial condition. This calculational connection is entirely absent in paleoreconstructions, and changes the entire meaning of the uncertainty.
The IPCC is using the mean of each T(n-1) point as the initial condition for each T(n) and discarding the (+/-) uncertainty range of T(n-1). Every T(n-1) is then iterated forward as though it is perfectly accurate. But this is incorrect. As soon as T(n-1) is propagated into and through physical theory, its uncertainty limit is transformed from numerical to physical. The numerical uncertainty is a true uncertainty in the magnitude of each calculated temperature, and that becomes a real physical uncertainty when the calculated temperature is propagated forward to calculate further physical quantities. That means the entire uncertainty around each T(n-1) becomes part of the physical initial state of each T(n) and must be included in the calculation of T(n).
In practice, this means the numerical uncertainty accumulates across the years of a time-wise GCM temperature projection, despite Gavin insisting otherwise. The accumulating uncertainty then produces a widening vertex of uncertainty about the mean temperature series, the radius of which vertex widens with the number of calculated years. One could reduce this numerical part of the uncertainty to an arbitrarily small range by doing an arbitrarily large number of GCM realizations at each T. But you could never get the numerical uncertainty to zero, and what’s left would always accumulate across an iterative time-wise climate average temperature projection.
It’s really clear that the IPCC modelers in particular, and AGW stalwarts in general, like Wratt, suffer from a peculiar and specific blindness wrt propagation of uncertainty in, and the vast unreliability of, GCMs. Paraphrasing: GCMS project it, they believe it, that settles it.
Sorry about this O/T but do you know about Hansen’s funding connections?
http://ibdeditorial.com/IBDArticles.aspx?id=275526219598836
Re # 20
Whenuapai is also several kilometres to the West of Christchurch on the South Island IIRC. It’s close to Methven.
RE #25
Steve,
FWIW,
I’d argue for Seattle over Portland. Wellington doesn’t appear to have anything like the Columbia River Gorge nearby
The Gorge as a big effect on Portland (particularly when warm, wet, Pacific air meets cold, dry Canadian air).
David Wratt says
Your station identification shows a different elevation
Wellington Aero 3445 E14387 -99941.322 174.804 43 G N/A
IS this a typo by DW.
Regarding the question by maksimovich about the height of the Wellington Airport temperature sensor:
No, 4m was not a typo. I came across this issue myself when preparing my initial comments, since I have seen the temperature measurement site and was well aware that it is close to sea level. I checked with one of the technical people and they confirmed that the Wellington Airport temperature measurements are at 4m.
My initial queries suggest the 43m may have been the altitude for a barometer in the Control Tower at Wellington Airport which is itself (the tower) on a small hill . I’ve brought this to the attention of one of the people who look after the NZ climate database and I think they are checking it out with a view to correcting the station identification data.
31:
Maybe someone should update Hansen’s Wiki-page.
Sorry for out-of-topic discussion.
Re: #35
David Wratt,
Has anyone ever taken the time and trouble to actually go out to the observation sites and conduct some concurrent observations which can indicate whether or not the assumed adjustments for air temperatures due to differences in altitude are in fact and deed valid assumptions and adjustments? If not, don’t you think it would be a good idea to do so when the importance of the usage of such adjustments to the measured observations are considered?
Here is something for Hansen’s Wiki Page:
http://ibdeditorial.com/IBDArticles.aspx?id=275526219598836
Package for the media by George Soros to the tune of $720,000!
Also here: Is Global Warming Alarmist James Hansen a Shill for George Soros?
While that’s getting pretty OT, I would like to see another legitimate news source for that, and I would like to know how exactly George Soros will benefit from it. Billionaires don’t get to be billionaires by pissing money away. He’s GOT to benefit somehow. Is he selling carbon credits? It he buying solar panel or hydrogen fuel cell companies?
RE 35. Hi Mr Wratt.
I was glad to see that I could access NIWA data. I was wondering why your EULA had this
“3. NIWA does not make, and the Recipient acknowledges that NIWA has not made,
any representation or warranty (express or implied) as to:
(i) the accuracy or completeness of the Data; ”
Now, when I read the comment about the confusion in altitudes, I fully understand why
NIWA will not stand behind the accuracy of its data.
Given that, can you in all good conscience recommend that your data be used to determine
any policy that will impact peoples lives?
We require more disciple from our dog food suppliers than our climate data suppliers.
#40 it’s not always directly about money. I think that’s a bit of a fallacy. Power, influence, ideology, belief, these all motivate people. Is Hansen in it for the money, for instance? I doubt it. A scientist who strongly believes in environmentalist causes, for the most honest of reasons, will look for evidence to support his beliefs, for instance.
Backers like Soros may not make money from backing a particular cause or person. I think you must take a broader view. It’s like a large advertising campaign. The company may not make more money in sales from a particular ad, but they’d look at whether the campaign as a whole has benefited them. Even a whole campaign may not in pure money have gained them anything at the time, but it enhances their general market position in the grand scheme of things.
Looking for a direct benefit from a backer supporting a particular group is likely to turn up little of significance. Rather, they gain in the long game by the movement which they are supporting gaining power. Soros may well gain from a democrat president. Supporting environmentalist causes increases the likelihood of that occurring. Also, if you’re a wealthy man (naturally distrusted by the increasingly powerful trans-national movement), it pays dividends to be seen as a leftist philanthropist, rather than as an Evil Corporation who need to be defeated. People like Soros are playing a Long Game.
#41 steven mosher:
That’s the kind of standard legal disclaimer that is attached to any data from any source. Blame it on the lawyers. 🙂
There is a lot of discussion here about the lack of any response from climate scientists to this community. Dr. Wratt has made an attempt to respond to questions. He has indicated that the error in elevation will be fixed. The response is derision and sarcasm.
RE 43.
There is NOTHING standard about that kind of EULA. Did you see that kind of click through
EULA at NOAA? You did not. Can you Download GISS data without a EULA? Yes.
NASA CODE? Yes.
Over the past 15 years I’ve spent a considerable amount of my
life negotiating these types of documents with lawyers. There is absolutely No reason for the
for the EULA. None. If the scientist in question were dedicated to open inquiry he would
remove the EULA. Do not offer him cover.
Essentially, I am not bound by the EULA they posted. They gave nothing. I got nothing.
They might argue that they gave me “access to the data” but I already had that consideration
since nasa Giss post the data without restriction.
The issue, the real issue is this, People like Jones use these EULAs to limit access to their
data and methods. So, HADCRU will not release its station data and not release it intermediate
data because of these EULAs.
Dr. Wratt’s doing great.
If you want more on G. Soros, just Google around for his links to various quasi-political organizations he gives money to and is involved with. He spends money to influence causes he’s for. He’s got plenty to burn or whatever.
RE: #43 – Derision and sarcasm – that’s the response I normally get when I post at RC, Wabbit Wun, Climate of the Past, etc. What goes around comes around.
#46 SteveSadlov:
Fair enough — but wouldn’t it be better to take the high road?
Google “George Soros” and “James Hansen” and you will get numerous links to that one editorial.
#44 steven mosher:
You are right. Credit to NOAA and GISS.
I agree that HADCRU should release its station data and intermediate data. However, your post was directed at Dr. Wratt from New Zealand.
While normally just lurking and enjoying the comments and articles, I would like to join in on this one.
WRT # 38, 39 and 40, perhaps the article on JunkScience
http://www.junkscience.com/ByTheJunkman/20070920.html
will help to explain some of the advantage he is expecting.
John V. — We should always take the high road when possible.
mosher — Yeah, well. Best to treat our guests nicely if we want more of them, don’t you think?
cce — There’s 4 editorials on the main page on this issue. That article isn’t really about Dr. Hansen Or even necessarily G. Soros http://ibdeditorials.com/series4.aspx
Tony — It’s not a good idea to have any links to anything on that site, not even the charts derived from GISS or other scientific data like you’d find on their “Greenhouse” page (The Real ‘Inconvenient Truth’) at the site. It’ll get you into trouble “other places” (ask windansea) as far as your warm welcome. Best not to get into the habit! 😀
Re: 40 & 48
page 125/156 of http://www.soros.org/resources/articles_publications/publications/annual_20070731/a_complete.pdf
Gives us a lead to go find http://www.whistleblower.org/template/page.cfm?page_id=164 which says
Page 145/156 from the first document gives the $720,000 figure. Looks like that’s the total of the politicization of science program, not specifically targetted towards Hansen. On the other hand, we don’t know how many other organizations, besides Soros, might also have contributed to Hansen’s cause.
So 720k may or may not have found it’s way from Soros to Hansen’s cause, but we know that some amount did.
We also can’t conclude that Hansen didn’t have additional backers, increasing his revenue above 720k for that project.
If you had read the original article on IBD, you might have noticed that they claimed the Open Society Institute’s annual report as their source. From there, it wasn’t hard to find these details.
RE 49. Sorry I Find it utterly useless to subject me to a EULA that offers no consideration.
So, I decided to check Canada. Canada also has an EULA, but they don’t require you to
read or acknowledge it before getting access to the data. This is a USELESS EULA as well.
Simply, they provide the data without my prior consent to the EULA so there is no meeting of the
minds.
These useless EULAs are USED by people like Jones as a pretext for not sharing data and methods.
Simply. New Zeeland and Canada impose useless meaningless EULAs upon users. Jones uses this data.
When you ask Jones for his sources and data he claims he cant release it because of confidentiality.
ALL CLIMATE DATA SHOULD BE COPYLEFT.
Ok… mosh pit done. I’ll go be nice again.
re 51.
Sam you are right, But going through the frickin EULA to get NZ data was dumb
as dirt and frosted me. Plus they put a 2 Million record limit on the data request
and the map interface was not completed.
Opps I promised no more mosh pit.
#53
steven, it depends where you go in Canada. At the AHCCD (Adjusted Historical Canadian Climate Data – Environment Canada government) site, the license agreement reads:
In order to access the temperature and precipitation data for Canadian weather stations, you need to register and be given ausername before you can download data. Although it does not seem to refer overtly to the accuracy of the data, I suspect that the legalese in the way it is stated includes it.
” …dumb as dirt and frosted me.”
I know. There’s a lot of them around, and they are annoying. I wouldn’t think though that Dr. Wratts responsible for the policy or can change it though.
There are thousands of other stations that just disappear around the same time.
If you want a reliable temperature record, the first obvious thing is not to keep changing the way in which you use the data – exactly what NASA is doing. In the unlikely event that anyone still thinks there is anything believable in the NASA data, just look at the graph of their number of stations, which seems to be falling off a cliff from around 5000 to around 1000.
Presumably this has been discussed before – sorry.
In the NZ data it is interesting that there are many other sites that show no trend or even a downward trend – eg Christchurch, Invercargill, Norfolk, to pick a few that do have data up to the present.
David Wratt, please could attempt to answer at least one of Steve’s questions? Where did the earlier data come from? How can you justify the Hansen ‘adjustments’? You seem to imply that it is due to change of stations but this is clearly nonsense: If you look at the before – after ‘homogeneity adjustments’ you get a series of exactly 0.1 degree steps every 5 years from 1955 to 1990, totalling 0.6 degrees. So, not for the first time we see that the ‘adjustments’ correspond almost exactly to the alleged warming.
RE 55.
I went here: http://climate.weatheroffice.ec.gc.ca/climateData/canada_e.html
They have the disclaimer, BUT you dont have to read, understand or agree to
the disclaimer to get the data.
granted you are limited in getting the data since you have to work through a UI,
but in displaying the information on my screen without demanding agreement to a EULA
they have given me a copy without restriction.
It’s a fine point, but one can use it to free data and code.
I’ll check the site you referenced.
John,
It may also be fair to make a balanced and fair criticism of all parties by noting the extent to which Dr. Wratt may or may not already have had one or more bites out of the same apple of sarcasm and derision through the affiliation with the IPCC and other associations:
Clearly, Dr. Wratt has elected to take the public stage as a participant in the making of public policy, so he is thereby obligated to be no less responsive to criticism, framed rightly or wrongly, then any of the rest of us. Improper forms of criticism does not relieve a person seeking a public leadership role from the obligations for accountability to the public they seek to lead. Selective responses to questions about scientific methods and results may be rightlyfully construed to constitute politics more so than science in certain circumstances. It may be argued that a leadership role in the IPCC and the AGW political community are indeed such circumstances.
RE 55.
Roman, Yes, This site has a proper click through agreement for adjusted data.
http://www.cccma.bc.ec.gc.ca/hccd/application.shtml
Their remedy for breach is nothing. The fee they charge is nothing. There is no warrenty.
your Honor we are exchanging things that have no value.
I just think it odd that in the US we have product liability laws that hold business
liable for its work product, but government data has no such warrenty.
I certainly agree that the climate data has no value.
#60
You are right on most of what you have said in this thread. Their (AHCCD)remedy for breach is termination of the license they have issued to you according to the quote in #55.
If you’ve ever bought a house, you know all the stupid CYA forms you have to fill out for this law and that law and this disclosure and so on. The EULA are just CYA. There’s lots of “free” data and programs that require registration, paging down and accepting something, etc.
Let me attempt to turn #7 no warranty CYA into English:
We are licensing you this data, but do whatever you want with it. If it doesn’t do what you want it to, it’s not our fault. If you try and sue us or anything like that, we’ll just terminate this license.
Even GNU GPL has limitations put upon it. For example, this section:
Or as they later say:
Oh no, more TLAs
COADS Comprehensive Ocean-Atmosphere Data Set http://www.ncdc.noaa.gov/oa/climate/coads/
GAP Government Accountability Project http://www.whistleblower.org/template/index.cfm
GISS Goddard Institute for Space Studies http://www.giss.nasa.gov/
HADCRU
HAD MET Office Hadley Centre http://www.metoffice.gov.uk/research/hadleycentre/
CRU Climate Research Unit http://www.cru.uea.ac.uk/
NIWA National Institute of Water & Atmospheric Research http://www.niwa.co.nz/
EULA End User Licence Agreement
{Advice (n) advise (v); licence (n) license (v) }
Any mistakes are mine to make and yours to forgive.
Some of those are FLAs Like that one.
RE 63.
Yes Sam but you miss the Subterfuge.
1. Their licences are invalid. I’m not concerned about that. I’d copy their data and repost
it just to prove utter uselessness of their EULA. What law are they going to recover under?
Frickin idiots didnt even say what jurisdiction the licence was subject to.
2. These SHAM agreements are used to limit redistribution. THAT is the shelter that guys like
Jones use. Glad you quoted GNU.
3. Warrenty. I have no issue with AS IS.. for my used car. Now, does the consumer of the IPCC know that it
relies on data that is provided AS IS? Do the people who would have to pay carbon taxes
know that the basis of this policy is data that is provided AS IS. Would you accept
AS IS data for fuel economy reports from the EPA? AS IS data from the FDA for a drugs
effectiveness? AS IS data from the FAA or NTSB? AS IS data on AIDS? No, you expect
some diligence. Not perfection, but transparency and diligence. Best efforts, at least.
RE 63.
One last thing.
ASk yourself this. What if the warrenty said this: “This data is provided AS IS and cannot be relied
on for any legal or public policy decision or sited as evidence in any legal or governmental process.”
I’d be cool with that.
OTOH, FWIW, AFAIK and FYI, in my experience that’s just in there because somebody thinks it needs to be. it’s not meant to be “enforceable” it’s just there to have something “in case”. I agree it’s fairly meaningless, but some folks have requirements. Or think they do.
When it’s used for evil, well, that’s another story. So I get see your point, something along the lines of it’s meaningless at best (at least from other than a CYA angle or legal requirement to have something like that in there) and used to limit access for political or other nefarious endeavors at worst.
So is the take home message that
1) the temperature in Wellington has increased over the last 60 years
2) the temperature in Wellington has decreased over the last 60 years
1) the temperature in Wellington has neither increased or decreased over the last 60 years ?
——————————————————————————————–
Finally, do these temperature swings correlate with NZ grain production from 1900 to 1950?
there seems to be a trough in the temp record where the US was going through the dust bowl.
RE 69.
Grain production. One time in a thread somewhere people asked me WHY i looked at
the weather sites that were controled by the agriculture departments.
Good question.
If you screw up data that farmers use people starve.
So, I prefer to look at those records.
I would like to know the basis pf thre “homogeneity adjustments”. Are they based on studies conducted in the USA, or are they based on local studies? Also what are the 95% confidence limits of the these adjustments. and to what extent do they vary oner time?. What are the 95A confidence limits of the adjusted figures and of the supposed overall trend?
Having stated that it in “meaningless” to try and draw a straight line throughn a set of irregular data, David Wratt proceeds to do so for his “adjusted” data, which are almost as irregular. It seems he is obsessed with establishing a “trend” in order to justify his obsession with the greenhouse theory. It is evident from the data so far displayed in this discussion that there is no “overall trend”, merely an unpredictable variability with no statistically significant behaviour. The “trend” itself is adjustable as it depends on where you start and where you finish
RE 68.
Yes, It has all the earmarks of ” I want people to use it, but I don’t want to be sued”
“Hey Boss Here is my work.”
“Is it right?”
“Well, I want you to use it, but don’t fire me if the thing blows up”
“So you want the credit, but not the Blame?”
” YA!”
“I certainly agree that the climate data has no value.”
Let’s see, Climate Science is based on weather data. Climate Science can’t/won’t predict the weather of the future, but will note that it’s going to be hotter than H-E-Double_Hocky-Sticks?
RE 71. The wesponse to Wratt is wery simple.
“Mr Wratt do you warrent your data to be correct and your analsysis to be accurate and take
full legal responsibility for it and will you submit to the scientific discipline of replication.”
You will all notice that I made no comparisons to Ken Lay. None whatsoever.
#73
I think we are rapidly approaching the point when the biggest question becomes,
“Can Climate Science Survive Global Warming?”
Dr. Wratt,
Notwithstanding the less than constructive comments from some here, can you offer any explanation for the adjustments made to the Wellington station data? If you do not know how or why the data were adjusted, it would be acceptable to say so and hopefully may spur some “skepticism” in yourself.
“I certainly agree that the climate data has no value.”
Let’s see, Climate Science is based on weather data. Climate Science can’t/won’t predict the weather of the near future, but will note that it’s going to be hotter than H-E-Double_Hockey-Sticks somewhere over the (time) horizon?
RE 76.
Explanations are cheap. Warrent your work. When you passed in a paper in college
you said the work was yours. When a mechanic fixes your Ford he warrents the worksmanship.
When a plumber fixes your loo, he warrents his work. When your doctor took your brains out,
he warrented his work. In all of these cases, from the lowly student, through the grease monkey,
and the loo engineer and the brain surgeon, they all warrent their work.
Now, my tarot card reader does not warrent her work.
SO, is a climate scientist more like a plumber or a tarot card reader.
Just asking.
RE 69
Are there opposing hemispheric trends? The current Arctic Ice minimum has made the headlines while the near maximum in the Antarctic has had little notice. (Doesn’t fit the AGW story-line.)
Makes me wonder if this is mostly about those long-term ocean oscillations and their regional effects.
RE 79.
This is a teaching moment. You would think that getting the temperature measured correctly
on a land site would be high school science project. You would expect your student to collect
the data, measure the position of the site, report the data. Pretty basic stuff. And if you
asked this student.. Are these the measurements? is this the position? is this the altitude,
you would expect them to get those things right. The latitude was X. The longitude was Y. The
Elevation was Z. The temperature was T. pretty basic. Not rocket science. Not even plumbing.
So, NOW, in the middle of discussions about the simple ABCs of looking at thermometers,
people raise issues about artic ice. Why? Diversion.
We have a record of land temperature observations from 1880 to present that no one will warrent.
We have a record of sea ice extent from 1979 to present that no one will warrent.
Odd.
When you ask about the warrent, when you question the accuracy, you are branded a denialist.
They won’t warrent, but you cant question. Nice contract that.
So. why do people bring up the ice?
The Artic melting is the FALL SEASON PLOT. With news flashes from the NHC.
In Spring we get the migrating species plot.
Al Gore is the fisher King
#78:
I was writing a very long (and off-topic) response to this, which I will transform into a useful document for beginners here or those that simply need focus. More on that when it’s done… but anyway, my basic response is that a “model” (i.e. this set of adjustments) need not be accurate in every row/observation so long as it on “average” (appropriate metric debatable) accomplishes the goal of the adjustments. This is only IF the goal of the adjustments was to fix global “average” (same appropriate metric) temperatures. *Bear with me… since the methods of adjusting for TOB and UHI have been well studied and are based on “averaged” data empirically derived (e.g. UHI: worldwide sample of these pairs: Station quality = 5 records compared to corresponding
(HTML mix-up)
1km proximity station w/ quality = 1), this is actually expected.
This is not to say that errors in implementing these methodologies could not exist, only that such results are expected even if implemented correctly. To what degree would depend on the variance of the (e.g. UHI) station 1 vs station 5 companion sites.
*I make this statement having not yet made any serious attempt at studying this literature. I do not know how UHI or TOBs bias has been calculated, but the logical way to adjust for UHI is as I described. An unbiased distribution of such sites is necessary to smooth the interactions of altitude, local climate, local weather, etc, otherwise estimates of UHI bias are necessarily unreliable IMO.
Since the above conditions have yet to be demonstrated (to me), and in fact many problems with the above conditions have been revealed on this site, I can place no confidence in the accuracy of the adjustments made and hence the global average. I have also assumed the best of methods used in the literature, which may or may not have actually been the method used to determine appropriate adjustments. I also assume no implementation errors.
To suggest that anything can be said about local climate with such unsatisfied conditions is simply absurd.
To summarize, for faith in global temp average accuracy, the following conditions must be met:
1) Accurate development of average UHI (and TOB) bias with the above methodology or another non-biased empirical method. The average size and distribution of these errors must be known.
OR
1a) Explanation of why I am wrong in my above assumptions and reasoning.
2) Demonstration of correct implementation of the above in the code
[To add other issues for completeness, although off topic]
3) Demonstrate the legitimacy of 5×5 grids as meaningful representations of the intended measurement of global temperature change
4) Demonstrate the legitimacy of daily (min+max)/2 temperature measurements as compared to an hourly or area-under-the-curve modern thermometer. Attempt to measure this error and its distribution.
**********
Carl.
Here is thought. Write a nice email to Dr Wratt. Ask him nicely for access to the data
and access to the adjustment code. It would be cool if he gave it to you. See what he says..
Dr wRatt I was glad to see you post corrections, vital to science, blah blah
Can I have the data and methods please and thank you.
It would be cool if he gave it to you.
re Dr Wratt
Some interesting questions arise,This paper on corrosion to NZ met sites also shows the elevation as 43m for a 10 year onsite experiment.
Click to access con70.pdf
Land information(nz)puts the gps geodesic elevation at 434269.976
Are there 2 met observation stations?.Which is the service provider for the automated weather flight information including Barometric runway conditions?
For some years now I have been concerned that so much activity is based on USA temperature data and interpretations. Indeed, the classic “adjustments” appear to be designed to make the USA data tell the story sought. The adjustments need not be valid when applied to some other regions. Some adjustments need not even be required.
I have been patiently waiting for the USA top gun climatologists to interpret New Zealand (as a lovely little subset with abundant high quality data). This is starting to happen, but so far not many lessons have been learned, despite some obvious explanations being needed. Blind eyes are being turned away. Don’t want to know.
Next in the search for Waldo, we should go to Australia. As a caution, we should look st raw data first, because the versions sold to casual inquirers by the Government Bureau of Meteorology are not replete with descriptions of which adjustments have been made, nor with the reasons why a hundred or perhaps several hundred station records are not in the official packet.
The uncomfortable picture that is emerging is that taken overall, Australia has not warmed very much at all since about 1880. As Warwick Hughes noted a decade ago, the main “official” warming is UHI suspect and as Warwick and I noted a year or so ago, the East Anglia group seems to have cherry picked.
There are many Australia statisticians, general scientists, geologists etc who raise an eyebrow at the concept of AGW. There seem fewer climatologists. Nobody took much notice of them in the early years because they pinned AGW and green badges to their sleeves when it was not justified to do this. I’m takling about other highly qualified people, who have no problem with a slight global warming last century (with a slight cooling in the middle), but a big problem with political warming. Frankly, most people I meet from all walks of life here just do not believe in AGW or don’t care (escept for teachers brainwashing pupils as fast as they can go).
So take a diligent trek from New Zealand to Australia – and then to places closer to the Antarctic, not just for temperature. Waldo, here we come.
Steve Mosher, you are usually very erudite, so please keep it up and “warrant” your work.
Is warrent the British spelling?
“Before this, the Wellington measurements were taken much closer to sea level. For example from July 1912 until December 1927 they were from a site in Thorndon, at 3m above sea level. As you know, there is a drop off of temperature with height which occurs (on average) in the atmosphere.
[…]
I should also mention here that there is a further data set from measurements 4 m above sea level at Wellington Airport, commencing in January 1962.”
So this should mean that there is a warm bias before December 1927, and a warm bias after 1962? So the dataset should be adjusted downwards before 1927, and after 1962? Why do we see a downwards adjustment in the period between 1928 and 1962, with much less downwards adjustment after 1962?
Am I missing something? Is the “further data set” not included in this dataset?
Ref #87
Warrant is the British spelling, but in this context we usually talk of guarantee. A car may be provided with, say, a three year warranty, but repair work is guaranteed for x months.
re 86.
Thx. If you ever need work as a spell checker, drop me a note.
Correct !
The take home message is that, given the data quality and error margins, we cannot discern any trend from among the noise.
The climatologists’ claims to the contrary are unfounded.
#88. I would have thought that caution would have to be taken for lapse rate adjustments near the ocean. I remember being in Tacna, Peru which is on the coast about 10S in May or June one year and it was really cold right by the water because of the Antarctic Current (I didn’t have the right clothing at all), but got warm as you went inland. So I don’t see how one can make simplistic lapse rate assumptions near the ocean. That’s not to say that they are incorrect in the Wellington circs, just that they need to be shown, not assumed.
Steve – Regarding your comment #92 on lapse rates: When one of my colleagues looked a few months ago at an overlap period between Wellington Airport and Kelburn, he found an average temperature difference of 0.79C. This works out at a lapse rate of 0.65C per hundred metres (averaged over the period he looked at) – about what I would expect given Wellington’s windy climate.
Regarding comment number 85 on waiting for some US top gun climatologists to analyse Australia and New Zealand data: We do actually have some top-gun climatologists of our own in this part of the world who have worked on this and published papers in the peer-reviewed literature. Over the coming year we (NIWA) are planning to do a careful update analysis on NZ climate variability and trends from the historical database, which we will submit for publication once we have put it through our own review processes.
Interacting with you guys has been interesting. However I have a number of other urgent tasks on my plate right now so I will have to drop out of this discussion thread. Regards – David Wratt
#93. Comment #85 was written by an Australian.
RE: #92 – All things being equal, and with lapse rate taken out of the equation (e.g. assume a semi infinite near sea level plain) in a tropical location with a cold current, yes, both day time highs and night time lows will be depressed versus inland, year round.
In mid latitude locations with a cold current, day time summer highs are depressed, night time lows may be but not necessarily, versus inland. In winter it is the opposite case, where it’s warmest by the beach verus inland.
Classic example, 30s N, California. Go to the beach on July 1, at 12 noon, and you will likely encounter coastal stratus, wind, and a temperature somewhere between 55 and 61 F. Go July 1 at midnight and you will enounter temps only a bit below that range. Go inland to Fresno. July 1 at noon it would likely be in the 90s or even 100s F, even though Fresno is slightly higher in elevation than at the beach. Now, repeat this experiment on January 1. At the beach, amazingly, the temperature may even be higher than on July 1, and certainly, it would not be much lower at noon. At midnight, it might be somewhere between 40 and 50F, only 10 deg colder than July 1. Meanwhile, Fresno’s noon will be something between 30 and 55 deg (and perhaps, with so called Tule Fog – a dense radiation fog – possibly ice fog!) and Fresno’s midnight will be in the range of 25 – 40 deg, with frost forming.
RE: #95 – For those of you who live in or are familiar with the Mid-South, Fresno is like the Mid-South without the ongoing relatively high RH. Also, the precip max is during winter rather than summer/early fall. Annual precip is ~ 10 in. Unsurprisingly, although the districts immediately around Fresno are known mostly for table grapes, figs, almonds and myriad other fruit orchard / vinyard operations (as well as irrigated pasture for dairy and beef cattle), just a bit to the west is cotton. California’s cotton belt is roughly between just over 35N and ~ 37.5N latitudes.
Re: #93
David Wratt says:
The New Zealand Climate Science Coalition says:
Has anyone adequately archived the databases in advance of the update analysis?
RE 98.
The access to the data is “special”. There is no station list, you have to
know them in advance. After figuring one out I went to get that data from 1900 to present.
Daily tmax/tmin. The site only had tmin, and I was forced to request it 1000 lines at a time.
There is another interface to get stuff ( HOW ABOUT A FTP SITE?) but it requires letters to
be written to release the secret climate data of 100 years ago.
Pirate treasure I suspect.
Are you saying that the data is not freely acessable? NIWA publicly declared all data would be accessable and free.
RE 99. It’s accessible. Its free. Its a pain in the butt.
At USHCN you have two options: 1. Go through a UI, pick the state, see a map of stations,
pick the station, pick the data you want DOWNLOAD. Option 2: Go to the FTP
and get all the data tarred zipped and feathered.
At the NIWA site you have to register and then to get station data you have to know there
is a station in Churchhill for example. The map interface is not available.
Then when you figure out a site id number and select the data you want you get it in 1000 line chunks.
And, there is a 2M line limit overall.
There is a mcehanism for requestion all the data, but Involves writing to them.
Now, to be fair to the NZ folks I havent looked everywhere on the site and perhaps someone will
pop up and call me an idiot and point out the easy way to get the data. And then I will gladly
wear a dunce hat for a day.
Only a day?
For anyone that wants to play with Australian data, the BoM has made a subset of their data available called “Australias high-quality climate change datasets” at:
http://www.bom.gov.au/climate/change/datasets/datasets.shtml
There is a link on the page to a FTP archive containing the temperature datasets:
ftp://ftp.bom.gov.au/anon/home/ncc/www/change/HQdailyT/
– and another link to it’s PDF information file:
ftp://ftp.bom.gov.au/anon/home/ncc/www/change/HQdailyT/HQdailyT_info.pdf
I have not downloaded the ZIP archived data, but it seems to consist of 99 non-urban and 6 capital city sites, with Tmax, Tmean, Tmin, and Tdiurnal, plus station list.
David Wratt (#93) has bowed out without even attempting to answer the question of justifying the ‘appropriate homogeneity adjustments’ he refers to, despite being asked this question at least 4 times (Steve’s post plus #57, 76, 88). Presumably therefore he agrees that the NASA adjustment of +0.6 degrees over 1950-1990 cannot be justified.
In fact (as pointed out in #88) if an airport site at just 4m above sea level was introduced in 1962, this would be warmer, so a negative adjustment should be applied from 1962, the opposite of what NASA has done.
Re: Steve Moore #33, Seattle is in the rain shadow of the Olympics, which arguably is as strong an impact as the Columbia River Gorge on Portland. One of the smaller coastal cities might be a better choice. The dry summer climate reaches Portland a few weeks earlier than Seattle and Vancouver BC. as it moves poleward from the Mediterranean regions. Perhaps a city/town at an appropriate lattitude can be selected by the timing (relative to the soltice) of this seasonal change.
Re #102 Carl Smith
In Australia, the Boreau of Meteorology has records for temperatures for about 1,700 stations, many going back to 1900. Many have remained rural and so a good base exists for defining and excluding UHI. This was not done well by Phil Jones in his early reports that helped stampede the world with about 20 or so large cities as the base for Aust SH temperature projections, uncorrected for UHI.
In the Oct 2007 CA post “CRU reveals station identities”, there are about 250 Australian stations used from this 1,700. Most seem to have been fed to CRU by the BOM, which would be normal practice. However, it does not seem easy to find the rejection criteria – yet.
The BoM does release a public version of high quality sites at
http://www.bom.gov.au/climate/change/datasets/datasets.shtml
There are anly a handful of the 1,700 possible sites on this list and no specific criteria given for the rejection of the rest. The listed sites are mainly at airports and they could well be of good quality, since Australia science standards have historically been high wrt ROW. But, since airports started construction from beginnings in the 1930 decade and did not really move until WWII, the airport data tend to cut off early years, where there is much interest in trends.
It would be a help if the BoM posted a list of the 1,700 sites and their reasons for adoption/rejection. This is where politics can enter the equation. In the few encounters I have had with BoM and its relations in CSIRO, I hae encountered the some of the same belief-driven zealotry that the retired Chief Dr from NZ expressed. Defend the IPCC at all costs. One ?scientist said that his major problem was to get the Government to act on man-made climate change. My reaction is, first show the evidence.
David Wratt, who made a fleeting visit to this site but disappeared before providing the information people had asked for regarding the adjustments made to NZ temperatures by NIWA, has been in the news recently being held up as one of those scientists responsible for seeing the Nobel peace prize awarded to the IPCC. His work for the IPCC is being held up as that of utmost importance to the world. Free the code MR Wratt.
http://www.niwa.co.nz/our-science/climate/news/all/niwa-confirms-temperature-rise
http://www.niwa.co.nz/our-science/climate/news/all/niwa-confirms-temperature-rise/combining-temperature-data-from-multiple-sites-in-wellington

Annual temperatures at three Wellington sites: Thorndon (3 metres above sea level), Kelburn (125 m asl), and Wellington Airport (4 m asl), as recorded in the NIWA Climate Database.
Annual temperatures at the same three sites, but with Thorndon and Wellington Airport adjusted to match the Kelburn record.
http://briefingroom.typepad.com/the_briefing_room/2009/11/niwas-explanation-raises-major-new-questions.html
http://briefingroom.typepad.com/the_briefing_room/2009/11/breaking-nzs-niwa-accused-of-cru-style-temperature-faking.html