Some of you have been noticing a tendency for almost any gust of wind in the Atlantic to now become a named storm. Given this tendency, more relevant metrics are obviously the number of hurricane-days (and the closely related ACE index) and the number of storm-days.
I’ve scraped the data and done the YTD calculations, comparing these to the corresponding values to the end of September in previous years (I’ll replace this graphic in a few days when Sept 2007 is completed, but I don’t expect much change.)
At this point, despite a couple of intense hurricanes, 2007 is even quieter thus far than 2006.

Script for doing the update is at http://www.climateaudit.org/scripts/hurricane/update.hurdat.txt . Structurally it can update other basins as well, but I’ve only checked the current update against the Atlantic basin. This script requires hurricane.tab and Track.tab objects to 2006 which can be obtained http://www.climateaudit.org/scripts/hurricane/data/unisys . If required, I’ll modify the update script to work off these text files.
UPDATE: OK, here are corresponding plots for other basins. It didn’t take that long to do the calculations. You’d think that this would be available form the hurricane specialists with their legions of graduate students. The graphics pretty much speak for themselves. (In the early years for some basins, there are identified storms which often don’t have any wind speeds attached, which explains the appearance here.) The scales of these graphics are not uniform – the N Indian Ocean is much much lower than N Pacific and would be barely noticeable on a uniform scale.


677 Comments
Trend lines and error bars please.
Great plots. Is there anyway to get access to the data and the scripts for this? I could use an updated version of this in the mid-November time period.
#1. It all depends what period you wish to define a trend over and what statistical model you’re using. That’s a discussion unto itself and, for the purposes of this post, I’m simply presenting data.
Climate Prediction Center outlook can be found here:
http://www.cpc.ncep.noaa.gov/products/outlooks/figure2.gif
They appear to be a bit off the mark for 2007.
I am a very long time lurker and truely appreciate this site.
best regards, jeff
#1
I think that your request presumes that the data has been analyzed for anomalies, etc. If so then yes, if not it seems to me to be premature. The main point is that the recent data, which is likely more homogeneous, does not currently support certain types of predictions in any obvious way.
Steve,
I know this is out of place but can you post a permanent link to your BBC interview, or can you archive it on CA?
The old link no longer seems to be working.
Thanks
Steve: Posted up http://www.climateaudit.org/pdf/news/bbc.aug07.MP3
Steve:
One of my messages got caught in your spam filter because, I guess, I linked the Science.com story on the reaction to the supposed meteor strike in Peru. It appears that it is a great example of the power of suggestion and mass hysteria. The latter is something the media needs to be sensitive to rather thanplaying to.
If we project the data from the last four years, ther’s a huge danger that we will no longer need the Hurricane Center and the Weather Channel and much of the media will have to be following OJ or go bankrupt.
I believe there were a lot more cat.4 and 5’s in the past then previously thought when at those days the most complex weather detecting instrument was the “human eyeball”. Some storms which never made landfall may have escaped attention without satellites unless it ran directly over a ship which by definition is trying to escape the hurricane after all…
Can you do the activity in the other oceans as well to give us a global context?
#10. I can’t do everything all at once. Everything takes time.
This occurs in many areas in which previous technology let slip “events” that are now classified. Coupled with calling every gust of wind some sort of tropical event, which was also not done even a few years ago, you end up with a definite bias towards increased counts as time progresses, even if the natural “trend” (whatever that may be for a sinusoidal function) stays relatively constant.
Mark
Script for doing the update is at http://www.climateaudit.org/scripts/hurricane/update.hurdat.txt . Structurally it can update other basins as well, but I’ve only checked the current update against the Atlantic basin. This script requires hurricane.tab and Track.tab objects to 2006 which can be obtained http://www.climateaudit.org/scripts/hurricane/data/unisys . If required, I’ll modify the update script to work off these text files.
Somehow I have the feeling that someday hurricanes will be taxed as well…
Yes, I can see it now on the 1040:
Number of Tropical Events: XX (pre-entered)
Multiply adjusted income from line 10 by 0.1 (total HTax due): XX*0.1
Mark
Ooops…
Yes, I can see it now on the 1040:
10. Adjusted Gross Income: YY
11. Number of Tropical Events: XX (pre-entered)
12. Multiply number of Tropical events by 0.1: XX*0.1
13. Multiply income from line 10 by (1+line 12): YY*(1+0.1*XX)
Mark
Yeah, but just wait ’til 2009, then there’ll be some storms, and big ones too, ones that’ll blow the stoplights sideways…
AMO, where art thou?
Dough-no,
PDO?
#17:
You’ve spelled your name incorrectly. Perhaps you should re-correlate.
I now need to Enhance my Hurricane per C02 sensitivity parameter.
C02 will lead to more tropical depressions, or more tropical storms, or
more hurricanes, or more intense hurricane, or more supercanes, or
more hurricanes that form rapidly.
So The Hurricance sensitivity parameter is now
100Knots/C02 ppm
RE: #10 – I plan to cover NPAC, in a fashion, during 2008! It will be comvered at my new blog “National Hysteria Center (NHC)” 😉
But seriously, here is a great example of how one can play around a bit with curve fitting (e.g. to a plot of various (apparent) “wind speed values”) and thereby move marginal features above break points for TS and hurricane classifications:
http://www.nhc.noaa.gov/refresh/graphics_at2+shtml/143525.shtml?swath#contents
Pretty interesting map, is it not?
#11 – I don’t mean to nag. I’m astonished at and grateful for how much you accomplish.
#20. Yes, a nice map if you’re worried about your trans-atlantic crossing route . In 100 years, a compilation of these maps might tell us something about climate. I hope they’re keeping the metadata and algorithms.
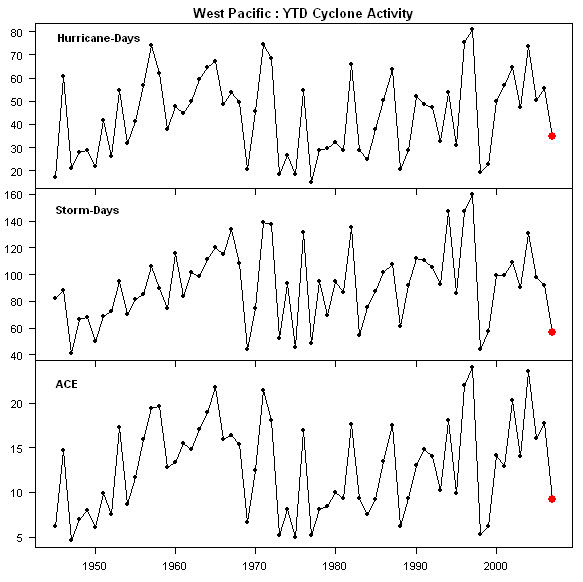
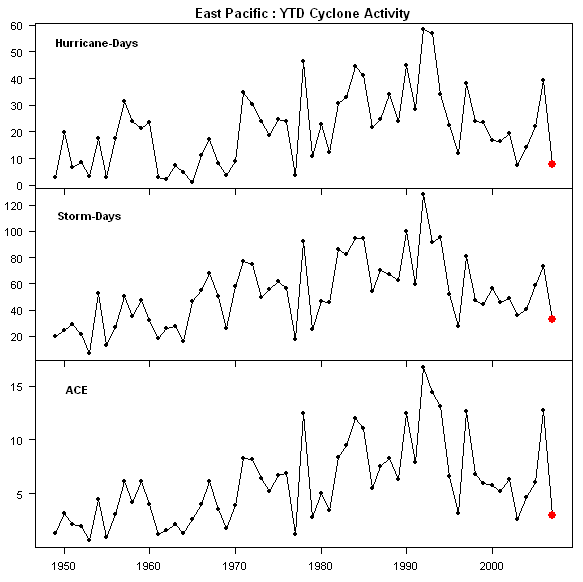
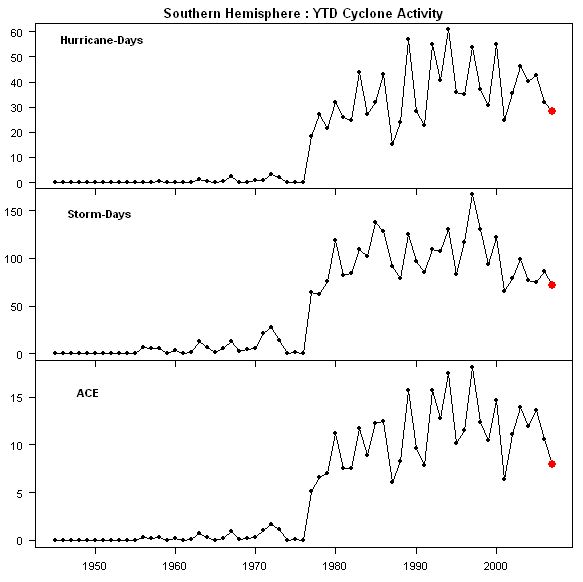
Ryan Maue created a nice webpage here which shows the to-date ACE values for the Northern Hemisphere storm regions (Atlantic, East Pacific, West Pacific). The Southern Hemisphere is currently dormant (winter).
RE: #22- But notice, the straight lines …. the unbelievable increase in affected radius over a very short distance of storm travel. Clearly, the map is a map of one person’s interpretation of likely windspeed, not of rock solid, real wind speed. And depending on where you fit the curve of windspeed on top of the pointilistic blur of various apparent wind measurements, you can literally move the edge of the orange area by miles either way. But hey, it’s the TC branch of Climate Science.
re 20.
Thank you for the flashback to Oingo Boingo. I am proud to say that I saw them
Live an in person at WoZ’s US FESTIVAL.
Sadlov, you shoulda been there
http://en.wikipedia.org/wiki/US_Festival
Friday was great, saturday was ok, Tom petty was a nice end to the wasted day.
Sunday was a bust ( except for the dead) and we walked out on stevie nicks.
RE 20.
Nice Geoduck you beer bong besotted beatnik
Steve Sadlov: If you want to do a GLobal Hysteria blog on auditblogs.com be my guest. I was thinking of starting a blog like this, but I haven’t the time at the moment. It was going to be subtitled “The Madness of 21st Century Crowds”
RE: #28 – The Madness of 21st Century Crowds – LOL! A wonderful spin on a wonderful writing! Once I get started, I may indeed consider auditblogs for the venue. Cheers!
RE: #26 and 27 – Sadly I never made it to either the Labor Day ’82 or Memorial Day ’83 ones. From what you wrote, I take it you were at the Labor Day one. I reckon the following anthem of 1980s SoCal mod-esque youth culture must have been part of the set list:
Thanks David #23 for the plug. I have a simple website that keeps track of Year to Date Activity and calculates the departure from normal for ACE. It is current through September 23, but not much has happened since in the Northern Hemisphere. So, apart from the number of named storms in the North Atlantic, the WPAC and EPAC inactivity results in a very low ACE for the Northern Hemisphere. Tropical Cyclone activity to date
Steve, please be careful using the Unisys files. There are duplicates, tons of missing values, and the inclusion of Extratropical phases, which aren’t distinguished.
From Icecap:
http://icecap.us/images/uploads/TrenberthOp-Edpiece.doc
RE 29. I long for the days of my pork pie hat in the SoCal Mod/SKA scene.
One of the guys in our grad school dorm was in UT.. the untouchables.
You’ve seen them in the cult classic Repo man. Harry dean stanton, emelio estevez.
they were the scooter gang.
The english beat were great. the police and talking heads were great.
Steve just to be sure. Is it based on raw data or if there was any account of miss storm in the past?
RE: #32 – Untouchables …. ah, that certainly brings back memories …. those were certainly the days … KROQ … and when the atmosphere cooperated …. (said naming the letters in Spanish) X…T..E.R…A…..F…M …. Baja California, Mexico. LOL!
Doh! X E..T.R A
I knew I could bring it back around to Climate ….. 😉
http://www.well.com/user/dmsml/xetra/index.html
You get in front of that and it might start to feel warm!
#30. I’ve used unisys files to update 2007/ For Atlantic up to 2006, I’ve used http://www.aoml.noaa.gov/hrd/hurdat/tracks1851to2006_atl.txt .
To my knowledge, people like Emanuel, Webster use the hurdat files and, so even if you think that these files include extratropical storms, surely this is what has entered into the present discourse and it’s not up to me to try to segregate things. On the other hand, if you can direct me to a concordance which itemizes Hurdat storms that should and should be in what you believe to be a coherent definition, I’m happy to re-run things (and would like to do so.) But it’s pointless for me to try to sort out what should and shouldn’t be in the hurdat dataset if the originators haven’t.
I realize that the Unisys data does not have a uniform time structure. I’ve written some pretty little routines to place this data in 6-hour increments consistent with Best Tracks historical data and am pretty sure that I’ve avoided some potential pitfalls there. There are many annoying aspects to scraping unisys data, but I’m getting pretty good at these scraping exercises (and some of my methods continue improving. Some of the methods that Nicholas showed me for scraping temperature data from webpages, I’ve applied to hurricane data and saved myself a great deal of trouble.)
mosher,
Another Dead Head denier? Me too! Will wonders never cease.
You said up thread:
C02 will lead to more tropical depressions
Tobacco is an anti-depressant. I hope that helps. If you were at a Dead show breathing the air should suffice. Such air is also an anti-depressant.
Any prediction on how big the anomalies between predictions and fact have to get before OCO Climate Science takes a fall (or would that be a winter?).
Once OCO Climate Science fails do you think there will be repercussions?
SteveSadlov says:
September 27th, 2007 at 2:30 pm
You would have to be at the right elevation. The lapse rate is quite high due to the directional nature of the radiator. Not only that but on the ground the lapse rate is negative (given current climate conventions).
I’ve added graphics for the other 4 basins – 2007 YTD is very low in other basins as well. I guess Mann and Emanuel won’t be issuing a quarterly report on hurricane activity.
Judith Curry will be here any minute, and in a round-about way, will note the adjusted hurricane numbers are actually increasing as a result of increasing sea surface temperatures which is caused by global warming.
#41. OF course. Silly me. These aren’t the “adjusted” numbers. Once Mann factors in bristlecone growth rates and the population of Djakarta, 2007 hurricanes will be the highest in a millllll-yun years.
RE 41.
No. Dr Curry showed up after we had two cat 5s in a row. Essentially long fly falls caught on
the warning track. She won’t show up while the bottom part of the batting order is striking out,
hitting pop ups to the infeild and getting on base because of catcher interference.
Steve, certainly you know Mann/Scmidt/RC/et.al. better than that. Clearly the trend in the Indian ocean is clear indication that the sky is falling….
A lot of OT posts here, amusing, but still OT.
A few notes on Tropical systems with reference to this season. I have stated on other venues that TPC (Tropical Prediction Center) seems to be trying to upgrade any convective cluster in the Tropical (and in the case of Jerry, not so Tropical) Atlantic. Some of these storms reached TS (Tropical Storm) or HU (Hurricane) criteria for less than 12 hours (in my view some maybe as long as 10 minutes) There is a paucity of ground/sea based observations this season as those storms that made landfall for the most part did not come ashore at well instrumented sites. Lets look at this seasons motley collection:.
First of all, TPC categorizes HU designations by the Saffir-Simpson Scale. Minimum sustained wind speeds for a Cat-1 HU is 74mph (64kts or 119km/hr). Minimum wind speed for a TS is 34kts (39mph or 63km/hr). A sustained wind is defined by TPC as a 1-minute average wind speed. (ASOS categorizes a sustained wind as a 2-minute average, and the WMO (World Meteorological Organization) criteria used by most countries is a 10-minute average wind speed).
Sub-Tropical Storm Andrea never made it to TS Status (although it did burn a name off the seasons TS List.)
TD (Tropical Depression) Barry was elevated to TS status as it approached Tampa Bay FL. It had no discernible eye but a wind of gust of 50kts was reported from Dry Tortugas. It was a TD when it finally reached Tampa Bay.
TD Chantal was elevated to TS status when it was crossing 40 degrees North, hardly in the Tropics. It was transforming to an extra-Tropical system 6 hours later. Calling this one a TS is a real stretch.
HU Dean was the genuine article reported as reaching Cat-5 in the Western Caribbean at least 155mph (135kts or 249km/hr) on the Saffir-Simpson scale. These winds were observed remotely by AF Recon and Quik-Scat Satellite pix. It was still categorized as a Cat-5 when it reached the Yucatan Coast. Strangely, for at least several days after landfall the Mexican Government reported zero deaths. Now theres a miracle for you.
TD Erin was elevated to TS status when it was about 400 miles east of the South TX Coast. The upgrade was based on AF reconnaissance aircraft remotely sensed observations. It never had an eye and subsequent Aircraft and satellite reports showed the storm poorly organized and weakening. The maximum sustained wind attributed to this storm by TPC was 35kts. [whoopee-doo].
HU Felix was another genuine Hurricane and categorized as a Cat-5 storm that followed a parallel path to Dean although somewhat south of that track. It impacted Northern Honduras as a Cat-5. Deaths were reported.
Sub-Tropiccal Storm Gabrielle was elevated to TS status as it approached the NC Coast. The storm ultimately pass over Pamlico Sound where the weather station at Hatteras reported a peak wind of 44kts (51mph or 82km/hr).
TS Humberto was elevated to HU force just as it crossed the NC Outer Banks. No land stations reported such winds even though the storm was surrounded by observation sites as it passed over Pamlico Sound. It was downgraded shortly thereafter to a TS once again.
TD Ingrid was elevated to a minimal TS after a day or so while it was over the Tropical Atlantic well east of the Lesser Antilles. TPC raised the max winds to 40kts the next day, but 6 hours later knocked it down to the 35kt minimum. It continued to weaken as it approached the Antilles and eventually expired in the Northeastern Caribbean. Max sustained winds as it crossed Guadaloupe was reported at 25kts (29mph or 46 km/hr.)
Sub-Tropical Depression Jerry was upgraded to a TS for several hours even though it had no confirmable warm core and was over waters whose temps were in the mid 70sF (21-26C) and no central circulation surrounded by deep convection was observed. Calling this a TS was a stretch.
TD Karen was elevated to a minimal TS 6 hours later on this past Monday. By Wednesday morning a ragged eye was observed and the Max wind was raised to 60kts (69mph or 110km/hr). The forecasters had great hopes for this system expecting it to reach minimal HU strength within 12 hours, however, the storm encountered strong southwesterly wind shear and started to come unglued. The latest Discussion at 5PM EDT today had it back down to 50kts and it is forecast to weaken further for the next few days as it moves northwestward from its present position east of the Lesser Antilles to the open ocean north of the Antilles.
Finally, TD13 in the southwestern Bay of Campeche was elevated to TS Lorenzo earlier this afternoon as it approached within 60 miles of the Eastern Mexican Coast. An AF Recon Plane found that an extremely compact center circulation had formed within a broader circulation and detected a remotely sensed wind above 60kts so at 5PM EDT TPC raised the maximum sustained wind to 60kts (69mph or 110km/hr). With the storm expected to be inland within 12 hours their forecast for 2AM EDT Friday is 65kts (75mph or 120km/hr) which reaches the minimum criteria for HU force. Whats the morning line on whether they will elevate this to HU in the few hours they have left?
All of the above suggests several things. First, they are pushing the envelope on storm intensities, which just happens to accommodate their pre-season forecasts for an active TS/HU season. Ive spent too many years dealing with Tropical storm forecasts and analyses not to recognize high-balling when I see it. There may be a question as to whether the standard remote sensing wind equipment, the SFMR (Stepped Frequency Microwave Radiometer) is reporting sustained winds or gusts. The SFMR uses the IR energy produced by wind driven Ocean foam to determine wind speed. The temperature accuracy of the equipment is about 0.17K, but its precise relationship to wind speed under all storm conditions raises some questions. Finally, this season is the best argument one can make for the need to use an intensity/area/duration index (like the ACE) to probably characterize a season for comparative purposes.
Steve mcintyre
You rightly noticed that the latest forecasts for ACE range between 140-200 when the actual reported by some is just under 60 or so
As part of their argument the forecasters stated that because of the possibility of La Nina in the Pacific, this favors more hurricanes and helps to extend the season into November. Neither of the two reasons is valid as a consistent event. It only happens some time. The Hurricane records also show the opposite. Since 1953, at least 21 % of the non El Nino years experienced close to the average of only 10-11 storms per year. La Nina years like 1970, 1974, and 1975 had no storms in November and very few even in October. There was no extension to the season. If there is no underlying source for the extra energy to extend the storms into October/November, then there will be none regardless what the past statistic said. The extra energy may have been there in the past but may not be there this year nor was it there last year, a period of low solar electrical activity. Time will tell.
Aurbo.. Sorry Sadlov,Sam and I should not be allowed on the same thread. We will get a room.
Steve, #37. Counting the extratropical storm phase of the TC is incorrect and Emanuel (2005) states as such. You would be incorrect to include them (and to assert that TC researchers don’t care) and you will be surprised how far off your results can be for storm days in the Atlantic. The Power dissipation index is highly sensitive to very high winds (wind speed cubed) and the inclusion of the post-Tropical phase observation points only changes the trend by about 4%. Yet, when you include them for ACE/PDI calculations for 2006, you will find that your numbers are off by about 20%. The number of extratropical observations in the HURDAT has increased dramatically since the 1970s and their inclusion for some calculations can create a huge artifical bias/trend in the past 15 years of the record.
The difference is HUGE when you calculate storm days with them included. You will notice when you scan the HURDAT file for “E”. The README webpage, HURDAT description discusses the E flag for extratropical storm. Also, including Subtropical storms is not correct either.
According to my numbers , the Northern Hemisphere is about 29% below normal to date in terms of ACE. The EPAC is about 60% below normal to date; WPAC -24%; NATL -18%.
RE: #49 – Please double check your write up of Humberto. That was a Gulf storm. Poorly organized until just off shore, then “miraculously” became a TS then a supposed Hurricane within less than a day. It never had a real eye, and had a form factor that indicated that parasitic cold front formed in the SE quadrant. More of a hyperactive home grown mid latitude cyclone than any thing else. As it neared shore it was clearly sheared into two separate masses of moisture, with significant subsidence resulting in clear air behind the SE quadrant cold front. It reached land near Beaumont TX then was soon absorbed into the polar jet.
Good analysis in #49. I just wanted to note that in TS Erin, the rotation of the thunderstorm cells during almost the entire duration of the storm was clockwise (backwards) which just makes it a strong collection of thunderstorms in my mind.
For the period of 1850-1900 there is a reporting deficiency that has to do with global communications and world reach of the human population. Back then there were less eyes at sea, less ships, no airplanes, crude communications, and less total human extent.
Today, instant global communications, ships and planes everywhere, more eyes, more extent.
Same thing happens with tornado numbers…there were lower numbers in the past, but now with technology advances such as doppler, interstate highway and more roads, plus more eyes, more extent, storm chasers everywhere, there is hardly a tornado that goes unreported where before they just spun harmlessly in unpopulated areas, without notice. Just look at TV news today, we routinely see tornadoes live on TV, because doppler tells us where to look.
Thus any upward trends on total hurricane numbers in the last 150 years may have as much to do with better and more frequent observations reflecting the human condition as they do with climate change.
The possible stages of a cyclone are:
Subtropical (S)
Depression (D)
Tropical Storm (T)
Hurricane (H)
Extratropical (E)
Storm count should consist of cyclones which attained T or H stages at some point in their existence. If they did not attain T or H, then they should be excluded from storm count.
Storm-days should consist of T and H stages only. S, D and E stages should be excluded.
Hurricane-days should consist of the H stage only. S,D,E and T stages should be excluded.
Emanuel, Webster and Mann tend to include subtropical storms in their papers, which is incorrect but has been their general practice nevertheless. Including subtropical storms in a tropical storm count makes the modern era look worse than it really has been. I believe that Steve M refers to this incorrect practice.
I think that Emanuel and Webster properly excluded the extratropical phases of storms in their papers.
Inclusion of extratropical days will inflate the storm-days. Inclusion of subtropical storms will inflate the storm count. Since extratropical and subtropical data is mostly a modern creation, and were ignored in older seasons, including them makes the current era look worse than it really is.
Re #55 To help quantify the gap, here is a map of the ship observational density in the tropical Atlantic, for 1900 through 1979. There is a void in the eastern Atlantic.
And there are special gaps in key periods, as shown in this time series of Atlantic ship reports (thousands per year). Note the big gap in the 1940s, the peak of the last active phase of the AMO.
RE: #57 – RE: Time Series link – Fascinating. You can clearly see the boom in commerce during the late Victorian and Edwardian, suddenly truncated by WW1. In the 1920s, some recovery, but never to the previous level. Then, the doldrums of the Great Depression, followed by the slight uptick, but again, never reaching the previous Gilded Age boom. Then, after WW2, the long build up to the 21st century megaboom driven by multimodal containerized logistics and the long unprecedented period lacking any serious artificial interruption since the war.
You can also see the impact of 1970s stagflation. If this were to be continued to present, the final great mega ramp would reach even higher. Today, ships wait for days outside the ports, due to congestion. It’s like a conveyer belt of behemoths capable of cutting through all but the most drastic weather.
#56 Webster et al. (2005) and Holland and Webster (2007) only dealt with storm counts of various Saffir Simpson categories or “broad brush” categories of storm intensity — the extratropical question would never come up. Emanuel (2005) did include the extratropical phases in the annual PDI calculations, but as I clearly stated, it does not affect the trends, only individual years (and can by a lot ~20%). Subtropical storms were included in Holland and Webster (2007) incorrectly.
If you take the HURDAT and not account for EX, since 1971, you will have added in over 200 extra storm days (EX phase with winds > 35 knots). In addition, approximately 14 extra hurricane days are added in, especially in 2005 and 2006. Steve M’s time series is artficially high for Atlantic storm days, especially after 1995, and should be corrected.
Re #53:
Steve, youre exactly right. Somehow. I conflated Gabrielle and Humberto, so what I said about Humberto pretty much applied to Gabrielle. My bad.
So here is the proper entry for Humberto.
TD Humberto spent its entire pre-landfall in the Western Gulf of Mexico. It was designated a TD by TPC around midday Wednesday, Sep 12th. It was elevated to a TS by 5PM and then at 1:15AM Thursday morning was raised to a HU. It moved inland near High Island TX a few hours later and except for some HU force gusts at High Island, there were no HU force winds reported on the mainland. Humberto was categorized as a hurricane by TPC for less than 12 hours.
Re #56
The sub-Tropical designation doesnt necessarily fall into the hierarchy anent storm strength that your list implies. Sub-Tropical systems have often been well up into the TS strength and one made it to 65kts, the minimum force for an HU. During the past 10 years TPC has been all over the place in defining these systems and whether or not they should assign them names from the seasons TS/HU list. This year thats what theyre doing and it sort of pads the list of storms.
Finally, It didnt take TPC long to upgrade TS Lorenzo to hurricane force, just in time to add the name to this seasons list before the storm buries itself in Old Mexico. It also adds to the landfalling HU list as well. It will be interesting to see how this years post-season analysis treats these systems. But suspecting their bias for the big AGW numbers, I doubt whether theyll downgrade any of them. In a system that should be objective, theres an awful lot of wiggle room for subjective decisions to be made.
(Caution: obscure technical details of interest only to me and Ryan. Casual readers may wish to skip this post)
Actually, Webster 2005 includes a graphic on global storm-days. They properly exclude extratropical phases in their storm-day calculation.
Mann Emanuel Holland Webster include subtropical cyclones in their storm count, in an article titled, “Atlantic Tropical Cyclones Revisited” (September 2007).
(End of obscure details.)
Beyond this minutiae I agree with the thrust of Ryan’s post.
re: 61 (re: 53) aren’t hurricanes defined by “sustained” or “constant” winds of 74mph vs. wind gusts? Of course if the sustained period threshold is dropped to say ~5 seconds, a gust is “sustained” isn’t it?;) How long of time were the sustained winds of High Island measured at hurricane strength?
The tracks in HURDAT identified by the asterisk(*) are the ones used in calculating ACE.
Re #61 I agree. My paragraph erred on the side of simplicity at the expense of precision.
Concerning Lorenzo, get ready for the “rapid intensification” stuff. Technically, Lorenzo was a officially a tropical depression at noon and a hurricane 8 hours later, which is more rapid than Huberto. The full story, of course, is that it was already a cyclone with pretty good structure which consolidated a broad center into a very small core.
re “how long” — sorry, see answer in 49 para 3.
To be more precise in my #64 I should have said the following.
The tracks in HURDAT identified by the asterisk(*) are the ones used in calculating ACE. As long as the wind is equal or greater than 34 knots.
Steve Mc,
Don’t forget that the NHC periodically reviews and reclassifies TC’s for strength, severity, type, etc. So, even when September officially ends, the September storm data may change months later.
#69 follow-up,
From Dr. Jeff Masters,
“Karen was probably a hurricane yesterday morning, since a NOAA hurricane hunter aircraft that arrived at the storm during the afternoon found winds near hurricane force. These winds were much stronger than the storm’s satellite presentation suggested. This flight occurred after Karen had already peaked in intensity, so it is likely Karen was a hurricane for a few hours. The storm may be upgraded to a hurricane in post-storm analysis.”
In addition to adjusting some numbers, types, etc., this brings up an interesting question. He states that winds were much stronger than the satellite presentation. He also states that Karen had already peaked in intensity. My question is how do they know it peaked in intensity if the satellite wasn’t measuring wind speeds correctly. I’m also wondering why the satellite wouldn’t be registering wind speed to a decent accuracy, and is this a one time thing or something that happens with greater frequency?
#47. Ryan, thanks very much for this information and for commenting here. Is there a classification of the 2007 that is available either at unisys or at your site?
#52. David, that’s a pretty interesting map. Where did you get it from? I’ve wondered whether observation in the late 19th century might have been better than early 20th century in some respects. It took a long time for trade to re-build to 1913 levels and the 1930s was the depression. Also 19th century shipping was still largely sailing ships, which would use trade wind routes more than steam vessels.
Re:52 and 55
Look at the combination of the arguments made in #52 and #55. ACE must be the pivotal value. AW’s observation/reasoning in #55 is hard to argue with.
Cross reference the two: higher verifiable observation numbers combined with lower ACE values.
What’s a man to make of this [bad pun, I know..]?
On the face of it, hardly a case for TS/hurricanes as poster children for AGW/AGCC.
Counter, anyone?
SteveM
The posting # are no longer useful as refs.
My comment [shows as 67 above] was in response to [original]:Ryan Maue {47} and Anthony Watts {50}.
Re #76:
The logs of sailing ships were routinely used to do post analyses of storm data. The problem was that if the ships really tangled with a Cat-4 or greater storm there was a significant likelihood that it would never make it to port. We used ship data almost exclusively in the 1940s and 50s to locate brewing storm systems. However, once satellites and more active reconnaissance data became available, ships would avoid the storms and we couldn’t get any solid data when they were out of aircraft range. The classic book, Hurricanes by Ivan Ray Tannehill published originally in 1938 and revised periodically up until 1956 provided excellent accounts of ships encounters with Tropical storms and hurricanes going back to the mid 19th Century. Tannehill also compiled the first comprehensive listing of TSs and HUs between the late 19th Century through the mid 1950s.
My last Ref to #76 is now #66.
Re #65:
Jeff Masters is hardly an objective source. He is another one of these enthusiastic forecasters whos hung out with a pre-season forecast of above normal TS and HU activity. In the old days we used to refer to hype artists as bombardiers.
It seems to me that max sustained winds speeds in Tropical storms the past few years have been over-estimated for one reason or another. A logical problem is that remote wind observations are reporting gusts rather than sustained winds. Reconnaissance reports observe winds several ways. Flight level winds derived from the air-speed indicator and GPS to compare with true ground speed is the most reliable. Ground speeds are estimated from flight level winds by using and empirically derived formula in which the FL winds taken near the 850mb level average about 1.3 times the surface wind measured by dropsondes. Dropsondes released near the eye-wall are also quite reliable. In their descent by parachute they report back to the aircraft GPS derived wind speeds (actually equivalent to ground speeds) every ½ second until they hit the water.
The newest device on the block is the SFMR (Stepped Frequency Microwave Radiometer). This is a passive device that receives IR radiation in several wavelengths from ocean spray/foam. Thermal energy emitted by this target is purported to be proportional to wind speeds. The instrument can measure IR energy accurately to 0.17K. The device, about a foot long, is mounted on the underside of the wing of the aircraft. The technique was calibrated by comparing the IR signal with winds speeds received from dropsondes. The investigators claim an accuracy of about 2.5mph. There may be a problem in distinguishing sustained wind speeds from gusts. Dropsondes can discriminate by summing the horizontal distance the device travels in 1 minute. This wont work with SFMR signals since the target is always changing and there is no good way of telling how the thermal energy was accumulated. or integrated over that time period.
Years ago the near surface winds were measured directly by aircraft flying at 600ft (~200m) off the deck. This practice was curtailed and largely abandoned after theVnavy lost a P2 Neptune aircraft with all hands as it investigated hurricane Janet in 1950. I remember well the last message we received from the aircraft which said, beginning penetration No trace of the aircraft, the crew and a few passengers was ever found.
Other methods include observing the state of the sea under the eye-wall (from aircraft circling within the eye) and also using statistically derived regression curves using central barometric pressure and/or the horizontal pressure gradient to solve for wind speed.
What strikes me as particularly useless and very much misleading, is the fixation with wind speeds in determining whether a “storm” is a “hurricane” or not, as practised by the NHC and an increasing number of other “observers/experts”.
British Admiral Beaufort, some 130 years or so ago, put together as table that in practical terms stands unchallenged by anyone who has ever been out on blue water [no shelter, full brunt of the elements {wind, waves, swell, etc.].
Beaufort defines a “Full Storm” as SUSTAINED 48-55 kts [64-72 mph or 103-117 kmph]. A “Hurricane” is defined as SUSTAINED 64 kts and over [73 mph and over or 118 kmph and kmph for landlubbers..].
Key here is that when one looks into the details of Beaufort’s scale, one sees that this very experienced mariner was in fact measuring ACE values.
Having been at sea in 50+ kts both in both relatively sheltered waters and on true blue waters, I can assure you that the good Admiral was right. Seeing your barometer drop steady pace by the quarter is one thing. Even in sheltered waters you’ll be in for a ride. In open waters however, the 50kts sustained that brings will produce 35ft steap breaking seas in the Med, and 50-60 ft roaring monsters in the open ocean.
The NHC naming mid Atlantic mini-swirl depressions which happen step over the lower threshold [of what, 25 kts or so] for a couple of hours and wind up having an ACE value of 0.5 or 1.4 a “Hurricane”, not to speak of the fact that Mann et. al. write a paper purporting to prove their point on the back such data, is worse than a joke. It’s offensive and very damaging in terms of the general public’s understanding of science.
Assuming any of these people have the “b…s” to do so, they should come out to sea in 40-50 kts for a reality check of what a “storm” or “hurricane” really is [I’ll come with them just for the pleasure of reminding them not to throw up their guts to windward and then stand back to watch them do it…].
Here is a comparison of the original HURDAT to the latest revised.
http://www.aoml.noaa.gov/hrd/hurdat/original_revisedHURDATtable3_07.htm
My total database ACE matches theirs. I did notice a couple years different in value by one evidently due to rounding. They canceled out though.
There are more than 4000 tracks in the database that aren’t used in calculating ACE. This chart shows the average track ACE per year for just those tracks that are used in calculating ACE.
Re #62 Steve M, the plots are from this webpage . It’s a short library description of Volume 2 (Pacific) which implies there’s a Volume 1 (Atlantic), possibly only in hard copy at a university library. I do see a footnote that raw data is available “on tape”.
The big gaps in aerial coverage, the changes and variability in measurement techniques and the occasional time gaps like the 1940s make me wonder whether the historical SST recontructions are worth much.
Oops, that’s “analyzed data” that’s available on tape, which might mean post-adjustments and interpolations.
Re: #74
That plot is most revealing to me. One can see some cyclical nature to the ACE as you have plotted it and also an indication of an historical and trending under-count for lesser valued ACE events.
tetris is a squid.
Re: 44
aurbo – Thanks for a great synopsis of the 2007 hurricane season thusfar.
Ever since the NHC gave a name to “subtropical” storm Andrea, I knew they were trying their hardest to make sure that we had an “above normal” hurricane season, so as to make their predictions come true.
Given that we (apprently) now name storms whose peak winds barely make it above 40 – 50 mph, a wind speed routinely exceeded in a typical midwest thunderstorm, I propose we start naming ** all ** low pressure systems and storms on both land and sea. It would sure liven up the evening weather forecasts … “as low pressure system Bonnie bears down on Chicago, citizens should be on the lookout for winds of 40 mph in thunderstorms and possibly even some heavy rain…next advisory for Bonnie will be at 0800 tomorrow…” ;^)
But Anthony, that’s just more proof us evil humans are ruining the planet with our technology, like airplanes and MMTS units and satellites and radar. More proof any warming is anthropogenic. We’re causing it by measuring it better. If we just didn’t do it so well, it wouldn’t be warming. Save the planet, go back to glass thermometers and ships with sails!
My new battle cry: “Stoppler the Doppler!”
That’ll reduce the numbers. Well, at least until the adjustments, when “Mann factors in bristlecone growth rates and the population of Djakarta”…
Lorenzo:
http://www.nhc.noaa.gov/refresh/graphics_at3+shtml/144557.shtml?swath#contents
Now, if I were in the business of “manufacturing” data, and had a task to “make” a hurricane out of nothing, and was sort of lame, I too would make a perfect teardrop, with geometric precision. How more obvious can one be? I mean, if I were given the dastardly deed, I’d at least try to put in a more ragged looking shape for my “hurrican intensity wind swath” lest someone think I was commiting data fraud.
RE: #79 – Every decent Pacific Storm that comes in during our late fall – early spring prime time for high powered Gulf of Alaska systems has truly sustained winds (meaning, steady wind that keeps blowing at that speed, until the synpotics move the wind zone along) above TS breakpoints. Name it and claim it! Coming soon to the “National Hysteria Center (NHC) – NPAC Division” blog!
RE: #72 – Arrrr, shiver me timbers ….. kakkakkakkakkak! So, one time, I was on a recreational dive out of San Pedro, out to Catalina. Glass in the AM. Santa Anas cranked up and by 3PM they were doing a steady 35+ Kts out on the open water. Our craft was a 100 footer. Had to tack all the way back to San Pedro, didn’t get back in until well into the evening. Swells had to be up in the 30 plus foot range at the “peak” of the experience.
Friend of mine, who was doing commerial diving as a side line to pay for school, was to board a research ship in Monterey Bay and ride with her into SF Bay then do work with robotic submersibles in high current low vis conditions. At a port dive bar, is chatting w/ old salt who says something to the effect of “‘ave ye seen da forecast? Arrrrr …. heavy seas man. If you feel something hairy in your mouth, clamp ye jaw down ‘ard… cuz that’d be ye #$!#!.” Sure enough, my friend reported that, after putting to sea later that evening and catching a few winks, he was awakened by being launched into nearby bulkhead from his bunk. He and a number of others spent the remaining hours until coming through the gate clipped into safety harnesses clipped to the rails. Arrrrrr, shiver me timbers! 😉
Is it just me or is there a 60-70 year underlying waveform in that data; especially the Hurricane days data set. I don’t suppose that you could do a quick Fourier transform on the very first plot could you.F
RE84.
Hey, you ever hang at the Long beach Yacht club?
Sadlov, lots of people be talkin’ like pirates these days. An’ a bottle o’ rum!
Steve,
my home town is expecting 40-60 MPH winds at the higher elevations today. I want to name it “hurricane Are you kidding?” The next time it happens, I want to name it “hurricane But it’s windy outside!!” Later in the year I expect to be able to name some high winds as “hurricane Cold mutha” and “hurricane Damn it’s Cold.” A,B,C,D protocol and everything. Can I have those names?
“you could do a quick Fourier transform”
How could FFTs on all of this stuff be bad?
It would seem that picoHertz would be all the rage among the Climate Scientologists.
RE 88. Your home town is expecting winds of 40-60?
The moon has wind? arr arr arr
RE 90
Lots of moons have winds but polite people usually leave the room. arr arr backatya
I took a closer look at the recent Mann Emanuel Holland Webster paper on Atlantic storms and found that they very likely included subtropical cyclones in their “tropical cyclone” study.
That should be a no-no, as the two types of cyclones are different animals.
Including them inflates the last forty years of the record by slightly over 0.5 storms a year. That is small but noticeable. Even if it was not noticeable it should not be done.
I did the charts and writeup in auditblog form here .
Re: # 50 number of ships
Anthony,
In 1870 there were 65,000 vessels in the world fleet, as compared with 24,000 in 1914. The world fleet did not build back up to the 1870 figure until 1973.
With the introduction of iron and then steel in ship construction ships got larger (both sail and steam) and so fewer were needed. It took the vast increase in world trade after WWII to overwhelm the effect of this factor.
So there were a lot more eyes on the sea in the 19th century than there were for most of the 20th century.
The routes they followed were also vastly different. It would be interesting to plot sailing ship routes and steamship routes relative to hurricane tracks and see which were more likely to cross them. Maps of these routes exist.
Moreover, with wireless 20th century ships had a better idea of where hurricanes were and because they were powered were in a better position than 19th century ships to avoid them. The German school ship Pamir, a four masted steel barque, had wireless but it was powerless to get out of the way of Hurricane Carrie in 1957, and was blown on her beam ends and sank.
RE 92. Ordinarily I do not acknowledge people who out quip me.
In your case….
I will make no exception.
#94. Mike, where did you get those numbers from? I’ve been interested in this for a while. Also the 19th century ships were still sailing vessels; many would follow the trade winds; which is where hurricanes form.
RE: #94 – Your observations are completely in line with the ship records plot. No surprises in what you wrote. Also, beyond consolidation / larger / faster ships especially during the late 1800s and early 1900s (well, actually, an ongoing trend even now) there were wars and economic slow downs, also having their impacts on total sea miles traveled / year.
RE94, Mike H. Thanks for pointing that out I didn’t know that there had been a reduction in ships due to the conversion from wood to iron, but it makes perfect sense and the trend can be seen in the graph. The overall extent though of observations though for the last century seems to have increased.
#71,
That’s true, but he’s not the one that does the re-analysis. That’s the NHC, and they do it on a regular basis. I don’t know what all goes into their re-analysis, and I know that a number of people have disagreed with the results of those re-analyses. He does have a good knowledge of what the NHC does though, and that’s why I quoted him.
#83,
I can attest to that. I was in Victoria, not a cloud in the sky. Sustained winds off the Pacific were 75mph, all day. It was quite an experience.
Here is an interesting graph.
The blue line represents the hurricanes and tropical storms which stayed entirely at-sea (at least 100km from mainland or an island). Prior to 1945 these were detected by ships.
The blue line shows a general decline from the 1860s to 1945, with a noticeable drop as the world entered world war, then an economic depression, then a second world war. Then, conincident with aircraft and then ever-improving satellite coverage, the reported at-sea storms increased.
The red line represents the SST in the main development region (6-18N,20-60W)(my data table starts at 1900).
Interestingly, the red line shows SST rising remarkably from 1925-1945 yet at-sea storm count remained flat. What’s up with that? Either storms were under-reported or the connection between SST and at-sea storms is tenuous (or both?). Take your pick.
Then, remarkably, SST began a slow decline for three or four decades while reported at-sea storms strongly increased. Here too, what’s up with that?
By 1995 SST had returned to the reported levels of the 1940s, yet reported at-sea storms were four times higher than in the 1940s. Once again, like a broken record, what’s up with that? Were storms missed in earlier years or is the SST/storm count connection weak, or both?
As noted in many places, the landfalling and near-land Atlantic storms have cycled but show little long-term trend (I’ll post a chart later). The long-term Atlantic increase has been in the entirely-at-sea category, a category which shows only a loose, odd relationship with SST but (my opinion) a stronger relationship with changes in detection.
Re: 88
Here in NH, we have Mt. Washington, where there are always tropical storm/hurricane force winds. As I write this, the temperature at the summit is 39 deg F, winds 44 mph gusting to 51 mph. The weather station is a neat place to visit (not in the winter, though!!!).
Re #94
Since the dumb ships theory that follows your line of thought here has appeared in the peer-reviewed literature, one would think that those who proposed the idea would have provided the information and analyses on intersecting hurricane tracks and shipping routes. Unfortunately I have only seen the proclamation.
Re # 96 Sources
Steve,
The best one stop resource is http://homepages.ihug.co.nz/~j_lowe/Maritime2.htm
See also http://www.coltoncompany.com/shipping/statistics/wldfltgrowth.htm
Yes, sailing ships tended to follow the trade winds. But it was a bit more complicated than that. The idea was to follow the best average course for the time of year. These were developed by Maury in the US in the early 19th century. He requested all shipmasters to send him records of their voyages so that he was able to do this. In the North Atlantic and the Southern Ocean it also meant using the Westerlies. The problem is, that the wind systems move around, so following Maury’s directions did not guarantee you would find the trade winds or any other wind where you expected. It was not until late in the 19th century that most shipmasters followed Maury’s directions. Until then individual shipmasters followed their own hunches. Those who follow Maury’s advice dramatically shortened times taken to go port to port, so the number of sampling points per voyage went down. It also meant that less of the oceans was sampled as the average routing was tighter.
Which wind systems saw what proportion of the world fleet depended on the pattern of world trade, which altered systematically with each historical New Economy. Consequently which oceans were sampled and how much altered systematically for that reason as well.
The opening of the Suez and Panama canals must have had an effect too.
Ships traveling from Europe to Asia before the Suez canal opened had to traverse both Atlantic Oceans and then the Indian Ocean and would have followed the North East and South East Trades in the Atlantics and the South East Trades in the Indian Ocean. Afterward the Atlantic route was used much less. Super tankers which can’t use the Suez canal would have reversed this somewhat, but they follow great circle routes, not the trades.
The Panama Canal probably drew more ships into the Caribbean, visited by many hurricanes. Sailing ships from Europe or the East Coast of the US headed to Asia or the West Coast of the Americas would have gone nowhere near the Caribbean. Steamships would have traversed it regularly once the canal opened across the Isthmus of Panama.
As I explained in a previous post, the sources of bias in SSTs are many and considerable. For example, from 1850 to 1920, the extreme South Atlantic and the Southern Ocean were crossed regularly by many ships. Afterward they were empty of them apart from a few whalers and survey ships. Considering that one of the signals of CO2 induced warming is warming at or near both poles, this is a trifle inconvenient for anyone wishing to test that hypothesis. Then you have the instance of convoying in World War II which I believe led to ships in the North Atlantic sampling mostly the Gulf Stream (which explains the sudden and enormous warming anomaly at that time).
There is also the huge sampling problem created by drawing samples on the basis of cartographic grid squares. This is excusable on land as land forms do not move, so an ocean littoral, an interior plain and a mountain chain, all with evident sampling biases (see the recent posts on Wellington), at least stay in the same place. The oceanic equivalents in the form of currents and upwellings do not. They move around a lot. A series of measurements at a specfic grid reference could be sampling the centre of a current or upwelling, near the edge or outside it depending on the year and the time of year. It would be like Vancouver migrating between the Straits of Georgia, the Selkirks and the Great Plains. How would you make sense out of “Vancouver” measurements if it did that? In the case of the upwelling off the coast of South America in an El Nino year, it would simply disappear. How would we handle Vancouver disappearing from time to time?
As far as I can see, no-one has even conceived of these problems, even less figured out how to deal with them. In addition, these movements are not independent events, so you can’t make simplistic statistical adjustments. They move as the climate changes under the impetus of drivers operating cyclically (solar cycles, in my opinion) but with a whole lot of chaotic dynamics thrown in as well. It is a dog’s breakfast, statistically.
Imagining the oceans as static mill ponds and filling in empty squares with measurements from adjacent ones as Jones has done, is about as excusable as the GCM modelers who assume the atmosphere is a pane of glass and forget about winds and clouds and electro-magnetic phenomena.
But hey, as we keep saying, this is Climate Science.
Look at what I snagged from an online science magazine:
Mann those hurricanes are going to get stronger and more frequent. Real soon now.
So what does our brilliant Mr. Flannery have to say about hurricanes?
Can some climate scientist explain how a really warm Arctic 55 million years ago explains current AGW?
I suppose it could if you assume natural cycles. However, I don’t think Mr. Flannery would agree with that.
This is craziness.
Pardon the unclosed link tag.
More Mr. Flannery from the second link.
So what is he proposing? A return to slavery to prevent global warming?
Pretzel logic.
I updated the short-lived storm time series ( link ).
Almost all of these cyclones needed modern technology to detect their storm-force winds and cyclonic nature, technology which did not exist in earlier years.
The technology continues to improve and expand so the trend probably has not peaked.
Several comments:
The pathway to riches and glory: There may be many countries that have yet to pick their Man of the Year. Just find one, move there, and propose a theory that exceeds all previous estimates of AGW, and youre a cinch to snatch the title. The tragedy is not that Flannery is a certifiable nut-cake, but that the gullibility of the scientifically ignorant public and politicians is allowing such ideas to proliferate and find their way into legislative excesses.
Until the turn of the 21st Century, researchers lacked the capability of remotely detecting wind speeds on the micro-scale. Now suppose that, in todays world, we had a weak Tropical Depression in which a convective cell produced a small vortex say a waterspout which is not uncommon under these conditions. Should one then elevate the depression to a Cat-3 hurricane based on a legitimate observation of a wind speed in excess of 100kts (115mph or 160km/hr). To characterize storms on the basis of squalls around even a portion of the peripheral circulation is a prescription for rampant hyperbole.
Since my posting on this seasons storm events two days ago, we now have Lorenzo and Melissa to add to the list.
TD Lorenzo formed in the Bay of Campeche Tuesday evening (Sept 25th) and remained a depression through about 2PM (EDT) on Thursday when an AF reconnaissance plane reported surface winds of 69kts and then 74kts in the SW quadrant, this presumably from their SFMR sensor, despite a maximum flight-level (850mbs) wind at that time of 52kts. The earlier ob prompted TPC to elevate Lorenzo to a TS (which was probably justified) and then to a TS with a max wind of 60kts on their 5PM EDT advisory. This was a compromise between their FL winds and the SMFR reports which they apparently (and justifiably so) did not take a face value. Finally, on the 11PM EDT advisory TPC raised the max wind estimate to 70kts thus creating another hurricane to add to this years list. Since there were no further recon reports after the last ob at 1937Z (3:37PM EDT) and the satellites at 11PM were in their seasonal period of eclipse (i.e. not available) the 11PM discussion was predicated on land-based radar (not a reliable source of wind speed) and the trend(!) of surface pressure anomalies from the last recon ob almost 8 hours earlier. In other words, it was an estimate and not an observation. The storm made landfall around midnight local time and TPC estimated max winds were 65kts (75mph or 120km/hr). I am not aware of any surface reports from Mexico of sustained winds of 64kts (the minimum for a cat-1 hurricane) and Im guessing there werent any. So TPC not only got TS out of Lorenzo that they were expecting, but a hurricane to boot that they werent.
TS Melissa. Yesterday, TPC determined that an area of organized convection in the Eastern Atlantic SW of the Cape Verde Islands was well enough organized to designate as a TD. None of the models were very enthusiastic about this system as it lay in an area of some shear and in a region where SSTs were not overwhelmingly warm. At 5AM today they decided in the absence of any data other than satellite observations that the TD had strengthened and max winds had reached 35kts. This was just enough to allow TPC to designate the TD as TS and so TS Melissa was named. As of now the latest satellite pictures show that the system is under considerable shear with most of the convection blown off to the E and NE and the surface circulation exposed to the SW of the cloud canopy. As for the objective forecasts, not of the generally used dynamic forecast models can even find this system to be able to provide a forecast. This is another dud among some others this season that will go into the record books a Tropical Storm.
So the questions remain. Is TPC justified in elevating so many Tropical circulations to TS status or greater this season. Its not an easy answer. If estimates are allowed to be based on a broad area of probabilities of wind speeds in the absence of hard data, then if one chooses to always pick the high end of the range or probabilities the argument could me made that all of these systems qualify. I was always taught that in the absence of the need to select the path of least regret which pertains to systems that are actually a threat to people or property, one should stick to the median of the range which is where the highest likelihood of being accurate lies. I remain partial to the notion that Tropical systems this year are being hyped to justify earlier forecasts and satisfy the projections of the community of AGW proponents.
Here’s a plot of weak, short-lived storms as a percent of all storms, by season ( link ).
I entered the 2007 to-date value with an adjustment: I excluded two short-lived storms (Humberto and Lorenzo) on the assumption that they were strong enough to have been detected by conventional means.
Here’s a plot of Atlantic storms by proximity ( link ). The lines are constructed by nine-year simple smoothing.
The red line is the entirely-at-sea storm count. Those storms were detected by ships (pre-1945) and then increasingly by aircraft and especially satellite.
The blue line are those storms which either struck land (including islands) or came within 100km (close enough to be noticed).
What a difference in patterns. As noted before, the entirely-at-sea plot matches changes in ocean detection. The land plot approximates the AMO pattern (active-phase and inactive-phase).
If it is assumed that the land plot approximates total basin activity (once ocean detection is improved) then an intriguing possibility is raised: perhaps the active phase of the AMO peaks in its first ten to fifteen years and then progressively weakens. If that is true then maybe we’re experiencing the peak of the current AMO cycle and will see a progressive decline (on average). (Ongoing changes in detection and classification complicate this, of course.)
There is no question that the number and intensity of past tropical cyclones has been underreported, especially compared to today’s ‘generous’ methodology. There is also no question that all of the peer-reviewed papers tying hurricane activity to global warming do not handle this first point affectively (if at all), making these papers worthless junk science. (How did they get through peer review?)
Emmanuel, Mann, Curry et al are apparently not qualified to do climate research if they do not have the ability to understand the data they are anaylizing. This is simple stuff! How can supposedly intelligent people be so ignorant?
Here is a nice little interactive hurricane tracker from MSNBC Weather News.
Their list runs from 2004 and includes some Pacific storms.
http://www.msnbc.msn.com/id/7845030
Quoted source NOAA
Re: # 113
Could it be because of the algorithmic method of teaching science (versus the visual/spatial) and because no-one taught them the history and philosophy of science so that they thoroughly understood the scientific method? And because they have not taken formal training in time series analysis, or in the observation of primary data (so that they understand the vicissitudes and that all numbers are not created equal)?
It seems to me that the failings of climate science are as much about the failings of scientific pedagogy as about anything else. Don’t forget that they come from a range of scientific disciplines – physics, astrophysics, earth sciences, atmospheric sciences. This tells me there is a systemic pedagogical problem in science. To put it succinctly, science is training plumbers rather than engineers.
Addendum to 105
The reason why you need to know if you are sampling a current of outside it, is they are always at a higher or a lower temperature than the surrounding ocean. The margins contain gyres of mixing current and ocean water so are also untypical of the surrounding oceans. The huge jump in SSTs in WWII shows the scale of the problems these factors introduce.
The probable solution would be to apply data mining (machine learning) techniques to the 15 million observations in order to detect the dynamics of the current system through historical time and identify which historical observations were in current, on the margins and outside. Then you can figure out appropriate sampling schemes.
The Alberta Ingenuity Centre for Machine Learning is one of my clients. Perhaps I can interest them in the problem.
I’m laughing like crazy… two years in a row now the AGW scaremongers have been predicting catastrophic hurricane seasons. I suspect it will take a while for the egg to be wiped off their faces.
#117 Richard… Is it the egg in his face that makes
it hard for Franklin at NHC to distinguish “Juliette”
from “Juliet” (Elvis Costello-fan?? [“Juliet Letters”])
(Back from the cottage in island of Öland, where Telia
mobile internet worked for 22 minutes…thursday evening)
RE 117. Richard. You have never been inside the AGW spin machine.
I predict:
” this years hurricane season established without a doubt that climate change is upon us.In a year
that saw more named storms than expected, the NHC also recorded the first back to back category 5
Hurricanes. As Dr. Heidi Cullen, climate scientist explained ” in all of recorded history we have never
seen the hurricane season lead off with two category 5s. Michael Mann, acclaimed paleoclimatologist and hurricane
expert added: ” my reconstructions prove that this kind of an event is a one in a million event. The wind hasnt blown this hard
in millions of years.” Gavin Schmidt, not to be out done, quickly added ” we also saw Hurricanes form with lighting speed. Something
never seen before in nature. It bears all the signals of increased c02. These “Hurry-Canes” can happen in the
blink of an eye. In fact, the last one happened so fast the satillities missed it.
‘physics, astrophysics, earth sciences, atmospheric sciences’
And mammalogy. Flannery’s finest research involved discovering a hitherto unknown species of tree kangaroo in New Guinea. See his book ‘Throwim Way Leg’
Re: #115
To put it succinctly, science is training plumbers rather than engineers.
That (although I think you are insulting plumbers, maybe social workers?) and mixing too many “soft” sciences in with hard sciences. Combine this with the general dumbing down of science and you get AGW and a few other goodies.
Re: various complaints about “every little swirl”.
Adding into the stupidity by reaching back to 2005 where Dennis was retired from the list of hurricane names (I have questions about a couple of the others, but I was in Dennis and talked to others who rode it out). Here we have a little hurricane coming off the Gulf. No big deal, I’ve seen more than one in my life.
Ahh, I was going to get fancy with wind swaths and such, but real simply, it didn’t kill bunches of people (the “related” deaths for the storm looks pumped), it didn’t set some kind of record levels of damage (~$2.2B) and from eyewitnesses a bunch of the Dennis “damage” was leftover Ivan damaged/weakened items + the insane ~25 inches of rainfall in April. Pretty much, we got to apply three times for Ivan damage. (You do not want to get into the insurance fiasco down here.)
Firstly, keep up the good work. I wondered whether you had thought about running these data against (a) solar flux/sunspot data and (b) multidecadal ocean
oscillators?
RE: 121
Yes, it is rude and unfair about plumbers. I almost didn’t use the analogy because of that, but couldn’t think of another more well understood or impactful. If someone can think of a better analogy I will be happy to use it. But you get my point.
Re: soft sciences, I can’t agree. It is notable that the generation of climatologists who were trained in geography departments (most of them before the 1970s) thought much more carefully about how they framed hypotheses and paid much more care to the quality of the data than the current generation, and they have been prominent among the sceptics e.g. Reid Bryson. Just read Lamb’s Climate History and the Modern World or Bryson and Murray’s Climates of Hunger to get a sense of this. And it is people like Mann, who was trained in physics at an Ivy League school, who are failing to frame hypotheses carefully, are careless with the quality of the data (any number is as good as any other, it appears) and are making the errors in mathematics and statistics. Also recall that Steve at one point might have become an econometrician and Ross McKittrick is one.
The issue, it appears to me, is not the discipline but the rigour with which it is taught and in particular the rigour with which the scientific method is taught.
Ryan Maue has updated his tropical website through 30 September.
The to-date Northern Hemisphere ACE is 30% below climatological (defined as the last 35 or so years). To find similar low-ACE values one has to go back to 1977, 1973, 1983, 1975 and 1974. Most of those years were in an arguably different climatic regime. (Caveat: ACE depends on intensity measurements and those measurements are problematic.)
Re: #124
I think I have the data to do this for the NATL, but I was curious about a year with many named storms having a low ACE score. How often has that happened?
In the same context I was curious about the computer generated models only being capable of forecasting named storms and not their intensities (which for some reason impresses Judith Curry suffiently to have her predicting the dynamical models soon winning the forecasting battles) and what they will say (or their operators) about a year like this one in the NATL. I guess what I am asking is there a good correlation of ACE with numbers of named storms and further would this relation fall out of the computer models.
Ken the Atlantic ACE per storm time series is here . The 2007 value is currently about 5.0, so 2007 ranks in the bottom 10-20% of the last 60 years.
The thing that props up 2007 is Dean, with an ACE of 34, over half of the 2007 total. Without Dean, 2007 would be a record-low 2.4 . But, as the saying goes, if pigs had wings they could fly, so no exclusion of Dean in any review.
On your second question: the r correlation value between storm count and ACE per storm is a mere 0.034 (ouch).
My understanding is that the computer models do better with strong systems than with weak systems. Presumably the computers would struggle with a mostly-wimpy season like 2007.
RE: #174 – With one exception (a seriously strong El Nino Year) they are all during a negative phase PDO time frame.
David, very nice plot of ACE per storm. I am sure you have seen that the ACE per storm over the past 60 years in the North Atlantic has a very long tail towards more intense systems. So, to visualize this, I plotted up the cumulative distribution of PDI (cubic zirconia) per storm since 1944. I included the subtropical systems (b/c Mann does) but did not include extratropical phase points in the PDI calculation.
On my page, Maue Tropical , I included the frequency values of PDI (divided by 1e5 for convenience) for 1, 3, 5, 10, 25%, etc. going from weakest-to-strongest. So, 99% of storms have had a PDI > 1.72 since 1944. Bret and Jose from 2005 are examples of two *loser* storms. Erin 2007, if not reanalyzed stronger at the end of the season, also belongs in that exclusive company.
In contrast, Ivan at 859 has the most PDI on record, almost 4 times as much as Katrina 2005, and roughly 665 times the power dissipation as Erin 2007. It goes without saying that Ivan’s fingerprint on the atmosphere-ocean coupled climate system (not the other way around!) is ridiculously more important than a tropical storm or minor hurricane. Yet, in the parallel universe of storm counts, Ivan 2004 is 1 storm and Erin 2007 is 1 storm. Does anyone remember Erin? I don’t.
Re: 98
Anthony,
“The overall extent though of observations though for the last century seems to have increased.”
There may have been an increase in the number of observations, but where did they occur? In the shipping lanes, is the answer, which is a small proportion of the total ocean. Jones found this a problem, which he solved by using a formula to transfer data from sampled areas to non-sampled ones.
Speculatively, one may anticipate that because more and more of the world has been drawn into the global economy, and that the number of observations along each should have increased. But this is speculation. It needs to be demonstrated.
Shipping routes come and go. In the last quarter of the 19th century and up to the First World War, one of the most frequented routes was from Western Europe to Chile, around Cape Horn, to load guano and nitrates for use as agricultural fertilizer. The invention of artificial fertilizer killed that trade and that route. Sampling of the South Atlantic, the Southern Ocean and the South Pacific along that route would have fallen off a cliff.
With the development of copper mining after 1915, the anchovy fishery and the wine trade (much later in the 20th century), shipping to the West Coast of South America would have increased, but the ships would have been steam and then motor ships using the Panama Canal i.e. a totally different route sampling totally different parts of the oceans, except from the coastal waters of the northern and central littoral.
There was also a vigorous sailing ship trade carrying coal for the Chilean nitrate mines across the Southern Pacific from Newcastle, New South Wales in Australia. That may have survived the collapse of the nitrate trade as one can speculate that the power plants for the copper mines which started production about the time nitrate went into decline, would have required coal to fuel them. But that would have to be established.
You can see that it is a complicated story.
Re:128
Ryan
Very interesting. You note: “..a very long tail towards more intense systems”. What am I to understand here? Lower cummulative seasonal ACE values but higher individual ACE values per storm? I think I may be missing something. Look forward to your explanation.
RE: #130 – Dollars to donuts, some of the real ACE / PDI values of some of the older more memorable storms were higher than what we are led to believe today. Some of the older ones depicted as 400 – 600 range storms may well have been much higher. We don’t know that Ivan was truly the max – some of those monsters 1945 – 1980 might have been way up there, over 900. Again, the techniques for initial ID, tagging the time TS breakpoint was reached, and subsequent tracking of energy dissipation, were very primitive prior to the mid 1970s. And relatively speaking, the period 1975 – 1990 was really the infancy of remote sensing and other electronic aided methods as we know them today. Just like storm count, in the past, ACE and PDI were likely undercounted prior to the past 30 or so years.
RE129 Mike, its not just ships in shipping lanes, in the last century we’ve added satellites, airplanes, and weather balloons carrying radiosondes, to name a few. Satellite imagery alone could account for increasing the number of observed storms in the past 50 years.
Again the point is, IMO we are an order of magnitude better at gathering information than we were 100 years ago due to a number of observational advances. 100+ years ago there were likely many non-landfalling hurricanes that appeared, grew, and died without any notice because they were outside of shipping lanes and trade routes. Today, we don’t miss a single one.
So simple counts don’t always indicate a true trend when the counting wasn’t as good 100 or more years ago.
Re: #
Mike, that is why we have used other evidence in this discussion of the detection of named storms of which you may or may not be aware. Much of it has to do with such observations as portions of storms detection varying over time within a certain distance of land, varying detection frequencies trends in variouus sections of the NATL, landfalling events trends and trending differences of storm categories with ease of observation of the category over time. All of these other pieces of evidence point to improving detection capabilities over time adding to the named storm counts.
As you noted earlier the only concrete way of getting some measure of storm detection by ships historically would be to plot intersecting storm patterns and ship routes. That would be only part of the analysis problem as one still has to determine the effects of changing technology in storm measurements by ships over time and how much ships could and would avert storms in the past. Another problem with the intersecting storm patterns would be to determine if they have changed over time as might be expected to result with better detection capabilities. The question that comes from this problem is how well could one track storms in the past such that yearly storm tracks would be appropriately compared to ship routes during the year of interest.
I think we can conclude that, although the “dumb ship” theory has been used in the peer-reviewed literature to explain historical storm counts, it remains a dumb theory.
Re: #126
On your second question: the r correlation value between storm count and ACE per storm is a mere 0.034 (ouch).
David, what I was looking for was the correlation of the annual total ACE versus number of named storms and not the ACE per storm.
I still have a difficult time visualizing how a computer model would see individual storm formation. I am thinking that the best that they could do would be look at the storm seasons storm-forming variables for a given month and relate them to a number of storms for that month. I am just guessing but I would think that if the forecast for a given month was compatible with a low ACE they would forecast fewer storms. My point being that I doubt they could or would predict the results we are seeing this year. They could have wrongly forecast the variable that would lead to a season with a high ACE score and still gotten the number of storms correct. I would like to see an explanation of all this by the modellers at season’s end.
I think I can do the NATL correlation with my data.
Re: #134
David, I did the correlation calculation for the time period 1851-2004 (too lazy to update to current) for annual ACE versus annual name storm count in the NATL and obtained an R^2 = 0.54.
Regarding #135…you expect a strong correlation between ACE and storm frequency since ACE is the convolution of intensity, duration, and frequency. Ken, you should see that upon deconvolution, that correlation between storm count and intensity/or duration is not a constant throughout the last 150 years, but is affected dramatically by observation system changes. For perspective on the shipping/detection issue, HC Sumner published Monthly Weather Review summaries of North Atlantic hurricane seasons during the 1940s. Google will immediately find these for you. All should read the summaries for 1947 and especially the 1947 Fort Lauderdale category 5 landfalling storm that also impacted New Orleans.
Tetris, the distribution of ACE or PDI per storm is far from a typical normal distribution. Think of the precipitation distribution at a given station in a subtropical climate. The median PDI or ACE per season has gone down dramatically since the mid 1960s.
Re Ryan Maue 136 (October 2nd, 2007 at 8:08 pm)
Monthly Weather Review September 1947
Monthly Weather Review December 1947 — Includes description of the “Major hurricane of September 10-19”
Here is the ACE data broken into 52 year buckets by distance from any land.
The above chart has a higher average track ACE for 1851-1902 period partially due to the low end wind speeds rarely being recorded.
Similarly, here is the track data broken out by category with a wind speed qualifier added since no tracks less than 40 knots were recorded prior to 1871.
Last chart TS series contains only tracks of 35 knots. The slower tracks are in the TD category.
It can be seen in the above charts the biggest change in track count has been at the lower speeds and/or away from land. Many of these being included in the ACE value.
A recent paper on SST and tropical cyclones is summarized here .
I haven’t yet read the original paper.
In a nutshell it says that relative tropical SST (one region versus another) probably plays a more important role than absolute SST. It looks at the Atlantic and finds that hurricane activity is up when the Atlantic is anomalously warmer than the rest of the tropics. Conversely, when the Atlantic is relatively cooler than the rest of the tropics then activity is suppressed.
The top graph shows a switch to lower relative temps around 1970 and then a switch to higher relative temps in the 1990s.
That matches the AMO pattern and I think it also matches the high-latitude Atlantic SST pattern (which is thermohaline-related).
Good reading.
Bob I look forward to your plots. Looks like the links didn’t quite work.
Kenneth I agree that the computer models would struggle with a year like 2007, to the best of my understanding of how their forecast works. Even the short-term models struggle with small, weak systems, often “losing” them due to their small, almost mesoscale nature.
Dave,


Hmmm. I assume you’re referring to my post #138. I put the charts at imageshack. Maybe they went down for a short period. I can see them in my browser.
Here are the direct links if there is still a problem.
Re #142 that’s odd – I can’t see even an “x” on my screen in your earlier posts.
Don’t know what to tell you, Dave. I use the Opera browser and they show up fine. My IE7 shows them also. Browser problem?
Re: 138 -144
They show up fine here.
Re:140
I noted that one with interest as well. Both the argument about the importance of regional tropical SST and the matching of the AMO pattern are interesting.
Re #144 Probably, but weird nevertheless. I’ll try a different computer later.
Bob Koss’ images show on my computer, also – bright, vivid and indicating that dumb ships theory is dumb.
More than likely the images aren’t showing up because they are on Imageshack. That website is being filtered from where you are browsing. I can’t see the images either and won’t be able to visit the direct links provided until I can browse from a different location that isn’t filtering that content.
Damek,
Good point. I’ve never been on a filtered network so I never considered that possibility. Do you know if that image filtering applies to all hosting websites? Or is it targeted only at specific ones?
#s 132 and 133
Anthony,
You are correct about radiosonde and satellite data improving the modern data. I guess I interpreted “eyes on the sea” literally and the context was ship observations.
Ken,
I understand that there are other ways of inferring what was going on. I was just passing on what I know about ship movements. I also now realize I slid off topic into discussion of the general issue of SSTs from ship observation.
Regarding early ships avoiding hurricane tracks, they could do this as early as 1850 when Maury published his first guide. He provided maps of voyages and printed hurricane tracks on them in red.
So beginning in 1850 ships could stop being dumb if they chose.
Another complicating factor is that the steel sailing ships of 1880 to 1920 were extremely strong. They could proceed under full sail in gale conditions which would have compelled most earlier wooden ships to hove to. They were designed specifically to use powerful winds such as the Westerlies of the Southern Ocean. They sought powerful winds out rather than avoided them.
Mike
National Geographic Channel will air a program on “Hyper Hurricanes” October 18 ( link ).
One of the side streets I’ve been exploring is tropical Atlantic sea surface temperature (SST). I’ve been wondering about the accuracy of the SST reconstructions in regions which were poorly sampled in earlier decades, like the Main Development Region (MDR) of hurricanes.
One approach I tried was to compare the reported SST of the poorly-sampled MDR with that of the adjacent, relatively well-sampled Caribbean. The two time series (shown as anomalies) are here . Nothing spectacular there – they appear to track well and the raw data shows an r of 0.83 over the entire 107 years.
Where I get puzzled is at a plot of the difference between the two SST (expressed as anomalies from their respective base periods). The plot is here . (These are the differences between smoothed values, for ease of visualization.) What I expected to see was a lack of trend. What I actually see is an odd pattern of ups and downs which seems to have come to an end in the early 80s, which happens to mark the start of satellite measurement of SST. (I also see an oddity around World War 2, which I marked with question marks, as I have doubts about the extent of temperature sampling then.)
I have no answers or hunches in this and will simply keep playing with the data.
It’s odd that the trending apparently ends when measurement techniques improve – that makes me wonder about the reliability of the earlier portions of the reconstruction.
At the same time, however, the cyclic-looking multidecadal-scale variability surprises me. Maybe it is real and reflects some aspect of the AMO. Maybe it indicates some part of the chain of events in Atlantic ocean circulation, marking change in the flow though the Caribbean via changes in the Atlantic circulatory gyre. The bottom of the 1960s trough roughly corresponds to the end of the active-phase of the AMO hurricane cycle – does that mean anything? I don’t know. It’s intriguing.
Was just scanning this thread before turning in & tripped over a few refs to Dr. Tim Flannery. No surprises, but some late-night comic relief, so now I can skip Leno. I’m aquainted with a few un-citified Aussies, and mates, I cringe with you and feel your pain over the antics of your politicos who voted him Australian of the Year.
Be it remembered that Flannery is the antipodal Polar Bear expert who recently predicted the imminent demise of that species. Canadian researchers with their feet on the ground and their heads firmly opposite, were perplexed. This has been linked at CA before, but since it’s all about fun whenever Flannery’s name comes up, here it is again.
http://meteo.lcd.lu/globalwarming/Taylor/last_stand_of_our_wild_polar_bears.html
Suenos Bonitos, everyone
Flannery predicted my home town, Perth would become the world’s first ‘ghost metropolis’ as global warming dried up our rainfall. In fact, this winter has been the wettest in years. One year doesn’t make a trend, but it’s consistent with a shift in the PDO to a cooler wetter phase.
Several press releases I read said that Flannery “reviewed the IPCC reports” and determined that GHG levels (minus water vapor, I assume) were 455 ppm in mid-2005 as opposed to about 280 ppm. To him, this meant we’re a decade past where we thought we were with GHG emissions. To common sense, it means that either climate sensitivity to GHGs is far less than previously envisioned or negative feedbacks are overwhelmingly greater than previously thought, that all the models are crap, that much of AGW theory goes out the window, etc.
Flannery seemingly wants to use the “tipping point” idea based on a climate sensitivity to GHGs based on 1750-2005 of about 100 ppm, then apply that sensitivitiy to a revised 2005 level of 455 ppm. He can’t have it both ways.
Even Gavin tells Flannery not to exaggerate over at RC (in reply to tosh)
Unfortunately then Flannery wouldn’t have much to say.
It woe-betides the AGW cause that Australia’s best known “climate” scientist is actually an Australian mammologist and palaeontologist. He holds bachelor degrees in English and Earth Science, and a doctorate in Palaeontology.
Physics? No.
Mathematics? Nup.
A dash of statistics, or meteorology perhaps? Afraid not.
http://en.wikipedia.org/wiki/Tim_Flannery
RE#156, sorry – numbers all over the board.
1750 (IPCC), GHG ~280 ppm
2005 GHG ~380 ppm (almost all CO2 at about 378 ppm…methane under 2 ppm, others in trace amounts)
1750-2005, delta GHG ~100 ppm
Now Flannery says 2005 GHG ~455 ppm
1750-2005 delta GHG ~255 ppm
Re: 157
Christl
Problem is that this sort of OT stuff gets the medias’ attention/coverage.
Re: 153
David.
Interesting. I can’t seem to get the links to your site work. What gives?
159, he’s trying to add the effect of other GHGs in as if they were CO2 equivalent. Cute trick, but mathematically spurious.
Re #161 I’m not sure – the links work for me.
I may try posting some graphs on CA, if I can figure out how to do that.
Folks,
do you think that the swirl located between Madeira and the Canary Islands will be referenced in the next NHC outlook?
SST there is around 23 °C.
Re: #164 – Out here in the land of Joaquin Murieta, we’d call that a garden variety October cut off low. (Of course, this year, we here on the coast of shoot ’em up cowboy country got our October in August, so our cut offs have long gone and we are now getting mid winter Gulf of Alaska systems ….)
re 165:
X-MAS forecast dude. Will I need chains driving to chester for Xmas..
shakes his magic sadlov ball
RE: #166 – You will probably need chains next week (or, you could get a 4X …. ) 😉
Re: 161
David
Just tried again: work fine now. Thx.
Re: 166 and 167
SteveM and SteveS
More 4x4s, more AGW, more swirls, isn’t that how it goes? I forget how the snow gets into the equation…
Ryan Maue has updated his Northen Hemisphere ACE plots ( link ) . The Northern Hemisphere continues to run 25-30% behind climatological normals.
The Eastern Pacific has probably shut down for the season. The Atlantic may see one or two more storms but wind shear is up and the chances of a major hurricane are quite low. The Western Pacific season still has an active month or two left.
It is a pretty good bet, barring a hemisphere-wide rash of tropical cyclogenesis, that the period from June 1 – November 30, 2007 in the Northern Hemisphere will be the quietest TC season (in terms of ACE) since 1977 (also June-Nov). The Eastern Pacific is particularly TC depressed. The winter of 1977-1978 was a cruel, cold, and snowy period for much of the midwest with endless Clipper systems dragging Arctic air across the Great Lakes. Coincidentally, the record lows in Florida occurred during 1977 for the upcoming week. Thus, I think the relevant question is how does TC activity or lack-thereof during the summer/fall affect the next few months of the fall/winter season?
2007 TC yearly update
I remember the winter of 77-8. I’m pretty sure that was the winter when we had a record blizzard in the midwest US. The road in front of our farmhouse, which was a US/OH highway was shut down totally for several days and anyone with a snowmobile was called into action bringing food and supplies to people who were isolated and often without electricity either. That may be the same winter when we had some horrible ice storms as well, though I could be combining years in my head. Anyway, I tried getting to work one morning and there was a well banked curve not far from where we lived where traffic was snarled and I found myself sliding sideway (while stopped) down the bank toward the other side of the road. That’s when I turned around and went home.
Re 170 and 169
Ryan, David
Any thoughts on why these below par numbers and the similarities with 1977-78?
#171,
I lived in a small suburb of Dayton OH in 77, right next to open farmlands. Our street was closed for 10 days, with 8 – 10′ drifts. Same in the back yard. And it was darn tootin cold that winter as well. It was either 77 or 78 that I delivered newspapers in 21 below zero.
#170,
Maybe none, I don’t know from a scientific point of view (but neither do the modellers really). From a layman pov, since TC’s are basically heat transfer engines, a quiet season would fail to transport much warmth from the tropics to the N latitudes, where it would warm the air and ocean temperatures (probably slightly), but perhaps enough to change the jet stream position and the air temperature during the winter season.
Now, this does bring to mind a question. One of the issues with the sea-ice extent this year was an anomolous high pressure over the Arctic which led to warmer temperatures and clearer skies. That has helped reduce the sea-ice levels this year. I wonder then if the fact that it was warmer at the northern latitudes was a factor in TC cyclogenesis this year. If it’s already warmer than usual there, would the earth sort of balance that out by not transporting as much heat from the tropics via TC’s. Apart from the usual sahel dust over the Atlantic during the early part of summer, SST’s have been slightly warmer than 2006 (.5C) and wind shear fairly normal. With an onset of La Nina, you would have expected a more active season, but instead it was a total dud. Take away the non tropical named storms and it’s been a real dud.
Re 172
tetris
The experts are puzzled too.
Link
RE: #174 – That same high wind sheer, in the face of La Nina, is but one indicator that everything we think we “know” about ENSO is probably wrong. The truth is, we know quite about about ENSO during a positive PDO phase, but we know little about ENSO overall. We know even less about higher order oscillations affecting multiple ocean basins / interactions between oscillations in various basins / constructive and desctructive interference and modulation as a result of interaction of harmonics.
Re: #153
David, without the details at my finger tips, I remember an SST data set that you used and another that Webster and Holland used in their attempts to correlate SST to tropical storm occurrence. As I recall when I used both to look at the correlations, the correlations decreased with the data set not used by WH. There were other factors that also decreased their reported correlations, i.e. using the months of greatest historical storm occurrence and individual years in place of moving averages, but there were significant differences between data sets.
I did not research the details of the differences (the one WH used went back further in time as I recall) between SST data sets but would not the differences in data sets be telling of how well SST can be determined. Perhaps one data set is an adjusted version of the other, but that was not my general veiw of it.
#174
From that article
Sure, given the 3 bogus storms that have been named, you’re above normal.
Oh, and recategorizing Karen as a hurricane shows just how bad things are. If Karen was a hurricane, it was for a very brief period of time, and that’s just speculation on their part. It wasn’t a hurricane when they flew into it so that means they can only reclassify based on what some satellite observations might show. Very weak, IMO.
There are two fall Plots in the AGW escatology. Melting ice and blowing wind.
Re: 174
PhilipM
Thx. I have to agree with JonathanS in #177 as far as the padding of the storm number count is concerned. The Colorado group’s forecast of 20 storm days in Sept vs. 3.5 actual doesn’t do much to remove the ” ” around the word “experts”. (:)
Re #176 Kenneth I’ve been looking at various SST estimations for the MDR. A comparison of Smith-Reynolds (the one used by Holland Webster) and Kaplan is here . They’ve moved in concert since about 1975 but before that they had been diverging.
A plot of Smith-Reynolds versus NCEP reanalysis is here . These diverged from 1960-1975 and again after 1995.
I wonder why SST histories vary so much in the modern era (post WW2) and, in view of that, how much confidence can one have in reconstructions of pre-WW2 periods, when sampling was quite sparse in most tropical regions, including the Atlantic MDR?
Re #172 tetris those are good questions but all I can offer is poor conjecture.
I’ve been impressed this year by the apparent weakness in the ITCZ. There were times earlier in 2007 when it was hard to spot the ITCZ in the Pacific and it was almost non-existent elsewhere. Since the ITCZ is the source of most seedlings, perhaps a weak ITCZ leads to weak seedlings and weak seedlings lead to weak storms.
The global tropical atmosphere also seemed more stable than normal this year, with less precipitation. Why? I haven’t a clue.
My sense for about a year has been that we’re in the midst of a noticeable shift in global climate, probably in a slightly cooler direction. That doesn’t mean that AGW doesn’t exist, instead it means that the warming of the last 35 years may have been a combination of AGW and natural, and perhaps the natural factors are shifting in a cooler direction. The cool-phase PDO, La Nina, an AMO which may have peaked and a solar minimum may be having an impact.
David: I know that since Stan Goldenberg’s paper in 2001, the MDR SST has been used many times in TC intensity/frequency/anything correlation studies. It is true that the African Easterly Waves travel through that patch of water, but they do not always develop there. In fact, the actual storm activity with respect to the rest of the basin is very minor. The vertical wind shear in that location would seem to be more important than the SST, which is usually warm enough for tropical development at all times. In fact, in a manuscript I am whipping up, the MDR SST is a *lucky* choice for correlation with TC activity metrics. This means that if you use the Eastern Atlantic or North of 18N or the Caribbean or the Gulf of Mexico or the Bermuda Triangle or the Great Lakes SST, you do not get robust correlations between TC PDI/frequency and SST for the last 120 years. So, this goes back to step zero — is the MDR driving the entire Atlantic basin? I would argue no. I am leaning towards the argument that the MDR SST is a response and not a cause, and buy the Atlantic Meridional Mode explanations of Vimont and Kossin.
The most recent batch of papers from Holland and Webster 2007 and Mann et al. 2007 and the ship track papers of Chang and Guo (2007) and Knutson and Vecchi (2008) seem to build upon a house of cards: the premise that the MDR SST is infallible and we have detected enough storms since 1900 to attribute the TC changes to these MDR SST fluctuations and AGW. We can barely *describe* the natural variations in climate that are causing the 2007 Northern Hemisphere TC season depression. It seems the *peer-reviewed* literature is more confident about the 1907 climate.
Following my previous post #164
NHC, a bit late but finally, mentioned the swirl near the Canary Islands:
The swirl looked better two days ago, in my opinion.
Maybe tomorrow they will also take into account the low in the Western Mediterranean sea.
Re #182 Ryan thank you for your well-stated post. I’ll have a few thoughts later (after errands) but for the moment I’d like to share an older paper paper that, to me, is relevant and quite interesting:
Knaff 1997
Hey!, Very nice place you have here. Youve done a good job & awesome blog on !
Re #182
Here are some r values for 1950-2006. “TC” stands for named tropical cyclones.
TC and the SST of the MDR = 0.50
TC and the SST near Spain = 0.46
TC and the SST of the Caribbean = 0.40
TC and the sea-level pressure near Cuba = -0.50
None are impressive but it looks like the SST of the MDR and sea-level pressure near Cuba are the leaders for correlation. For further comparison between those two, what about using ACE?
ACE and SST of the MDR = 0.50
ACE and sea-level pressure (SLP) near Cuba = 0.63
Looks to me like one should explore what drives changes in sea-level pressure in the western Atlantic rather than simply MDR SST, which is what Knaff and others have done.
My belief is that there is a relationship, but a weak one, between the SST in the MDR and tropical cyclones. This is due to warmer MDR aiding the early transition of easterly waves into cyclones and to a longer season thanks to the warmer water. There’s a relationship, but it’s not the main player in the story.
Somewhat related to this is an interesting plot ( link ). The changes in SLP, ACE and SST (of several regions) are displayed. What intrigues me are the oscillations. I haven’t the foggiest idea of their cause. Exploring and explaining those would make a good paper, I think.
Re #186
David could you give some more details on your calculations of r. You did caclulate r and not R^2? If that is the case R^2 or the portion of TCs explained by SST goes down to 15% to 25%. I also assume you did a year by year correlation and did not use a moving average. What months did you use for the SSTs?
Obviously we also have the case where SST was increasing with the detection capabilites of TCs. I always like to look at named storms, hurricanes, major hurricanes and landfalling events and report all of them together so one can see differences in correlations with the ease of detecting a given category.
It is a difficult proposition to ascribe causation to correlations without some sort of dynamical reasoning. The approach of Emanuel 2005 is mainly a thermodynamic one through the theory of potential intensity, which is related to SST. Yet, there is certainly more to the potential intensity calculation than SST (i.e. you need a sounding). Jim Kossin and Dan Vimont at U Wisconsin have expounded upon the Atlantic Meridional Mode or AMM, which is an elegant dynamical mode of the tropical Atlantic. A BAMS article is forthcoming next month and is available here: BAMS AMM . After some smoothing, the low frequency variability of TC ACE explained by the AMM is very high, R~0.90. I favor this approach rather than the less convincing arguments utilizing only MDR SST.
Re #187 No problem, Kenneth. The values shown are r, not r-squared, and as you note the “portion explained” drops greatly. The data are correlated by year, with no smoothing. The months used are August, September and October.
The data source is NCEP reanalysis. I’ll rerun the SST portion using Smith-Reynolds and Kaplan and we’ll see if that makes a difference.
TC and the SST of the MDR (using Smith-Reynolds) r=0.58
TC and the SST of the MDR (using Kaplan) r=0.45
TC and the SST of the MDR (using NCEP, in #186) r=0.50
A few other r values:
ACE and the SST of the MDR (using Smith-Renyolds) r=0.45
ACE and the SST of the MDR (using NCEP, in #186) r=0.50
A final r, using the adjustment to TC count proposed by Landsea, which increases the count in earlier years:
TC (Landsea) and the SST of the MDR (using Smith-Reynolds) r=0.48
which, as expected, is a drop.
Interestingly, the recent Mann Emanuel et al (2007) paper on hurricanes used “decadally smoothed” SST and “decadally-smoothed” TC count to calculate r, rather than individual years. They found healthy correlations (r=0.76 for 1870-2006).
Massive smoothing and higher r values – what are the odds of that ? 🙂
re #190
unity
#192 – the return of bender. Hurray – hope you can visit for a while.
Here is my record of the tropical cyclone forecasts. Please let me know if I have missed or misstated anything. I’ve attempted to take the average of ranges.
John A.: 7
John G. Bell: 8
Paul Linsay: 9
Steve Sadlov: 9
uc: 10
John Norris: 10
John Baltutis: 11
UK Met: 11
Bob Koss: 12
jae: 12
IWIC: 13
Accuweather: 14
Jonathan Schafer: 14
IW (private forecast firm): 14
Staffan Lindstroem: 14
DeWitt Payne: 15
US National Hurricane Center: 15
Michael Mann: 15
TSR: 16
Gray/Klotzbach: 17
David Smith: 17
Bill F: 18
Ken Fritsch: ((GK+MF)/2) (if UKM = MF then Ken’s forecast is 14)
Meteo France: secret superieur
The raw count of tropical cyclones to-date is 12. Climatology suggests we’ll see another one or two storms which would put a slew of people into the wizard category.
The to-date ACE is 62. In a normal year that would equate to about 6 tropical cyclones, which would put John A in the drivers seat. However, this is the Year Of Naming Everything so the storm count is inflated.
Interestingly, the “ensemble forecast” (=the median) is for 13 storms, which is looking pretty good.
Throw out 3 overtly bogus named storms. Then what do we get? (The question is more statistically than egotistically oriented …..)
Of relevance to #191, I have a question re “smoothing” the hurricane data set to reveal visually the decadal scale variability and filter out high frequency El Nino activity. The running mean strategy does not seem to be good; while it does smooth, it aliases the phase of the variability. I have started using a 9 year hamming filter. If anyone has comments or suggestions, i would appreciate a discussion on this topic (or a one word comment from bender 🙂
RE 195. the jawboning begins. I entered late in the game with 13.5 storms.. So adjustments
of bogus storms will have to be partial credit type arrangements.
RE 196. Bender’s one worders work wonders.
Welcome back!
In our CA contest it is possible to earn a Bonus Storm (or take away one storm). To earn a bonus storm a person must identify the purpose of this invention by my 11 year old .
This was his submission this week for a class project in which students had to conceive of an “original mechanical device”. That’s not an easy assignment.
And no, it’s not a divining rod for use by seasonal hurricane forecasters.
Any guesses?
Judy, RE 196
Why did you choose a 9-year Hamming filter — when there are presumably other spectral peaks?
One more thing: how do think the use of the 9-year running mean (and the issues with aliasing) affects the definition of the respective TC regimes in Holland and Webster 2007?
RE 199. I have seen Too many Cronenberg films to guess
Re #201 🙂
Here’s a clue .
While looking for a photo of Lyle the Gekko I came across one hurricane-related photo of my nephew evacuating from New Orleans ( link ). This was taken by a National Geographic photographer as my nephew made it to shore after swimming from a flooded house. The family (including cats) had spent three days in the upper reaches of their house before getting out. The cats were remarkably cooperative.
Re: #202
My guess is that that well-finished mechanism is used to extract Lyle from his bed/dwelling when he wants to sleep-in instead of joining his mates selling insurance. The knob on the end of the extraction device serves a double purpose as a handle and is used to give Lyle a very gentle rap on the noggin when he is slow in preparing for his selling gig.
By the way, if I win I want the option of holding out my bonus storm if I am over or dead on the correct number. I am thinking that I don’t need no stinkin bonuses.
RE 202. Its either a cat retractor or a gecko grabber
Very creative guesses 🙂
It’s actually a “double-barreled gekko feeder”, for those days when you want to go out to play but chores like feeding slow you down. Grab two meal worms at once with your double-barreled feeder and be done with it and go play baseball.
Anyway, back on topic, there have been no October storms so far. If that continues then that fact would add to the odd aspects of 2007, especially for a La Nina year. I think that in modern times the chances of a season without an October storm runs about 10%
OK, no one jumped to the conclusion I had wanted to incite, so I’ll be the bull in the china shop. With three named storms removed (which would be an easy argument to make) we come in at 12 – 3 = 9. This surprisingly turns out to be what I guessed. Why did I guess it? Because I bet that we’d come in at the long term mean. Why did I bet that? Because I could see very early on that the forecasted La Nina would be confounded by the emerging negative PDO and the dying AMO.
Now, for the finale …. I utterly reject the claim that any metric regarding tropical cyclones has risen significantly on any time frame – not over the past 20 years, not over the past century and not over the past millenneum. There are wiggles on the long term mean, but there is no trend. Now, let the games begin … Judith? Any comments?
They’re saying stone crab fishing off of FL is going to be a doozy this year – creditting two quiet years of hurricane activity.
My fave of the year was Tropical Storm Karen. It’s remnants became Tropical Depression #15, and if it had reformed to tropical storm levels (which it did not), it would’ve been given another name. That seems like it would’ve been double-counting to me.
I’m only a part-time observer in this area. But I have noticed that the NHC modifies its ‘forecast’ throughout the season. Can I use the NHC methodology and put in my predictions now?
Re: David Smith #205:
Why do you call this year a “La Nina” year? The sites I watch show neutral conditions.
noaa
australians
I would think you need a real La Nina to spin the hurricanes up, warm SST to fuel them, and no ITCZ return flow at high altitude to shear them. No La Nina and high wind shear means few hurricanes, no?
Re #209 pochas, it was slow to start but we’re officially into La Nina:
Australia BOM
NOAA
Perhaps I should have said “non El Nino”, because it’s usually the wind shear from El Nino that kills off a season
This is not your father’s ENSO. Everything changes when PDO flips.
HEY BENDER you owe DR Curry an answer
Not sure if any of you guys are in contact with Bender but Dr. Curry asked a interesting
question. Is everyone gunna punt?
#196.
You shouldn’t use any smoothing, all it does is throw away information. There’s lots of information in the fluctuations. Yes you can improve correlations, but that’s just because constants are 100% correlated and you’ve thrown away the rest of the data. Smoothing functions also have the problem that unless carefully designed they don’t simply remove, say, high frequencies, but retain a range of frequencies in a sinusiodal pattern that can go out to very high frequencies. That is, you think you’re getting rid of high frequencies but in reality you’re not.
With respect to the TC counts, they are a perfect example of a Poisson processes, fluctuations and all. I’d seriously doubt that you can prove that El Nino or any other phenomenon is a cause of the fluctuations. There are no cycles there, just a random walk. Random processes do crazy things and your intuition about how they behave is just wrong.
I see lots of smoothing going on in climate science but have never seen any kind of justification. Unless you can give a genuine reason, like looking for an 11 year solar cycle, then don’t do it. And if you are looking for cycles, there are better ways than smoothing. Do a Fourier transform and look at the spectral components. Unless one sticks up way above the others, you haven’t got a case. The amplitudes are usually Gaussian distributed, which gives you a statistical test for significance.
RE: #213 – Yep!
Here’s a mildly interesting sea surface temperature plot. It’s of the Atlantic north of the UK during the warmer half of the year (July-Dec).
The far north Atlantic began a distinctive warming when the AMO moved into its active-hurricane phase. Stronger thermohaline moving warm water northward? Changes in wind/sunshine patterns related to the AMO?
2007 isn’t shown but so far the year is much cooler than 2006.
Paul Linsay (#213),
I agree that smoothing can be very dangerous, especially near the end points of a series. But a Fourier series can also be questionable if the data are not periodic or have a limited number of derivatives that are periodic. And a Fourier integral transform assumes that the data is continuous and is integrable over the entire space.
Jerry
#216,
Agreed, there are pitfalls to every mathematical technique when used without understanding.
Re: #213
I agree that the TC counts fit a Poisson distribution with statistically good fits when the cyclical and trend parts of the distribution are removed. I think one can make a case for a cyclical component in the data and certainly for a trend. Mann agrees with this argument but attributes the trend to SST (using the dumb ship’s theory) whereas I would attribute the trend more to changing capabilities for detecting TCs.
I would agree, as does Mann, that if one assumes a Poisson distribution the statistics for handling correlations and trends differs from that assuming a normal distribution.
Smoothing used to visualize a fit is I think appropriate in the right cases, but it should not be used for calculating correlation coefficients without statistically accounting for the smoothing and having a rationale for doing a particular smooth. When one smooths TC data versus SST one is admitting up front that other factors — other than SST — are important in the modeling of TC frequencies. It is obvious to me that any SST effects on TC frequencies have to operate in the year of the TC occurrences. Most other effects operate in the year of occurrence also, but if not exactly measured and accounted for these effects when operating cyclically can be zeroed out to some extent using a smooth.
RE” #218 – Indeed, one must remove the past lack of detection and and recent bogus count inflation trends. Then, Poisson behavior will emerge.
#218,
Nope, no trends or cycles needed. I’ll be in Chicago sometime in the next six months. We’ll duke it out over a beer.
Ryan Maue has updated his ACE website . Northern Hemisphere storm activity continues to be weak.
From the website are the observations that, if there are no more NH storms in October, then at the end of the month
* 2007 will be the second-lowest ACE on record (since 1970) in the Eastern Pacific
* It will be the fifth-lowest on record in the Western Pacific
* It will be the second-lowest on record for the Northern Hemisphere
* 2007 will be the lowest since 1997 in the Atlantic and in the bottom third of recent decades
There will likely be some global activity in the last two weeks of October but the picture of an exceptionally weak 2007 should stand.
So, what is it? The kid invention thingy?
Kip
223.
its a gecko speculum
Re: #220
If it comes to that we’ll duke it out, but when you are in town, I would prefer to exchange notes over a martini — or two.
David Smith, I wanted to emphasize that I thought that mechanism your son made looked very well finished. This coming from a son who always thought his genius brother could be effectively competed against with my ability to make practical things. What I made only a mother could compliment, but I always knew quality when I saw it.
Re #225 Kenneth here’s the final photo on the gizmo, showing the time-saving double-tweezer in action picking up two meal worms at once. Definitely something to originate only from the imagination of a kid.
Here’s an interesting animation from Ryan Maue’s website. It show the forecasted motion of water vapor (basically the water vapor content in a column of the atmosphere) over the next week. Red and other warm colors are high-humidity air while the cool colors are low humidity.
Note how a tropical cyclone spins up south of Mexico, how the Pacific ITCZ weakens and how regions of high water vapor get stretched and dissipated as they enter the mid latitudes. The concentration of water vapor in the tropics is quite apparent.
We weather-heads are impressed by the fluidity show in the animation.
227. Very cool. I think I would go crazy looking at that stuff.
#226
The device looks like it could have been fabricated from an old hockey stick.
Here is a chart of Accumulated Cyclone Energy divided by longitude. East of -60w shows a large trend and a close look shows a step change in the east circa 1950 when plane observations were being taken. Another step can be seen in the east circa 1980 when satellite observations started. The western part of the basin shows little trend over the last 100+ years. Make me wonder where the temperature effect is.
When comparing the 2005 record value for ACE to earlier years one might consider making about a 40 point adjustment due to increased observational ability. 2005 got 56 points of it’s total 248 ACE from 186 tracks in the eastern portion of the basin. While 1933 got 12 points of it’s total 213 ACE from there based on 42 tracks.
Very nice plot, Bob. The step-change in the eastern Atlantic with the start of aircraft recon is quite apparent.
The Smith-Reynolds SST reconstruction for the east Atlantic and the west Atlantic (Caribbean) is here . Note the reported sharp rise in eastern Atlantic SST from 1920-1940 is not reflected in increased east Atlantic ACE. Not much of a change in the western Atlantic either.
Bob if you’ll send the numerical ACE values by year to me (mndsmith33 AT earthlink.net) then I’ll plot them versus SST and also see what r-squared values we get.
Files are sent, Dave.
Ryan Maue’s website ( link ) has a lot of good data on historical tropical cyclone ACE. (“ACE” is a measure of hurricane activity. It incorporates storm number, duration and intensity. The higher the ACE, the more active the season. ACE is a better single indicator of seasonal activity than storm number.)
In this plot I use Ryan’s ACE values for the Northern Hemisphere (NH) and the tropical sea surface temperature for the NH (equator to 25N, around the globe).
One hypothesis is that higher SST will lead to more hurricane activity. The plot doesn’t support that, with an r-squared value of only 0.14 . Whatever NH relationship between SST and hurricanes exists appears to be weak.
Measurement of global storm intensities improved around 1980, thanks to satellite improvements and the use of a method known as the Dvorak technique. For the period 1980-2006, the r-squared value drops to 0.05
David, for illustrative purposes, perhaps you could apply the filters or smoothing routines used by many authors in the TC Trend business. For instance, a plot of R vs. filter choice (3,5,7,9,or 11 years,etc) for the North Atlantic SST & ACE or Frequency should show what value one should use to maximize your correlations. I suspect it is around 9 years.
Re #234 Hmmm, will do. Interesting idea.
Here’s a plot of smoothing vs “significance”, per #234:
and here’s the link in case my attempt at posting the image plops.
David #236
Neat – the 22 year solar magnetic cycle looks like a clear winner in the AGW SST/Hurricane Papers smoothing sweepstakes!
David Smith ( (#236),
Quite amusing. Thanks for the plot and thanks to Ryan Maue (#234) for the idea.
Jerry
Re #232 The r-squared for the western Atlantic ACE vs SST for the 106 years is a rather poor 0.03 . I plotted it and will post it if anyone so desires.
The eastern Atlantic is more interesting and controversial so I’ll post it here ( link ). (It’s a noisy chart, sorry.) The r-squared for the 106 year period is 0.27 though I noticed that, if I remove the final six years, the value drops noticeably to 0.18. I’m unsure why the sensitivity is that great.
For the first 50 years the r-squared is 0.02 (ouch). I think that adds to the reasons to be suspicious of the early storm data, the early SST or both.
On the plot the SST rises strongly from 1920 to 1940 yet the ACE doesn’t budge. Them as SST reportedly declines in the late 1940s, ACE rises strongly. What’s up with that? (As Bob noted, that corresponds to the start of recon flights into portions of the eastern Atlantic. It also corresponds with the formation of a 24-hour US Weather Bureau team focused on hurricanes, which likely improved analysis and attention.)
Then come about 50 years of trendless ACE while SST is trendless or perhaps slightly rises.
Then in the 1990s ACE rises sharply, followed maybe 5 years later by a sharp rise in SST. The hypothesis suggests that SST should parallel or lead the ACE rise, not lag it. That also plays into the question of whether SST drives hurricane activity during an AMO shift or is mostly an indicator of a shift.
Bob thanks for the ACE data.
Dave,
I’ve been thinking about the SST correlation with ACE and I believe using yearly data is too coarse to show much. Probably have to define where the storms actually are find the SST for that month and location. I downloaded some monthly SST grid boxes 10×10 in size. If I get a chance over the next couple weeks I’ll play around with the relationship.
I charted four 10×10 grid boxes between 40N and the equator and -50W to -40W. The legend indicates the northwest corner of each box. It looks to me like a heat transport problem occurred during 2001(marked it with x), and has been slowly working itself out over the past several years. Rather an erratic shape to the sine wave of the southern most box since then. I have monthly data for those particular boxes back to 1900 and didn’t see a similar occasion when those boxes reached the same peak temperature. I know the NAO went quite negative that year, but that can’t be more than part of cause since it also went quite negative in 1996. Must be some other relationship involved. Anyway, something to cogitate on. 🙂
Re #240 Bob, one possibility for variation in the 0-10N cell is the influence of currents near South America. I think there can be considerable year-to-year changes in that area. A very nice source of info on Atlantic currents is here . It’s a reader-friendly website.
I used August thru October SST anomalies in the plot.
A Plethora of Powerpoints can be found here . These are from a Hurricane and Climate Change gathering last May in Crete (they never convene in Cleveland or Fresno). Should make for good browsing over the next week or so.
Re #212
Owe?
Re #196
Dr. Curry,
Try searching CA for John Creighton’s MATLAB code for orthogonal filtering. I believe that approach may give you what you want. Last winter we discussed translating that code to R:
http://www.climateaudit.org/?p=1022#comment-77455
bender I dread the thought of a December 1 rematch. Have mercy.
I’m sensing that the next big topic may be Mediterranean storms. Jeff Masters has mentioned this twice in a week, including a note this morning about a possible “subtropical storm” in the Med later this week.
I took a look at the forecast charts for that region and see cold air (4-8C) at the 850mb level, versus 20+C that is normally associated with tropical activity. I see SST listed as + or – 0.5C from climatological (pretty average), with Aug-Sep western Med values at only the 17’th warmest in the last 55 years. I see what looks like a cold front draped from the middle of the cyclone. The upper patterns are non-tropical.
It looks to be like an isolated low pressure area, which I’d think is not uncommon for the area. It’ll have some rain and some wind, pretty normal.
When I see these topics mentioned my sense is that someone is trying to create another storyline involving AGW.
David, that ship has sailed many times already concerning Medicanes. Most recently, an AGU paper came out in July 2007 that highlighted the perceived threat during the next 100 years or so as the SST warmed 3-4 C in the Med. Combined with potential sea-level rises, the authors expected doom to the coastlines in the future due to intense hurricanes.
Yes! Subtropical storms are not rare in the Mediterranean, b/c, surprise! the Med is in the subtropics. Prior to the climate change angle, Kerry Emanuel published an enlightening paper on the ability of some storms to develop via typical tropical processes. The *rare* Hurricane Catarina in the South Atlantic is another example.
As media and political interest in weather and climate increases, the weirdness and hysteria factors will increase as well. Science continues to suffer…
RE: #245 – Big Brother turned to the Minister of Truth and said “heretofor, cut off lows shall be called tropical storms.” And so it was.
Mediterranean tropical like cyclones are not rare features during the…winter months, when SST are around 15°C. In summertime, when SST are 26°C or more, no cyclone can organize, and never I saw one of it, under or close to the well mixed, thick, dry, Saharian layer. Barotropic lows can acquire tropical characteristics in a cold Med sea during the other months in the same way they do at similar latitudines.
The speciality of the Med sea is, unbelivable, all that land around, lacking adequate moisture to supply to the Medicane, not to mention the worldwide common feature of high wind shear at that latitudines.
Emanuel, if I remember correctly, doesn’t rise a special case for the Med, he couldn’t.
Last week there was a high degree of excitation in the Italian met blogsphere because all numerical models forecasted a powerfull, non baroclinic low south of Sicily, eventually moving toward the island. That forecast didn’t materialize. In the meantime, another small low near Minorca acquired some organization and made landfall in the est coast of Spain. No report available.
David, I think Jeff Masters is late: central Med is under the effects of a rare October cold spell, with many month records broken in the Italian islands and snow at 1000 m in Sicily, an event non recorded in the Sicilian recent history for October. No low is forecasted in the next days to become tropical.
By the way, this evening a TV weather man said that this unusual cold spell is the Earth reaction to the ongoing warming! No laugh, please.
I wonder if Gray/Klotzbach have thrown in the towel and started including subtropical storms in their seasonal “tropical storm” count. I base this on them showing 13 storms as of October 1. The only way to tally 13 storms is if they include Andrea, which was subtropical.
However, their start-of-season forecast made the following point:
(I removed some strange question marks which appear throughout the original text and which look like some sort of software malfunction.)
I hope that they haven’t dropped their standards and that the 13’th listed storm is simply an error. If they have lowered their standards, and if people continue to check the high latitudes and even subpolar regions for swirls, we may be seeing 30+ “storms” a year. There are even swirls in the Arctic clouds – perhaps those should be included too.
RE: #249 – Name it and claim it! Therefore, Andrea, Chantal and one’s whose name escapes me, all bogus storms, all some form of home grown, cold to luke warm core feature, all instigated by some sort of vorticity which peeled off of the Polar Jet, got counted. Yes, David S, they have stooped that low. Subtract out those and it’s 9. Below long, long term average. Even 13 is unremarkable but it certainly does less to pull down on the 2005 spike than 9. Any slight bit of padding to tweak the past few years to make it look worse than it is.
Re: #250
In the forecasting business you take what you can get — as in naming and claiming. Unfortunately Steve Sadlov did not consider this inclination in his forecast (as I did in mine) so all we hear from him are the bogus storms of 2007.
David S. please keep me updated on any swirls that could be potentially named in the NATL. Would a Medicane qualify for the NATL?
Re #250 and #251 – That makes the percentage of severe storms (4 and 5) lower for the year.
Kenneth you and I need several more storms so as to verify our 2007 forecasts. So, we may need a serious look at annexing the Mediterranean and Arctic regions into the Atlantic basin. After all, they connect and are made of the same stuff.
Regarding clouds, our motto is: “If it spins, it’s in!”
My motto is, norm to AGW. Step 1 – determine what the models say the rise in named storms should be. Step 2 – fit the storms to the rise.
To further that …. what you don’t want to do is end up with something that looks suspicious. So, what you do is, take advantage of a year like 2005 as follows. It would be too obvious to say, have 2006 and 2007 be too close in number to 2005. So what you do is, create a little semi chaotic model. This model would say, how low can I go, while still ensuring that the TREND in named storms is correct. So, you bound your expected result for a given year with the how low can I go number being the lower bound, and say, some number about 6 storms above that figure being the upper bound. I forecast something just above the lower bound. Then, I go all out, naming and claiming, and finding spins that should be in, in order to cook my books.
Wow. Here’s a Powerpoint that combines tree rings, oxygen isotopes, hurricanes, historical reconstructions, teleconnections and Homer Simpson. Something for everyone!
Link
Several comments remind me of a high school test.
#1. A storm has been named Andrea. It will not be counted as a named storm a few months from now. Is Andrea a named storm today? Explain in twenty words or less.
During the season some of the NHC advisory discussions contained rather labored justifications for the conclusion. They probably drew straws, the loser had to write the announcement.
Re 247:
quote: Big Brother turned to the Minister of Truth and said heretofor, cut off lows shall be called tropical storms. And so it was. unquote
Might I be pompous enough to take issue with your vocabulary? I think you mean ‘hereafter’ as in ‘from this time hence’. ‘Heretofor’ would mean going back and changing the past…. Hmmm. Yes. I see. I was forgetting. Climate science. I beg your pardon. Sorry I spoke.
And so it used to be.
JF
Heh Heh
Re: #253
“If it spins, its in” is definitely a keeper. We can never have too many of these little ditties in the huckstering.. I mean forecasting business.
Re: #230
In my view there have been a number of “Inconvenient Truths” presented in these TC/hurricane threads for the “AGW correlates with significant increases in storm events” climate community to contemplate.
We have the rest of the TC development world versus the NATL and the community focuses on the NATL as if the rest of the world either does not exist or tangentially that the record keeping is best and proper only in the NATL.
We have the constancy of landfall events over time and the community argues that either the numbers are not sufficient to show statistical significance or that the ratio of landfall to non-landfall events has actually changed.
We have evidence that the more easily detected TC events have not changed as much as less detectable event categories have and the community counters that argument (that detections capability have improved significantly over the years) with the dumb ships theory that uninformed ships of the past detected (and measured?) storms.
We have a graph and comment of Bob Koss:
Yet as I recall, Holland and community have an answer for that observation, as noted by David Smith, in that the storm development area is changing, i.e. the differences east and west -60w are not evidence for a detection change phenomena but caused by an actual change in the areas of storm development. (I would hope we could discuss in detail the Holland arguments for this view on this subject).
Kossin on storm data re-analyses (from satellites?) shows that from the 1980s forward the worlds TC areas have not, overall, produced an increasing trend in storm development, but does confirm that there has been one in the NATL. The community notes that that period is too short to establish a statistical trend and then decide that their work will be concentrated in the NATL and some will use the time period from the 1970s forward as the time of good data and not spend much time explaining that it also can correspond to an upward part of a re-occurring cycle of storm frequencies.
The community has dealt with the Inconvenient Truths by countering with theories of their own. It is for each of us to determine the convenience of those answers.
Ref 248
Paolo, Is this the weather report for 18th October you are looking for? Link
RE # 261:
Philip, thank you very much.
In this satellite picture you can find the more impressive cyclone in the central Med.
Some comments on Masters’ report.
He highlighted the +1°C sst anomaly, hoping that a warm cyclone can develop in the Med sea when its surface temperature were at 26.5°C or more.
As I said before, that temperature is reaached only in August and in 40 years I have never seen a tropical like cyclone (tlc)in the middle of Summer.
There are quite more visually impressive tlc in the recent history, almost every year, and almost all in the cold months, look at this, for example.
I don’t understand why he get excited when he writes that
Is it so extraordinary a thing like that in the midlatitudines?
A bit off topic but I thought I’d throw this out for people to think about. A while back I did an analysis of hurricanes as a Poisson process. Out of curiosity I extended it to tropical cyclones in all the basins where they form, which all turned out to be Poisson too. One automatic gimme of being Poisson is that the time between events is distributed as an exponential. The probability distribution of the time, t, between events is
P(t) ~ exp(-t/T)
Using data at http://data.climateaudit.org/data/hurricane/unisys/ I computed the value of T for each basin. The results are as follows (the second pair of numbers is chi squared/degrees of freedom)
EPAC: 10.0 +- 0.5, 20.0/35
WPAC: 8.0 +- 0.3 days, 73.0/36
ATL: 11.5+- 0.5 days, 37.9/39
SH: 6.3 +- 0.2 days, 36.1/34
The fit was done between 3 days and about 40. There’s a deficit of TCs forming within 1 to 3 days of each other, and the data runs out after about 40 days.
(NIO has two distinct time periods, before 1978 with a mean annual TC count of 15, and post 1978 with a mean TC count of 5. PDO? I didn’t bother analyzing NIO)
So what governs the formation of tropical cyclones that causes the exponential distributions? Can anyone predict T for any basin? Why the defict of events at short times?
Re #263 Paul there were notable changes in the atmosphere above the Northern Indian Ocean around 1976-78. PDO, I don’t know, but something changed.
Storm seedlings in the Northern hemisphere form on a fairly regular basis. In the Atlantic, for instance, seedlings (African easterly waves) form over Africa every 3 or 4 days and move across the tropical Atlantic. They travel through regions which are hostile to their growth but there are occasional rather small regions where growth in encouraged. If one of these seedlings encountere a favorable area and begins to develop, it usually modifies the surrounding (upper) atmosphere in ways which inhibit other nearby seedlings from developing. Once the formed storm moves away then the atmosphere reverts back to a mode which is less hostile to development of other seedlings.
Maybe the combination of regular seedling formation, limited regions for development and inhibition of other seedlings combine in a mathematical way to space the storms apart.
A non-global warming explanation for the lack of moisture/drought in the US Southwest deals with the lack of Hurricane activity in the Eastern Pacific basin. The moisture, upper-level outflow, and accentuation of the monsoon can all be traced back partially to EPAC storms, which are highly sensitive to SST conditions in the equatorial Pacific (ENSO). Simple reanalysis calculations for inactive minus active EPAC seasons shows very significant deficits of monthly mean cloud water, precipitable water, and surface specific humidity (among a host of other variables) for Aug-Sept months over the US Southwest.
This image is constructed as follows: I take the Accumulated Cyclone Energy over the Easter Pacific TC basin for the months of July – September (Oct is usually quiet). I calculate the seasonal deviations from the 1979-2007 mean EPAC ACE — which is fairly bimodal — as one would expect with the sensitivity to ENSO. I then take the active and inactive years (0.5 sigma) and composite the August & September column cloud water (or any other variable) differences (date obtained here from Japanese Reanalysis Project; one could use NCAR/NCEP or ERA40). So, I have 10 years of active and 9 years of inactive ACE years in the EPAC. The following example shows that a greater than 20% difference in cloud water is associated with whatever is concomitant with active vs. inactive EPAC hurricane seasons. This means that a researcher or a responsible journalist would ask: what weather patterns or climate regimes are typically associated with decreased rainfall in the Southwest US, which is a desert, if anyone cared to notice? Instead you get hyperbolic, speculative propaganda about an “upcoming century of fires”.
Despite what Harry Reid says and no matter how hard CNN pushes the Planet in Peril to link global warming to these fires (also NBC, CBS, ABC and the rest of the so-called mainstream media), it is partially the lack of hurricanes that has contributed to the excessive drought conditions — talk about an inconvenient truth. And, by the way, the Northern Hemisphere Tropical Cyclone activity is still on pace to be the weakest since 1977 — Tropical Activity
Ryan, I strongly suspect that a sort of hysterisis loop has been completed, and we now find ourselves, in many ways, back where we were in ’76 or ’77. Since this has been a loop in the so called “greater than zero” region in terms of energy accumulation (excess heat) I would expect us to now go into a countervailing loop in a so called “less than zero” region (heat deficit). We’ll see if this admittedly intuitive impression turns out to be correct.
Interesting observation, Ryan. Good work.
Using only Aug-Oct of each year, I associated the tracks with the SST for the month in that 2×2 grid location and divided the basin where the track count balanced the best. I used Reynolds ersst v3 temperature data.
At a glance it appears there may be a wind/SST relationship since the west basin is higher in both categories. Further thought leads me to think the one-way traffic between the basin areas might account for the wind-speed difference.
Below is the last ten years of tracks(445). Anomaly period 1901-2006. Used sqrt(wind) for scaling purposes. The linear lines seems to suggest air-sea temperature difference has an effect.
Reading this link, I get the impression that the current drought in the SW is caused by the recent
shift in the PDO cycle from positive to negative.
http://oceanworld.tamu.edu/resources/oceanography-book/oceananddrought.html
“Positive PDO values are usually associated with wetter conditions in the Southwestern United States, while negative PDO values
are suggestive of persistent drought in the Southwest.
From Robert H. Webb, Richard Hereford, and Gregory J. McCabe. (2000) Climatic Fluctuations, Drought, and Flow in the Colorado Rive”
Atlantic Multidecadal Oscillation involves changes in surface temperature over large areas of the tropical Atlantic over periods of several decades.
“Recent research suggests that the AMO is related to the past occurrence of major droughts in the Midwest and the Southwest. When the AMO is in its warm phase, these droughts tend to be more frequent and/or severe (prolonged?). Vice-versa for negative AMO. Two of the most severe droughts of the 20th century occurred during the positive AMO between 1925 and 1965: The Dust bowl of the 1930s and the 1950s drought. Florida and the Pacific Northwest tend to be the opposite – warm AMO, more rainfall.
From Atlantic Multidecadal Oscillation web page of the Atlantic Oceanographic and Meteorological Laboratory.
”
The relationship between drought in the continental US and the phases of the Pacific Decadal Oscillation (PDO) and the Atlantic Multidecadal Oscillation (AMO). The most severe droughts occur when the PDO is in a negative phase, and the AMO is in a positive phase.
From McCabe (2004).
“More than half (52%) of the spatial and temporal variance in multidecadal drought frequency over the conterminous United States is attributable to the Pacific Decadal Oscillation (PDO) and the Atlantic Multidecadal Oscillation (AMO). An additional 22% of the variance in drought frequency is related to a complex spatial pattern of positive and negative trends in drought occurrence possibly related to increasing Northern Hemisphere temperatures or some other unidirectional climate trend. Recent droughts with broad impacts over the conterminous U.S. (1996, 1999-2002) were associated with North Atlantic warming (positive AMO) and northeastern and tropical Pacific cooling (negative PDO). Much of the long-term predictability of drought frequency may reside in the multidecadal behavior of the North Atlantic Ocean. Should the current positive AMO (warm North Atlantic) conditions persist into the upcoming decade, we suggest two possible drought scenarios that resemble the continental-scale patterns of the 1930s (positive PDO) and 1950s (negative PDO) drought.
McCabe (2004)”
– A. McIntire
Re #268 Bob my brain is in slow mode today and I can’t quite grasp the top chart: what is the x-axis in that plot? Thanks
# 263 Paul Linsay
I dont see much to be gained by pursuing an analysis based on the waiting times having an exponential distribution since IMHO, the formation of tropical storms does not appear to follow a simple Poisson process. Another automatic gimme of the simple Poisson process is that occurrence times in any interval are distributed uniformly and this is pretty definitely not the case. Using the data I downloaded from http://maps.csc.noaa.gov/hurricanes/download.html , I did a histogram for the formation dates for all TSs from 1946 on (the variable is the day of the year with Jan. 1 = 1):
If this is to be a Poisson-type process, the process must be a non-homogeneous Poisson process with intensity ë(t) = a function of time. For such a process, given n occurrences in any given interval, their distribution is then the same as a simple random sample of n realizations of a random variable whose density function is ë(t) (suitably normed to be a density over that interval) and the waiting times between occurrences are distributed not as exponentials, but as the differences of consecutive order statistics from that distribution. In this case however, given two consecutive formation times from this type of process, the integral of ë(t) over the interval between the two occurrences does have an exponential distribution. I used a density fitting procedure in R to fit a ë(t) to the TS formation data (assuming that the intensity shape stayed the same from year to year, but allowing for it to be multiplied by different levels in different years) with the results:
The mode of the estimated density indicates that the highest rate of TS formation is in the early part of August.
#271, RomanM
Sorry, but you got it wrong. Look at Figure 5 of a post I wrote in January. You’ll see that the time between hurricanes, defined as the time between their start dates, is distributed as an exponential. The figure is for NATL hurricanes but it’s an exponential for every ocean basin I looked at.
What you are doing is plotting the time of year when hurricanes form. As Prof. Higgins wouldn’t say, hurricanes hardly happen in Hapril.
Dave,
Heh. I was marble sharp myself when I did them up. Y=wind and X=series index. Should have shut the x-axis label off or converted to a percentage and stated the sample size was 4127 tracks.
Paul,
I neglected to put in two links to Wiki here and here to help explain what I apparently did not do very well. I am aware of which variable I graphed in the two graphs in #271. If the process of formation of TSs follows a simple Poisson process, then those graphs should look flat over the entire range of times during which the storms can form. Yes, and in that case, you would be right that the times between the start dates of two successive storms would all have an exponential distribution with the SAME parameter anywhere in that range… and, in that case, Prof. Higgins would NOT be able to say what he said, because every moment in Hapril and Hmay and Hjune would be an equally likely time for a TS to be born. We would have roughly equal numbers in each month of huuricane season. Those are the assumptions that are made in the derivation of the theory behind a Poisson process – the chance of formation is constant across the time period you are considering.
But, Prof. Higgins’ statement is exactly why this is not a simple Poisson process. It is not just my opinion – what I wrote is standard theory of found in any text book on stochastic processes . The times between storms do not behave like independent exponentials. If it is Poisson, then the times between storms in June should have the same distribution as times between storms in August or in October – compare them – do they? Many things “look like” they are exponential. That is why basing your conclusion on a graph without looking at the theory can be dangerous. If you base your analysis on something that is not true, then any conclusion that you come to just won’t stand up. (Look at the hockey stick for an example of that. 🙂 )
To quote Monty Python, I didn’t really come here for an argument. What I was hoping to offer were some concrete suggestions about properties of the process of storm formation that should and can be taken into account if we want to understand and model their behaviour in a better way.
#274, RomanM
You are right, the value of 1/T is really an average over the hurricane season, which is heavily concentrated in August. It doesn’t really change things much and still leaves the exponential intact. You could refine the analysis and look at the distribution of inter-storm intervals on a month-to-month basis. I don’t have the time to do the analysis, but I’d bet they are still going to be exponentials, though with somewhat different values of 1/T as you point out. That still leaves the question of how to compute the value of 1/T from first principles. David Smith gave an interesting explanation for the deficit of short time formation.
One impression I have of the 2007 storms is their relative lack of deep convection, as indicated by cloud top temperatures. Normally tropical cyclones, especially intense ones, move moisture to very high (cold) levels of the troposphere, and this is reflected in cold cloud tops. This year the extent of very cold (-70C,-80C) tops has been limited, including in the two intense storms.
In recent weeks, though, the very cold tops are again apparent in regular tropical Atlantic convection. A few days ago there were -80C in the northern Gulf, which is unusual.
What this might mean is that, during the storm season, the tropical Atlantic atmosphere was somewhat more stable than normal and/or upper-troposphere features were unsupportive of very deep convection and/or phenomena like the MJO were affecting things. I have no explanation as to why. It will be interesting to see what the pros have to say once the season is over.
And speaking of the Atlantic season, I think we’ll see another storm or two before things close at the end of November. Nothing major, though.
#275 Paul
I am going to take one more thwack at the barely twitching horse and then move on.
It DOES really change things that much and they are NOT exponentials. The derivation is very simple and I put it into a short pdf document which can be found here . The fact that storm totals over any interval of time are Poisson distributed remains unchanged – what are affected are the distributions of the intervals between successive storms. I would not recommend basing any analysis on the false assumption that they have identical exponential distributions. Moving on…
I extracted the GOM area tracks 60+ miles from land that have an ACE value, and sorted them by SST. SST is based on Reynolds ersst v3 monthly values. The anomaly values used are based on the entire series. Mean ACE is .49 and mean SST is 28.9c. The series has 1395 tracks. Interestingly, more than 60% of the tracks come from the first half of the time period. I still don’t see SST driving intensity.
Here is a map showing the tracks. Link
The first chart is the entire series and the second is a zoom of the last 400 tracks.
Bob, nice plots. I’m surprised about the smaller number of tracks in the last 50 or so years and need to ponder that.
One of the seldom-mentioned pieces of Atlantic data is the Gulf of Mexico sea surface temperature (SST) anomaly . The Gulf (a well-sampled body of water) was at equal or higher temperatures during the 1930s than it is today.
An interesting (to me at least) satellite image is the current Atlantic water vapor imagery ( here ) .
Water vapor imagery captures water vapor (relative humidity) in the upper half of the troposphere. A strong impression of the upper troposphere in the tropics is that water vapor distribution is quite “lumpy” and not evenly distributed. There are regions of very high concentrations (saturated or near saturation) and regions of dry air. Generally speaking the moist air is ascending (thunderstorms) while the dry air is cooling and sinking.
Among the things of note is that the tropical Atlantic has been invaded by large regions of dry upper air from the mid-latitudes. This will tend to inhibit tropical cyclone activity.
Also visible is a strong seedling south of Hispaniola which may well become a tropical cyclone soon. The center of the seedling is the area of purple and blue.
There are also weak seedlings at the west end of Cuba and at about 40W longitude.
Regarding global warming, the brown and black regions allow considerable IR to escape into space while the white areas slow the escape of IR.
Lindzen’s hypotheses center around strong precipitation (the colored areas) creating relatively less cirrus and saturated regions (white areas) than does weak precipitation. As the globe warms, warm tropical precipitation becomes more intense and reduces the area covered by the white, thus allowing more IR to escape.
I believe his thinking is that warm-world tropical precipitation is more “efficient”, perhaps meaning that less condensation (water droplets and ice crystals) are carried to high altitudes, thus less of the white cirrus and near-saturated high air. Personally I also wonder if warm-world precipitation tends to cause air pacels to ascend to higher altitudes than cool-world precipitation, air which becomes drier because of the higher altitude to which it ascended.
My anecdotal observations agree with Lindzen.
This is a very important topic because it (high-altitude water vapor in the tropics) is the primary cause of the amplification aspect of AGW.
David #279,
we have to get rid of those inconvenient GOM SST data!
Dave, your mention of the Gulf being warmer first half of the century made me look closer at what the tracks looked like over time(unsorted). There were many periods where ACE was down while SST was high. Pre-1933 was way down for SST. The period 1933-1945 stands out, when track SST was .27 above the long term mean while ACE was at -.13. One of the solar peaks was around 1939. Hmmm.
Tropical Storm Noel was named earlier today, giving the Atlantic thirteen named tropical cyclones for 2007. The season is just about spent but nature may squeeze out one or two more before December 1.
My 16 year-old is trying to teach Java to me and, as a learning exercise, I plan to write a program I call the Hurricane Game ( link ). It’ll be interesting to see what 100-year storm count distributions emerge as I turn the knobs.
With October nearly done circling the drain, I figure it is about time to bring out the broom : Northern Hemisphere tropical cyclone activity is at historically low levels . In fact, September 2007 suffered the lowest ACE since 1977 ! Even scarier, so far 2006 and 2007 have the lowest October ACE since 1976 and 1977. And, unnaturally, Sept-Oct 2007 is the lowest since 1977. Yet, the tropical cyclone season was not shaping up to be such a ghastly bust. For about a week in June, NH ACE was exceeding climatology but then bit the proverbial dust until mid-August when a noticeable comeback ensued. It has been downhill since.
So, a naysayer over at the Huffington Post or the Daily Green may wonder why we use such metrics such as ACE/PDI or Tropical Cyclone days when we could use better metrics like number of category 5’s making landfall or storms that have intensified the fastest or perhaps number of pumpkins. There are even some spooky hints that the 2007 (Atlantic) Tropical Cyclone season is being “spun” to appear “dead” and inconsistent with the predominant trend. Also, a “storm pundit” would remind that us that the year is not in the grave and we may see hyper-activity (a.k.a. global warming proof) to come. Here is what needs to happen to reach the 1970-2006 mean:
140 Tropical Cyclone Days — on average, 40 TC days (sigma of 16 days) occur through the end of the year. Slightly more than 70 TC days occurred during 1984, 1992, and 1997. Thus, 140 TC days would be at least a 6 sigma event
50 Hurricane Days — on average, 16 Hurricane days occur through the end of the year. Slightly more than 30 hurricane days occurred during 1984, 1990, 1992, and 1997. Thus, 50 hurricane days is more likely, only a 4 sigma event.
Record level ACE exceeding 1997 ENSO enhanced output — just to reach the yearly mean — about a 4 sigma event.
Yet with nature, I wouldn’t bet my last carbon credit against an extreme event. We may need some poleward-moving, late-season tropical cyclones to save us from the winter of 1977-1978. Art Bell will have to warn the “indigenous dog-people” to collect additional firewood…
2007 also holds the satellite-era record for longest period without a tropical cyclone anywhere on the globe. This was set in the first half of the year and I believe it is 43 days, breaking the old record by several days.
David, I think it was 33 days without tropical cyclone advisory: from April 6th (Tropical Storm Kong-rey) until May 9th (SUB-Tropical Storm Andrea).
If we ignore the naming of Andrea, this period would have lasted until May 13th (Cyclonic Storm Akash).
RE #286 Yes, I think you’re right. Also, in my view it should be tropical-to-tropical, which means April 6 to May 13. Thanks for the correct info.
Ryan
your website is headlining on Drudge report
http://www.drudgereport.com/
Re: #283
David, that sounds like a fascinating project, but before you start turning knobs, I hope you do some a prior rationalizing. It doesnt take many knobs or turns of them to (over)fit a model when data snooping past results. You could reserve part of the past data for verification if you can overcome the human tendency to snoop.
You might want to let us know whether your methods will be primarily dynamical or empirical. I would think that if it is the former you would receive some support from Dr. Curry. She might even want to let her students play with your model by a prior plugging some first principals into your model.
Big thank you to Steve McIntyre for his forum and all for their very positive comments online and off — the scary picture of Hillary Clinton on top of Drudge definitely fits in nicely with my other post . So far, pushing past 60,000 hits… Rush Limbaugh talking about it now…
When I saw drudge post yur stuff and heard Rush mention your junk, I thought
“may god have mercy on his server”
You do good work. nuff said.
Good work, Ryan 🙂
Kenneth, our model will be overwhelmingly empirical and wholly inappropriate for forecasts. I just want to learn if I have the broad features right.
For forecasting I use the empirically-derived “Shiner Bock” algorithm.
I’m intrigued by this plot .
This plot is for the tropics (20N-20S) and uses RSS satellite-derived data for 1979-2007. The plot shows the difference between the temperature anomaly of the lower troposphere and the middle troposphere.
The higher the value, the smaller the temperature difference between the lower levels and the middle levels. The smaller this temperature spread, the more stable the atmosphere (speaking broadly). The more stable the atmosphere, the less storminess there is.
The plot show sharply rising values beginning in early 2006, which is consistent with increasingly stability. By the summer of 2007 the “stability” is back to levels last seen in the early and mid 1980s.
And, as we know, the 2006 tropical cyclone season was unspectacular and the 2007 season has been a dud. My conjecture is that there’s a relationship between this sharply higher “stability” and the drop in global (NH) storm activity.
The $64K question is, why did the tropical “stability” change?
re 293 David Smith
Your conjecture is that the stability is a cause of less tropical cyclone activity. Could it be that it is a result of less tropical cyclone activity?
re: 294
Considering that tropical cyclones move heat from the surface to higher altitude, they would act to reduce the difference. So I think it may be cause rather than effect.
Forecaster says ocean cooling will increase tropical cyclones for Australia. There has been a 30 year decline in cyclones downunder which seems to fit with a PDO/ENSO cycle. But cooling oceans = more cyclones is a bit of a problem for the warming is bad crowd.
http://investing.reuters.co.uk/news/articleinvesting.aspx?type=allBreakingNews&storyID=2007-11-09T135134Z_01_L09459644_RTRIDST_0_AUSTRALIA-CYCLONES.XML
#296 PhilipB …while the cat (David Smith) is away
asleep?? Rattatouille danses on the table…
Well, according to the Reuters’ article the 2007/2008
Australian cyclone season as bad as 1998/99 when 16
cyclones of which 10 became severe affected the region…
BUT according to WIKI there were only 14/9 if yours
truly counts not too badly…The TRS consortium is said
to have a very good record in predicting cyclones “down
under” but they failed miserably ACE-wise this year in
the Atlantic…More to come…
Re #296, 297 The full TSR forecast for Australia can be found here . Looks like a forecast of somewhat above-average activity with an ACE forecast of 90 versus the historical average of 83.
The driver for the forecast is La Nina, which reduces wind shear in the key South Pacific regions. The lower SST along the equator is part of La Nina pattern. SST closer to Australia may be at or slightly above normal, which is also part of the pattern. The key, though, is wind shear, as TSR notes.
A switch away from frequent El Ninos (1976-current) to frequent La Ninas would likely increase the activity in the South Pacific back to earlier levels. Carl Smith and others have likely looked into this in detail and may have some good thoughts on what the future would hold.
Staffan, there is a swirl near Panama that has a slight chance of becoming a named Atlantic storm. If that happens, then the total for 2007 would be 14 tropical cyclones which would make you and the SHB (Swedish Hurricane Bureau) our contest co-winner (along with Jonathan Schafer). Wow! Please share your methodology, especially if it involves ethanol.
Re #295, #294 Good question and I think that DeWitt captures the gist of the situation. A more-stable free troposphere also tends to be drier than normal, which can create havoc with seedlings and affect intensities. And changes in stability may be a symptom of other atmospheric processes which also inhibit storms. Ryan or Judith can provide deeper and more-accurate insight on the issue.
NOAA monitors stability in key Western Hemisphere regions. The 2007 charts for the tropical Atlantic , Western Caribbean and Eastern Pacific show this tendency towards stability. (The lower the number, the more-stable the atmosphere.)
@Judy Curry:
All filtering can introduce anomolies (but is sometimes necessary, and, of course applied to lab data all the time.)
It’s difficult to answer your question without knowing the properties of the data. But when designing experiments, experimentalists do use rules of thumb prior to data collection to maximize the likelyhood of being able to learn something from the data after they have collected it.
If you are trying to filter out high frequency noise to show a long term signal, and you know little about your data in advance, one rule of thumb would be to make sure your the time period for your full data record is always at least 30 times your filter time period. So, for example, you could use a 9 year low pass filter to a data record that is 270 years long. The reason for this is that by filtering everything frequencies less than 9 years you are sort of inherently restricting your data to having an integral time scale greater than 9 years.
In anticipation, it’s best to be sure you have at least 30 integral time scales to feel confident you can learn anything. Loosely speaking, this will give you roughly 30 independent samples, which is starting to approach “infinity” as far as statistics go.
Obviously, 30 is a somewhat arbitrary number and more precise values could be obtained if you know in advance some properties of the data itself. (For example, if it turns out the long range signal was very, very strong, and the noise small, it may turn out you could have gotten away with fewer than 30 multiples of the filter time period; if the data contained lots of noise, you may end up needing more data. )
One caution: Everyone is always tempted to use the rule of thumb less than 30 because they “feel” they can “see” more. Unfortunately, visual inspection is particularly dangerous. You should avoid using a filter that results in data having fewer than 30 integral time scales unless the trend you “see” in the image passes some simple statistical tests.
Another aspect of this plot is the tendency for the tropical atmosphere to apparently become less stable in recent decades. However, I believe that AGW models forecast a tendency towards greater tropical stability, not less. So, this apparent behavior may be inconsistent with the AGW predictions.
I’ll quickly add, though, that the middle-troposphere temperature readings are affected, to some extent, by stratospheric temperatures, and this approach is a crude indicator at best, so it’s a bit of a tangled mess. It’s an active topic which is worth exploring at CA at some point.
Lucia…
You will have more fun here with stats than over at Tamino. Although
I liked your nit picking there.
@Stephen– I’m not a statistician.
As long as you bring it up, for what it’s worth, I don’t think I was nit-picking. I am a great admirer of simplification, clarity and doing simple problem to illustrate concepts. But if Tamino believes that he is doing a positive service and “clarifying” by cutting out essential steps that are absolutely required to get the correct answer with limited data set, he is entitled to his opinion.
In my opinion, if he wanted to illustrate the simplest possible t-test he should have selected a simple problem. A test using at least 30 statistically indepedant data points would have been dandy. (Then he could point out he took the short cut and give a reason based on the actual problem at hand.)
In my opinion, his including what appears to be a quite poor analysis with the later one will tend to foster doubt in those who have taken undergraduate courses in statistics, but did not continue further to master more sophisticated treatment.
For what it’s worth, the second bit of his analysis does seem to show that the later years are warmer than the earlier ones and the result is statistically significant. (At least, as far as I can tell.)
That answer, relying on more data, would trump the “Failed to reject the null hypothesis” obtained with a smaller data batch. After all, it is a simple fact that if you don’t take enough data, your answer will nearly always be “Failed to reject”. Tamino could have said that. Why he didn’t is a mystery to me.
Steve deleted all your claims of devotion to me on the other thread. Do you still love me? Or will you chop off my legs:)
(Steve M. – why is it so difficult to type in your comment field? I’m typing in a text editor and cutting and pasting.)
Lucia,
Tamino always takes these annoying little short cuts or doesnt document his work very well.
I think he is more interested in making a point. I remain your fan and enjoyed
your sparing with Tamino. I think he is used to praise. The Boxing Helena clip was kinda outlandish.
Opps.
303, It’s a function of your browser and your RAM, and the depth of the thread. I believe it has to do with the instant preview script. Anyway, get used to it. This blog software isn’t custom, it’s acquired from somewhere. You take the idiosyncrasies with the package.
@Larry–
Well, at least on my computer, this slowness could result in even more typos than I usually post. My typing isn’t terrific and I don’t always proof-reeeeeed, so you can imagine it’s going to get pretty ugly sometimes. That said– I can deal with it.
@Steve– I thought the Boxing Helena reference was clever under the circumstance.
As for Tamino’s blog, I think it’s the first time I visited it. I’ve read exactly one post, and I guess my first impression is that he is a theoretical mathematician who doesn’t really have much of a feel for practical application. I realize could be wrong about that, but … hey….
I should probably go back and see if he ever responded and told me the the value of “alpha”, which, as far as I could tell, would probably not be zero. More importantly, it was likely to fall in the range where accounting for it might pretty much totally change his answer from “true” to “false”. (Well… in so far as one can use those sort of terms for hypothesis tests.) I returned after several hours (about 12 I think– not clocking this) and there was no answer, so I figured there is no point to hurry back.
The 2007 Atlantic hurricane season is finished. The official season still has two weeks left but the tropical Atlantic is covered by unfavorable conditions which will only get stronger. Below are several plots updated to include 2007:
First is Atlantic PDI (a measure of storm activity that is particularly sensitive to extreme windspeed). This bar graph contains the data which can be used to update Kerry Emanuel’s famous plot, which I may do later.
Related to this is a plot of the average PDI per storm ( here ). (The unmarked x-axis is the year, starting with 1950.) If anything, the plot trends downward, due to dilution of the denominator by the increase in detection and recording of weak storms.
Speaking of weak storms, here and here are plots relevant to anyone bold enough to use historical storm count data. These are plots of short-lived storms, which are almost always weak and cover only small areas. These were quite hard to detect prior to the recon and especially satellite era. These have become quite a nuisance for any comparison of modern storm count to that of earlier eras.
RE: #298 – but … does the “La Nina Law of Low Shear” hold true when PDO has gone negative and the AMO has gone negative? 2007 was supposed to be a wicked La Nina TC season. It was wiped out by the following things:
1) Shear
2) Dust
3) Tropical dryness
4) The ITCZ stayed close to the equator or at times was badly fragmented
RE: #307 – I think our wagering game essentially proved that any comparison of recent and past TC count is comparing apples and oranges. There has been a de facto change (a lowering of the bar) in terms of TC Op Def over the past 50 years. Or maybe the way to put it is, the “classical” Op Def was not well put, and 50 years ago, we only counted a subset of what was actually technically allowed by the Op Def. Additionally, today, we have the abominations of Dvorak and certain other aircraft and satellite assisted “measurements” which are taken as gospel but are in fact highly subjective and prone to manipulation by someone in search of a specific outcome. Personally, I would greatly restrict the TC Op Def. I was set a line in the sand in terms of PDI/storm anything above it is a named TC anything below just normal weather.
It seems to me that we ought to stop forecasting TC system counts and start forecasting ACE for the season. That would give a more accurate representation, IMO, of season to season and whether you are above or below average.
There is also the recent start of phase space analysis to determine if an low pressure area is warm-core (tropical) or not. This applies mainly to those spinning areas in the open Atlantic which used to fall into the who-cares-it’s-so-weak category but now are finding there way into the records as “tropical storms”.
Re #310 Yes.
Actually, the professional forecasters do forecast ACE, but it gets lost in the media coverage probably because the public doesn’t understand the ACE concept. Storm count, though, is an easy idea for many folks, regardless of its warts.
I’m thinking that a 1 to 5 “Storm season” scale, which incorporates ACE, geographical coverage by destructive winds, and maybe proximity to land would be the best seasonal forecast. People understand the idea of a cat 4 storm, maybe they’d grasp the idea of a cat 4 season.
The 2007 observation is consistent with the analyses done last year on hurricane counts. Whatever the reason there is some kind of long-term persistence in the ACE process that leads to 5-year and 10-year periodicity in the storm count (bottom left graph).
Here’s the Atlantic tropical cyclone count when the hard-to-detect short-lived storms are excluded.
The data shows a slight upward trend over the last 75 years but, for reasons having to do with problems in storm detection in the eastern Atlantic, even that trend may not exist.
The 77-year period shown is basically a peak-to-peak period.
Regardless of the metric used to look at trends and possible changes of TCs in the future, it is still useful to note what we do not know about the current climate:
1. Why are there about 100 TCs each calendar year and not 10 or 1000?
2. Why do some storms rapidly intensify and others do not (forecasting issues as well)?
3. Genesis
4. Will intensity forecasts improve at all in the next decade?
Now, take those 4 questions about what we don’t know, and apply them to the UN IPCC climate models or some other interpretation of the climate in 2032. Is it possible that 25 years may go by before we are able to answer any of the first three questions?
Re #313 bender, a 10-year (more or less) periodicity shows up here in PDI, SST and western Caribbean SLP (sea level pressure). While the SST/PDI oscillation gets the most attention the SLP/PDI correlation (using unsmoothed data) is actually a bit stronger (SLP/PDI r = -0.56 ; SST/PDI r = 0.52). Also the SLP more-clearly shows the 1995 AMO shift.
What drives the apparent decadal behavior? Dunno.
David, see #174 and #176 in Loehle thread
And damn your tigers.
RE #314 The time series should be labeled as “Short-Lived Storms” (24 hrs or less), which is not necessarily the same a s “Weak Storms”. Sorry.
Re# 315 Ryan are there any papers which offer conjecture on your question #1? My impression is that the number of seedlings (globally) fluctuates around a mean and the time-extent of favorable regions fluctuates around a mean, and the chances of a seedling encountering favorable conditions fluctuates around a mean, so that I guess I’m not surprised that the global cyclone count fluctuates around a mean. That all has to be worked backwards, of course, into what drives seedling production and the extent of favorable regions. I suspect, too, that a cyclone alters the conditions nearby, which may dampen the chances of nearby seedlings, sort of negative feedback to the process. Thanks.
Re 310 and 312
Couldn’t agree more with both.
Re: 315
Ryan.
All valid points. However, as evidenced once again this week in Valencia, the IPCC unfortunately remains uninterested in what we don’t know. Yesterdays’ press release reconfirms the “consensus” about what we purportedly know [with 90% certainty no less], in particular where GCMs and their various long terms projections are concerned.
David, #318…Sure, Palmen 1972 I think conjectured about the role of TCs in climate and several others have estimated the impact (about 10%) of TCs in terms of heat flux out of the tropics. However, little progress has been made — partially because the number of scientists working on an answer is probably less than 10. Tropical meteorology is a pretty small community.
I don’t know why the number of seedlings (depending on what those are) is what it is. Since the atmosphere has a pretty short memory (4-10 days), it would seem the ocean’s timescales are likely the most influential in terms of seedling development over a season. So, I agree that prior hurricanes would reduce the probability of future ones in the vicinity for at least a week or so.
It is actually rather ironic that the best way to perhaps make headway on this problem is through the use of an ensemble of global atmosphere-ocean coupled climate models at high resolution. A conclusive understanding or a “consensus” is at least a decade away or more.
Now that the season is over, WHO won the pool?
The SH cyclone season is off to a galloping start with TC Lee / Ariel in the S Indian, and Severe TC Guba in the Coral Sea.
TC Guba is particularly noteworthy, as it is rare indeed for cyclones to form in the Coral Sea prior to about mid to late December.
Re #322 John we’ll make it official on 30 Nov, when the official season ends.
Mann et al strikes again, this time “creating” a program that deals with a “reconstruction” of past hurricane records.
http://www.eurekalert.org/pub_releases/2007-11/ps-aop112107.php
I’m hoping Steve and the other smart guys here can take a look at Mann’s latest model (published in GRL) and evaluate for statistical validity. It’s sad, but I now get shivers every time I hear “Mann”, “model”, and “statistically significant” in the same sentence. I sense more “adjustments” to the historical record coming.
http://www.eurekalert.org/pub_releases/2007-11/ps-aop112107.php
The problem is, will he make his model available.
Second, when next year’s season doesn’t follow predictions, will we be told to forget it, and move along…
This will be an interesting test of “Lessons Learned” for the TEAM. Steve’s exposure of sloppy process and statistical navel-gazing in the papers of some TEAM members have been essentially ignored. What might make this different is that this new “reconstruction” is probably new ground with no hockey stick to defend (i.e., hopefully it has nothing to do BCP’s).
Will the TEAM’s model, data, and methodology be statistically sound and completely transparent? Stay tuned! (I’m bringing popcorn.)
So there’s actually two things here, correct?
1. Number of named storms. How many where there?
2. Total of ACE. What was its number?
And how close reality was to the predictions.
Re#326, I wonder what would’ve happened if the model were “trained” on tropical storm occurrence info from the 1970s – when “satellites were added to that mix” – to the present, rather than just 1944. Landsea doesn’t look at undercounting just pre-1944. Lansea’s 2007 EOS paper, “Counting Atlantic Tropical Cyclones Back to 1900,” asserts 1900-1965 is short 3.2 storms/yr and 1966-2002 is short 1 storm/yr. I wonder how Mann’s results would change if the model “trained” to Landseas 1944-2006 numbers.
The press release pulls-in an unrelated statement about anthropogenic warming, attributed to Mann only. This is followed by a more general commentary related to the paper topic on hurricane activity, which is attributed to “the researchers” collectively. Interesting.
I find this counter-intuitive:
If they trained the model assuming that pre-1944 hurricanes were undercounted by 3 (back in the days pre-AGW, when it was all “natural”), why would the model underpredict hurricanes? If anything, it should over-predict. The only reason I can think of why they would get this counter-intuitive result is if they over-weighted the relationship between storms and SSTs and/or underweighted natural variation influences. Accounting for an undercount of 3 back in “cooler” times would de-sensitize/flatted the relationship between storms and SSTs, which would mean that the revised model wouldn’t predict as many storms during warmer SSTs as the old one. If that’s the case, it would seem this is another instance where we see a circular relationship between results and input assumptions.
And it would seem that’s at least partially the case, as the release says:
I also don’t like the wording here:
So is that “approximately one tropical storm back to 1870” referring to 1.2 storms/yr prior to 1944, or did they take the pre-1944 undercount and average it over 1870-2006? At the least, it’s a poor phrasing.
Landsea and Mann have had some sparring over the undercount issue, this doesn’t seem apples-to-oranges with Landsea’s work.
My last comment: NOAA’s annual storm predictions have 3 key inputs, just as this model does. But the only one that is common to both methods is SST.
The Miami Herald 11/26/07
Hurricane predictions miss the mark
RE: #329 – As for “the count” according to the National Hurricane (Hysteria) Center, those who bet on the count exceeding the 150 year average “won.” Therefore, those arguing that over the long run, count is increasing, “won.” While some look at 13 storms and say “not a big deal” – when you look at how that effects the long term trend, it helps “make the case” for “killer AGW means more named storms.” I made my own bet knowing I would probably lose, once the count padders got involved. I made a bet that would have been “right” if bogus storms were not named and counted. My real bet behind the bet (my “hedge fund” as it were) was a behavioral observation. I picked my number based on a number of factors, most especially my educated guess that the impeding PDO shift and weakening AMO would probably kill the season. I picked a number in a way that, if the number was exceeded by “the official count” then it would tell me something about “the official count.” It told us that the official count no longer means anything and is a plaything of a specific effort to “prove” the “killer AGW and getting nothing but worse” case. Something had to be done to keep the hysteria of Summer and Fall 2005 alive. And so it was.
My challenge to Mann and Sabbatelli is to explain the patterns (the blue curves) they see on the following three plots:
Group 1 , which comprises 70% of all Atlantic storms, are those detectable from land. They either hit land or came close enough (within 100km) of land, including islands, to have been detected by landlubbers.
Group 2 , which comprises 30% of all Atlantic storms, are those that stayed at least 100km away from land throughout their existence. These were detectable only by ships prior to 1945.
Group 3 is a subset of 1 and 2, mostly 1. It is composed of storms which lasted 24 hours or less, which are both weak and small, making them historically quite hard to detect from land or by ship.
Group 1 cycles. Why doesn’t Group 2?
Group 1 increases slightly. Group 2 doesn’t start rising until recon flights start in the mid 1940s, then continues to rise even though SST are flat to declining. Why is that?
What is a natural explanation for the pattern of Group 3 (which also has a peculiar geographical distribution)?
I think that explanations are quite difficult unless one considers improvements in detection capabilities.
A hotel mogul here in Florida is threatening to sue Bill Gray for his continued blown forecasts. While getting the number of storms correct in the current era of technology does not impress me much, especially with several this year being the weakest in recorded history (Erin, Melissa, Jerry, Chantal, Barry, Andrea…), that large number count still frightens away tourists Potential Lawsuit for Gray?
While this threat is likely hyperbole, it does highlight the frustration and shortening attention span for alarmism — something the AGW-at-any-cost crowd should acknowledge. Thus, it is interesting that Bill Gray, who is not a fan of AGW-TC links and is hardly an alarmist, indirectly bolsters criticism of that link through his highly publicized seasonal forecasting.
Re:334
Ryan Maue
Said hotel mogul is picking the wrong target. It is the AGW alrmist contigent he should be aiming for, including their [unofficial] supporters at the NHC.
Having been involved in international financial risk assessment, my take-away is that forecasting only becomes meaningful and credible when being wrong actually entails tangible negative consequences.
It’s December 1, the end of the Atlantic hurricane season. That means it’s time to look at the 2007 contest results.
First, thanks to all participants for engaging in the effort. This was for fun.
The season saw 13 named tropical cyclones, which is the basis of the contest. ACE was a weak 68, well below the 94 average of the satellite era. By almost all measures, except storm count, the 2007 season was a bust.
No CA reader forecast 13 storms but we had four people miss by just one storm. They are:
Bob Koss (12)
jae (12)
Jonathan Schafer (14)
Staffan Lindstroem (14) (Staffan is a STAG (Swedish Tropical Advisory Group) member
Congratulations to these weather wizards! Over the holidays I’ll create a Certificate of Accomplishment for Bob, jae, Jonathan and Staffan which I can e-mail to you.
Coming close for one year in a row makes you eligible to publish in Nature. Good job, folks.
A graphic of the CA reader entries is here . As is evident, the CA team did well as an ensemble, missing the actual storm count by just one. I consider the ensemble to be an entry in the “institutional” contest, which is covered next.
The institutional results are here . The winner is IWIC (Independent Weather Information Center) who oddly seems to have either gotten busy or lost interest in the whole matter as their last full blog entry was August 14.
Honorable mention goes to Climate Audit Ensemble, Impact Weather and Accuweather, all of whom came within one of the actual count.
I think the real message of the 2007 season is that there’s so much that is poorly-understood about these things. To my knowledge no one came close to predicting a below-average ACE value or the other measures like storm-days. Some old-fashioned scientific caution among those making press releases and those writing for news organizations would be nice.
For 2008 I suggest a switch to ACE as the measure of the season, and a switch to forecasting categories (much below normal, below normal, normal, above normal and much above normal) instead of actual ACE values. That avoids the problem posed by weak systems and pus things in general categories, which is about as precise as any methodology will allow.
Again, thanks to the participants!
Sorry, I forgot to mention that Kenneth Fritsch’s entry is not yet in, Kenneth having chosen to wait until the season is over for his forecast to take a solid form.
Kenneth’s forecast depends on that of the Europeans, who won’t offer their 2007 forecast until 2008 or later.
Kenneth, if the numbers look good then there will be a special prize for your accomplishment.
I’m honored to find myself in such prestigious company as jae, Jonathan Schafer, and Staffan Lindstroem.
I cannot take credit for my success. I must attribute that to having stepped on the toes of giants. Along with regression toward the mean. 😉
I’ll notify my Swiss bank to expect delivery of the Certificate of Depo… err. Never mind.
SO my late entry of 13 storms is disallowed? Recount!
Moshpit wins!
http://www.climateaudit.org/?p=1082#comment-119901
So I was late, the dog ate my homework.
Still, david smith said it was asute.
13, well within my prediction interval, http://www.climateaudit.org/?p=1082#comment-99117 It was easy 😉
Next, prediction of global mean temp of 2012, conditional on CO2 and aerosol concentrations (at 2012).
Re: #340
Before forgiving Mosher’s tardiness, David, I would want to check whether or not he has peppered the threads with a number of different predictions just so he can link to a correct one after the contest ends. I’m not a stupid man you know.
My prediction is based on the average of KG’s 17 and Meteo-France’s prediction which, correct me if I am wrong, is an average of three European based predictions. I think the British 1/3 of that prediction was 10, so right now I am on line for 13.5.
If I were to win out in the end I think I would attribute that success to my great abilites to anticipate and discount the modern methods used to detect and count the Tiny Tims. I will offer Steve Sadlov and other persons showing need my methods for doing this.
If I lose I will either shut my mouth and forget that I ever made a prediction or point to reasons why my system failed this time in such an exceptional manner that it is likely not to occur again or at least any time soon.
This comment of mine is now two hurricane seasons old:
The positive 5th order PACs – if they are meaningful – suggest 2010 may be the season to watch, not 2006.
You are boldly implying that the Mayans were incorrect (i.e. that temperature may be the least of our worries!). 😉
Mark
Opening post says:
Got the script but was unable to locate the data files. http://data.climateaudit.org/scripts/hurricane/data/unisys/hurricane.tab didn’t work. Hints?
Steve: Updated versions at http://data.climateaudit.org/data/hurricane/hurdat/ . Sorry about the link. I re-arranged a little as more versions accumulated.
I don’t care who won. My little hedge fund, which successfully predicted the (mis) behavior of the National Hysteria Center (and suspected misbehavior of insurance companies) is awash in cash flow.
I am honored and humbled to be this close to the final tally.
I personally believe that the CA ensemble should receive the 2009 Nobel Peace Prize. Look at how bad things were in NO after Katrina. By our forecast ensembles, we are raising awareness of the dangers of hurricanes to humanity, which will help bring peace on earth. I’ll provide my bank deposit number for my portion of the check.
re 346. on the other side of the US.. sadlov what the heck is up with 129mph winds in Oregon?
That’s definately more than a 3 club wind.
Well, we now have Subtropical Storm Olga ( link ). Winds are minimal and expected to weaken within 24 hours. With some luck its ACE may approach 0.5 (a normal storm is 15 to 20 times higher than that).
Subtropical storms are not tropical despite their name and were ignored prior to 1969.
This gives us 13 tropical cyclones and 2 subtropical storms in 2007.
David
I cannot frigging believe that they have started naming thunderstorms!! There is no organization to it at all. I have been looking at it from the satellite view and it is no more than any thunderstorm in most any ocean anywhere. The storms coming down from Alaska had hurricane force winds before they came ashore. Are we going to start calling these things Artic Hurricanes?
Good figging lord.
Looks like subtropical storm Olga is already falling apart after having its 15 Minutes of Fame. Actually, it has had 540 minutes of existence, with the prospect for adding maybe another 360 minutes before dissipating.
Olga’s ACE will total about 0.4, based on current trends.
#349
A rare December named storm for the Atlantic: Olga
I love this line in particular..
OMG, it must be AGW (to which Master’s is a big subscriber). And if it were no threat to land in years past, it wouldn’t have had any attention paid to it at all, let alone be named. Ugh.
RE: #350 – Funny you asked. Be sure to check out the NHC (National Hysteria Center) West Coast Division, starting Jan 01, 2008. We have re written the rules. Things are going to be exciting! Maybe I can sell this product to Al Gore.
I have great respect for the US National Hurricane Center but my respect for them has diminished this season, due to their eagerness to name anything that rotates.
“If-U-rain,-U-get-a-name” seems to be the NHC 2007 motto.
I hope today’s recon flight found evidence of tropical basics, like a warm core, and didn’t simply rely on satellite appearance or windspeed in a small area of thunderstorms.
Earlier today I prepared a time series on subtropical storms, which is here . There are a couple of points to make:
1. Subtropical storms, despite their name, are not tropical. They have a different origin and structure than a tropical cyclone.
2. Prior to 1968 they occurred but were not recorded. They were ignored by the record-keepers. In 1968 the record-keepers started keeping a list.
It is wrong to include them in a multidecadal analysis that spans 1968, due to this change in record-keeping. However, inclusion happens, probably due to the 0.5 storm per year boost they give to those promoting a rise in storm count.
3. The multidecadal trend, if any, has been towards fewer subtropical storms.
Here’s the Certificate of Accomplishment honoring Bob, jae, Jonathan and Staffan for their uncanny ability to the 2007 hurricane season. The contest was to predict the number of named tropical cyclones in the period June 1 to November 30, which was thirteen. The named seers came closest among the contestants.
Special recognition goes to steven mosher (nailed it, but late), John A (who, with his low prediction, captured the reality of the season) and Ken Fritsch (who cleverly tied his prediction to the secret European forecast and may yet nail the number in reanalysis). And, special thanks to all who participated, as the CA ensemble did quite well.
In 2008 I suggest that we switch to ACE, to eliminate the count inflation caused by the micro-storms.
Quite impressive calligraphy. Were you born with a quill pen in your mouth? 😉
Thanks for the certificate David. I am honored and humbled to share this award with my fellow prognosticators.
Re: #356
Please consider this post my official concession to Bob, jae, Jonathan and Staffan with congratulations and acknowledgment of my deep respect for their predictive powers. Having closure for this very important contest should take precedent over any selfish interest I might have in holding out for a potential victory with the yet to be announced Meteo France results.
Depending on the positioning that those late to be announced results provide me, you may only get my noble and magnanimous concession speech above, or alternatively, as an even more magnanimous and nobler one, my prepared speech where the eventual winner (that would be me) selflessly conceded early for the benefit of the whole.
I don’t think I’ve ever seen a pair of DICE on an awards certificate before balanced against an image of Aristotle; LOL!
…Well…Pure cowardly (Thankyou, Noel “Only Mad Dogs and
Englishmen Go Out in the Midday Sun” Coward(Both lyrics and
music I presume…) And David next season is day of genesis
2008 Jan 1 until ding dong Dec 31 midnight so we can have
some extra festivitas remember Olga, remember Groundhog
Day Storm Feb 2 1952…SVT1 are in 4 minutes …excuse me
gotta…YES DVDRecorder REC…”Grondhog Day” (1993)
A fine little movie and Bill
Murray is just terrific and as another coincidence from
your favourite devil/moose/seer/groundhog SVT1 had BBC
“Hard talk” Stephen Sackur interviewing…YGI GORE/PACHAURI
Monday all week …we’re approaching the tipping point
said Gore and tried to look serious…PPP*/BBB/GMA
PompousPompousPompous/BorinBoringBoring/GiveMeAir…
Cute animal…,not Gore, the groundhog in the movie
played by “Scooter” So, he’s probably deceased now…
I download 2007 Groundhog day from Groundhog.org
2007 spring he predicted to be early…WELL, I don’t find
Punxsatawney on TuTiempo but Clearfield, Cold period started
Feb 3 …-7.5C one of 3 coldest Febs in last 50 years Check
Nasa-Giss Aaltona, only 1978 and 1979 had colder Februarys!
In short I’m no better in prediction of anything than
the Punxsatawney groundhog..Another coincidence that IPCC
released their Summary For Policy Makers from AR4 that very
day on the day 55 years after later named “Groundhog Day Storm” formed!! David SS or TS
OR HYBRID?? I concur/agree on ACE, then we can have average duration
and so on as separator…Happy Holidays everybody!!
So now in the end of 2008…ACE 33.3… Joking aside,
I see I missed “…cowardly…” ADD “beginner’s luck”
based on some other predictions I happened to see plus
pure intuition of course, either you have IT …or NOT
But Al Gore is mostly “vilse i pannkakan” “lost in the
pancake”…PS I think you can see Hardtalk on the BBC
website Shakur gives Gore/Pachaura some tough questions DS
STAFFAN, do not tell me you are groundhog day
fan! Someday I will tell you the funny story of
meeting Bill Murray on the street in Evanston Ill.
He was very kind.
The curse of living the same day over and over
( nietzches eternal return of the same)
is imposed when Murray claims to make the weather
# I have’n met Bill Murray yet but Torsten Flink…
Mosh but admit my comparing AGW nagging and monday
all week is fairly accurate… I mostly like Nietzche’s
music…2-3 cds…More later!! Gotta to breadwork now!!
re 364. HA STAFFAN! I am now given license to go Off topic.
As if Tangent man needed permission!
One day I am walking down the street in Evanston Ill. I was headed
toward the greek resturant for an afternoon Gyros and a pepsi.
It was Evanston version of Billy goat tavern.
No coke. pepsi.
So, as I head to get my gyros I pass Murray. I follow him.
He is wearing pink courderoy shorts with a very wide wale and
chomping a cigar.
He heads to the local tailor for a fitting. I interrupt
the measuring of the inseam and launch into immaculate Carl Spangler impersonation.
He laughed. So I asked for an autograph.
Murray: “sure, do you have a dollar?”
Moshpit: ” a dollar? that’s twice what your mom charges for a ….”
Then he put me in a headlock and gave me nuggies. I still have that dollar.
Good human he.
UPDATE! UPDATE! UPDATE!
http://nationalhysteriacenter.blogspot.com/2008/01/ts-alma-update-1800-z-03-jan-08.html
There is now some talk of a possible Cat 3!
http://nationalhysteriacenter.blogspot.com/2008/01/ts-alma-urgent-update-storm-surge.html
Well, Category 1 is a near certainty. Only mere hours away:
http://nationalhysteriacenter.blogspot.com/2008/01/ts-alma-hurricane-watch-0000-z-04-jan.html
Anyone ever try to swing the ol’ sampling bucket in 65 KT winds and 45 foot seas? Tough for some slacker to grab two puffs in that action … 🙂
A fast moving cold front and following trough have moved into California. It will be interesting to see what effect, if any, this has on steering currents. Anxiously awaiting the next update from the “NHC.”
http://nationalhysteriacenter.blogspot.com/2008/01/hurricane-alma-update-0241z-04-jan-08.html
Earrrrrrrliest everrrrrrr named storrrrrrrrm! Earrrrrrrrrliest everrrrrrrr NEPAC ‘cane!
We’ve named it, claimed it, and Category One’ed it! One down, many to go. 2008, predicted to be an unnnnnnnnnprecedennnnnnnnnnnnnnnted yearrrrrrrrr!
http://nationalhysteriacenter.blogspot.com/2008/01/alma-hurricane-warning-1745z-04-jan-08.html
Unnnnnnnprecedennnnted in a milllllllllllyun yearrrrrrrrrrs!
Unnnnnnnprrrrrrrrecedennnnnnnnnnted! (At my location, hundreds of miles from the eye, we incurred storm surge, flooding from rain, storm force winds and long power cuts. We were in the dark at my place for about 37 hours.)
Here was the scenario on the eve of the storm:
ALMA – **HURRICANE WARNING** – 1745Z, 04-JAN-08
THE NATIONAL HYSTERIA CENTER (NEPAC DIVISION) HAS ISSUED A HURRICANE WARNING FOR VANCOUVER ISLAND AND THE OLYMPIC PENINSULA. ALMA, A CATEGORY ONE HURRICANE, IS EXPECTED TO MAKE LANDFALL IN THE WARNING AREA WITHIN THE NEXT 18 – 24 HOURS. SUSTAINED WINDS IN EXCESS OF 65KTS, HEAVY RAINS, FLOODING AND A SIGNIFICANT STORM SURGE CAN BE EXPECTED. ALMA CURRENTLY HAS A DUAL EYE STRUCTURE – 958 MB AT 44N, 135W, AND, 950MB AT 48N, 134W. OCCLUDED MAJOR FEEDER BANDS SPIRAL OUT, TRANSECTING CENTRAL WESTERN BRITISH COLUMBIA, CENTRAL WASHINGTON STATE, CENTRAL OREGON, MT. SHASTA, SACRAMENTO, THE FAR NORTHERN BAY AREA AND BACK OUT TO SEA. THIS TROPICAL CYCLONE IS UNPRECEDENTED IN A NUMBER OF WAYS. EARLIEST EVER NAMED STORM IN NEPAC. EARLIEST EVER NEPAC HURRICANE. FARTHEST NORTH NEPAC HURRICANE. UNPRECEDENTED IN PERHAPS A MILLION YEARS. EOT. HAY-MANN.
Name it, and claim it:
http://nationalhysteriacenter.blogspot.com/2008/01/typhoon-hagibis-0229-z-08-jan-08.html
On a roll here. Soon to be, Hurricane Hagibis. This will be a great “dumb ships” storm.
Two and counting! And both thus far are ‘canes!
http://nationalhysteriacenter.blogspot.com/
Hey Boris, looks like the “NHC” named one after you!
http://nationalhysteriacenter.blogspot.com/2008/01/tropical-storm-boris-2140z-10-jan-08.html
Count it and shout it.
Wow! We’ll be at 4 soon out here on the Left coast. Setting a whole new … precedent … for naming and claiming:
http://nationalhysteriacenter.blogspot.com/
And please do realize, we’ve got lots of dumb ships out there on the Pacific – crashing into bridges, etc … 😆
HURRICANE BORIS – 0144Z, 11-JAN-08
BASED ON DVORAK, AND, A WIND REPORT FROM A DUMB SHIP, WE RAISE THIS FEATURE TO A CATEGORY ONE HURRICANE. ESTIMATED MAXIMUM SUSTAINED WINDS 65 – 70KTS, CURRENT LOCATION OF EYE IS 160W, 38N. CENTRAL PRESSURE WE’D RATHER NOT DISCUSS. FEATURE IS PROG’ED TO CONTINUE TO DRIFT ESE, WHERE, IT EVENTUALLY COMES UP AGAINST NOW FORMING SLOWLY PROGRESSIVE RIDGE. FROM THERE, TRACK AND LIKELY DEVELOPMENT ARE NOT RESOLVING WELL WITH MODELS. NONETHELESS, WE ARE NOW AT THREE HURRICANES OUT OF THREE NAMED NEPAC STORMS, AND WE HAVE YET TO COMPLETE SECOND FULL WEEK OF JANUARY. UNPRECEDENTED. EOT. FORECASTER – SCHMID-TRIGGER.
This just in:
GEOPHYSICAL RESEARCH LETTERS, VOL. 35, L02708, doi:10.1029/2007GL032396, 2008.
Global warming and United States landfalling hurricanes
Chunzai Wang and Sang-Ki Lee
“This paper uses observational data to demonstrate that the attribution of the recent increase in Atlantic hurricane activity to global warming is premature and that global warming may decrease the likelihood of hurricanes making landfall in the United States.”
Here is my review on the Wang et al. paper
Wang et al. finds that wind shear in the tropical North Atlantic is decreasing
slightly since 1950, and they associate this with a small (and statistically
insignificant) decrease in U.S. landfalling hurricanes since 1851. They further
find that the spatial distribution of global ocean warming determines this small
decrease in North Atlantic wind shear.
This paper has several significant flaws. First, the magnitude of the trend in
wind shear found is really quite small, about 2 m/s, and they do not even
establish the statistical significance of this trend. This magnitude of wind
shear decrease is too small to do anything more than reduce the hurricane
intensity by a very small amount. A change of at least 5-10 m/s in wind shear
would probably be needed for a significant change in tropical cyclogenesis. The
second problem is that U.S. landfalling hurricanes are a poor proxy for total
North Atlantic hurricanes (ranging from 10-90% of the North Atlantic total), and
a much worse proxy for global tropical cyclone activity (U.S. landfalls are only
about 3% of the global total). Several years ago, we refuted the argument about
using U.S. landfalling tropical cyclones to infer anything about global tropical
cyclones or even North Atlantic tropical cyclones; it is very dismaying to see
this argument being used again. Third, the link between wind shear and the
number of U.S. landfalling hurricanes is never actually made in any quantitive
way; they only note the existence of both weak downward trends.
This paper does not refute in any way the IPCC findings regarding changes in
tropical cyclones with global climate change. This paper extends several other
recent papers purporting to find a small decrease in wind shear that they
attempt to link to a reduction in Atlantic hurricane activity. But this small
decrease in wind shear would have a miniscule impact on the hurricanes.
The focus of research on the link between global warming and hurricanes has been
an increase in hurricane intensity, particularly an increase in the most intense
hurricanes. The IPCC 4th assessment report states:”There is observational
evidence for an increase of intense tropical cyclone activity in the North
Atlantic since about 1970, correlated with increases of tropical sea surface
temperatures.” There is nothing in this study that refutes this main finding
from the IPCC on hurricane intensity.
Hi Judy- Happy 2008!
Here are a few more papers that I am sure readers would appreciate your experts reviews of:
http://www.blackwell-synergy.com/doi/full/10.1111/j.1539-6924.2007.00984.x
Click to access hurricane_all.pdf
381 (Judith): “This paper has several significant flaws.”
Are we to infer that GRL’s peer-review of this paper has failed? If so, that is unlikely to be an isolated occurrence. In your estimate, what percentage of peer-reviews are failures?
Leif, alot of things make it through peer review that don’t stand the test of time, or scrutiny by a broader group of peers. Re GRL, in the past year they seem to have become more nature/science like; looking for the hot topics with broad appeal and potential news impact, and erring on the side of letting “interesting” papers on hot topics through the publication process. In a field that is relatively new (like the hurricane/global warming topic), there will be a lot of back and forth before things settle down (andy revkin calls this the “windshield wiper effect”.) the bottom line is that we have pretty much beat the north atlantic and U.S. landfalling time series data set to death; the datasets are flawed and need to be improved and a rigorous uncertainty analysis is needed. We also need some fundamental physical mechanism research (not just statistical analysis) to be done. And finally, we need more high resolution model simulations. Progress is moving along on this topic. It is important to put each new paper into the context of the broader picture of what we know and what we don’t know, to minimize confusion on the topic, which is what I am trying to accomplish when i write these type of public reviews. These are of course my opinions, but I put the arguments out there for people to consider.
Re: #383
I see a lot of talking past each other, albeit in the polite parlance of scientific discussions, and no discernible movements away from earlier positions. You have expressed some noble wishes that in the real world and from my perspective are still only in a list somewhere.
Judith Curry (#383),
Have you read any of the Exponential Growth in Physical Systems
thread (under modeling)? Increasing the resolution in numerical models based on the hydrostatic or nonhydrostatic systems is not going to solve
anything. In the former case the continuum system is ill posed
for the initial value problem (this has been proved mathematically
and demonstrated numerically on the above thread). In the latter case there is fast exponential growth in the continuum system that will destroy the accuracy of any numerical solution in a very short period of time (on the order of hours, not years).
Your community continues to ignore basic mathematical problems
with the dynamical cores, i.e. numerical approximations of the unforced continuum systems, even before any tuning (ad hoc, inaccurate forcing) is added.
Jerry
Judith Curry (#383),
I would like you to post a review of the recent benchmark tests of four different dynamical cores.
Jablonowski, C. and D. Williamson, 2006.
A baroclinic instability test case for atmospheric model dynamical cores.
Q. J R. Meteorol. Soc,
132, pp 2943-2975.
I would also like to see a review of the article by Roger Pielke Jr. and Sr. (the latter is an “expert” in meteorological mesoscale models).
I will add my comments to these reviews so the general reader can judge
these models based on the reviews.
Jerry
Jerry
Judith Curry (#383),
I would like you to post a review of the recent benchmark tests of four different dynamical cores.
Jablonowski, C. and D. Williamson, 2006.
A baroclinic instability test case for atmospheric model dynamical cores.
Q. J R. Meteorol. Soc,
132, pp 2943-2975.
I would also like to see a review of the article by Roger Pielke Jr. and Sr. (the latter is an “expert” in meteorological mesoscale models).
I will add my comments to these reviews so the general reader can judge
these models based on the reviews.
Jerry
Ignore 386 (double signature).
I’ve asked one of the authors for a copy of the paper.
Judith may have meant “knots” instead of “m/s”.
I have read the papers mentioned by Roger and Gerald some months ago. I won’t have time until possibly this weekend to reread and write reviews.
p.s. there was a debate on this topic at the American Meteorological Society meeting, i’m sure much of it is online somewhere, maybe Roger can track it down. I understand there were some Landsea/Holland “fireworks”, other panelists were Kerry Emanuel, Johnny Chan, Tom Knutson. Definitely the usual suspects. But all agree both natural climate variability and global warming is involved (disagreeing on whether we are seeing signal of global warming now, or our grandchildren will see it), all agree that there are some problems with the data (disagreeing on how far back the reliable measurements of various parameters go).
Hi Judy- William Briggs posted up a summary of the session here:
http://wmbriggs.com/blog/2008/01/22/ams-conference-report-day-2/
Gerald- Thanks for the invite, but the paper is not in my area of expertise. On the hurricane debate more generally I did post up this opinion recently:
http://sciencepolicy.colorado.edu/prometheus/archives/climate_change/001307endof2007_hurrican.html
Regarding Wang et al, and the relationship between hurricanes and wind shear…
From wikipedia http://en.wikipedia.org/wiki/Atlantic_hurricane:
August: “Decrease in wind shear from July to August produces a significant increase of tropical activity…”
September: “The peak of the hurricane season occurs in September and corresponds to low wind shear [5] and the warmest sea surface temperatures[6]…”
October: “The favorable conditions found during September begin to decay in October. The main reason for the decrease in activity is increasing wind shear, although sea surface temperatures are cooler than in September…”
So it would seem low wind shear is associated with increases in activity. I’m not sure if they are specifying horizontal or vertical. There seem to be recent studies (Vecchi et al in GRL in ’07, for example) which associate warmer temps with increased vertical wind shear, decreasing hurricane frequency and intensity.
Maybe I need a primer course on ‘canes.
Jeff Masters offers a “tutorial” on wind shear and tropical cyclones here .
The paper referenced in #379 isn’t in print yet, per one of the co-authors, but he kindly offered to provide a copy once it is released.
Post #380 is hard for me to understand.
A decrease in windshear directionally favors intensification, not reduce it. I wonder if the words “increase” and “decrease” have been confounded in #380.
Regarding the magnitude of any detected change, climatological average values of Atlantic windshear are here . The shaded regions are where, on average, windshear is low enough to support tropical cyclone formation and intensification. Note that the shading begins at about 9m/s (roughly 20 knots). If the paper found a change of 2m/s (20% change), that would be big enough to noticeably change the coverage of the lightly-shaded (marginal) and darkly-shaded (more-favorable) regions, which would directionally affect both formation and intensification.
Looking at the maps, the genesis regions are in the 4 to 9 m/s range, so a 5 to 10m/s change (either direction) in the averages would be “profound”.
So, I think I’ll have to read the paper to be able to make sense of it all.
typos in original message: wind shear INCREASE decreases hurricane intensity
395 (Judith): in which message?
RE 395… Thanks for the correction.
Re: #391
Instead of looking at the many clues available for changing detection capabilities of NATL TCs over the long term and discussing them, I see off-handed assertions for and against theories/conjectures – and always from a very predictable POV. As in your comment above and your review of the Wang paper, the devil is in the details.
Re: #394
Thanks, David , for the details on wind shear as it certainly puts Dr Curry’s review/comments in a different light.
Roger Pielke Jr. (#392),
I find your statement that this manuscript is outside your area of expertise rather humorous. How can you be involved in scientific policy debates about climate change and not have any understanding of the problems with climate models and their predictive skills. Do you not talk to your father about these issues given that he is very aware of the
shortcomings of both short term NWP and climate models? Frankly, this is the kind of response (dodge) I expected from you. You might ask Pielke Sr. to comment on the manuscript if you are not competent to do so.
Jerry
Judith Curry (#390),
I look forward to your review of the cited manuscript. Pielke Jr. has already backed out citing that the manuscript is outside his area of expertise. You would think he might want to learn more about such areas, especially when the area has such an important impact on the climate change discussion and IPCC reports. I have asked him to see if his father (who wrote a book on mesoscale NWP models) will provide a review, but don’t hold your breath.
Jerry
#401 I’m sure he does. But, in fairness, you’re asking him to teach, not learn.
RE 402. Bender, how much would you pay to watch, browning, curry, pielke sr, and vonk
mix it up?
14000 quatloos. 10000 on the math guy.
I’ll see your 14000 and raise you 10000, my ante up all on the math guy. So now, 24000 on the math guy.
Sorry, I’m no math guy, 20000 on the math guy … 😆
A 500q penalty for each instance of evasive behavior should help keep math guy in check.
lucia shall referee.
re 405. Can we chum the water with Sod or Jea?
Just kidding. We need to give odds on Dr. G. … or how about we throw Lucia into the fight.
She’s sharp and firey, like a jalepeno jack cheese.
40K quatloos on the math guy still, although judith will try to score monkey points at the periphery of
the debate.
Who’s the math guy?
re 409. bender pistol whip him, he’s my friend and I cant’t bear to see him bleed.
he’s the guy with exponential growth in his physical system
Interesting to see that i am so underestimated . . . mistake 🙂
Judith, mosher’s estimates are always biased low. Me, I’m a little less certain. 🙂
All,
Hopefully the reviews of the manuscript will be instructive to everyone, not only relative to the peer review process, but also with respect to numerical approximations of the basic dynamical systems (dynamical cores). 🙂
Jerry
414: the paper [hurricanes in US] hit “USA Today” and Physorg Newsletter http://www.physorg.com/news120288381.html
RE 412. Ha! my ploy worked. I’ve got side bets on the GT yellow jackets bender!
Seriously. Dr Curry you do tend to angle toward the margin of the debate like
Bender the uncertain. Just sayin.
50,000 Quatloos on the science guy whose father couldn’t think of a new name. The rude math guy is overcompensating for something.
Gunnar, are you sure you’ve earned that many quatloos? mosh, check his balance …
🙂
1. The math guy has an axe to grind because he is right, his close associates are right, and many others in the mainstream are wrong, yet are in positions of power, and are moreover slighting his associates.
2. He’s not “rude”. He’s “retired”. Get PC here.
3. He is occasionally patronizing, but he is also paternalistic – in a good way.
🙂
Raise 10000 on the math guy. His laser like focus will burn through the yellowjacket smokescreen.
Math guy all the way. Science Guy and hornet that nests in ground know it, too.
That’s why it won’t happen.
But if it does, I’ll hock my space ship to go all in on the Math Guy.;-)
If the peer-reviewed literature is that easily refuted, does that mean we’ve crossed a tipping point in terms of relevance of print vs. blogosphere? When will we know we are there?
421 (bender): ‘peer-review’ -> with electronic publishing there is no cost issue with appending the review to the article. In my view, the reviewer’s comments and the whole correspondence around the submission/revision/acceptance of a paper should be public and transparent as the paper itself. This will show other people what due diligence the reviewer did and allow the readers to access the process.
The blogosphere contains too much ‘chatter’ and spewing of trolls to be yet a good substitute. The moderator should be much more diligent in removing the fluff [like the last 20 comments or so].
1. That’s very progressive of you. Nice to hear.
2. Chatter? Aw c’mon, a little fun once in a while. The quatloo thing above is a backhanded reference to a blog system that mosher proposed whereby you “pay” to see comments, and you are “paid” to generate comments. If no one pays to see your comments, you quickly go broke and are marginalised in the discussion. It would heavily constrain troll chatter such as the above. Chattering about a system to reduce chatter is called ‘irony’.
If you can’t have a little fun every now and then, what’s the point of getting out of bed in the morning?
Well, the greatest challenge we face is in identifying and quantifying uncertainties; this is essential for decision making (not to mention scientific progress). There is too much black and white, big consensus lists on both sides, etc. we have to dig into the complexities, there are no simple answers (only simple “explanations” that are almost certainly incorrect), and this is why I have much more interest in the whole “climateaudit” concept than do many of my peers. So the Curry/Bender axis (good grief!) of this little debate is the one that won’t score the simple quick points, but will prevail in the longer term by pointing this in the right direction.
If you really read the IPCC 4th Assessment Report, Summary for Policy Makers, it is a very conservative document. For example, here are the summary statements on hurricanes:
“There is observational evidence for an increase of intense tropical cyclone activity in the North Atlantic since about 1970, correlated with increases of tropical sea surface temperatures. There are also suggestions of increased intense tropical cyclone activity in some other regions where concerns over data quality are greater. Multi-decadal variability and the quality of the tropical cyclone records prior to routine satellite observations in about 1970 complicate the detection of long-term trends in tropical cyclone activity. . . Based on a range of models, it is likely that future tropical cyclones (typhoons and hurricanes) will become more intense, with larger peak wind speeds and more heavy precipitation associated with ongoing increases of tropical SSTs. There is less confidence in projections of a global decrease in numbers of tropical cyclones. The apparent increase in the proportion of very intense storms since 1970 in some regions is much larger than simulated by current models for that period.”
For reference, very likely implies greater than 90% chance, likely implies greater than 66% chance, more likely than not implies greater than 50% chance.
I haven’t seen any new science in the last year that would seriously challenge the IPCC statements.
re 245 (Psst. I’m a benderite too) I’m just trying to tout what I think would be great
convo betwixt you and Dr. B.
Re: #425
The IPCC excerpt gives a very generalized view of TCs, essentially confines the comments to the NATL, says nothing about the Kossin 1980s to present reanalysis and the conclusion that globally intensity and frequency has not increased during that time period, says nothing about decadal frequencies that might have had the 1970s at a minimum and the present at a maximum and implies that detection capabilities have been essentially unchanged since the 1970s. I suggest that it was written by a prevailing majority in this area of climate science and is not very comprehensive with regards to other POVs.
Since you have put some apparent stock into this IPCC statement and have stated your own concerns with the need for spelling out uncertainities in these matters, perhaps you could reveal the manners and methods by which this particular AR4 group determined the likely probability (66% or greater).
I have noted previously at CA that the AR4 states that the groups are to have a documented paper trail in how each individual group determined their probability levels. Upon requesting a record of this documentation, I received no reply.
425, a big part of the problem, I think, is people want to fit the question into one sentence or less, and state their positions with similar brevity. Someone here whom I have a lot of respect for says repeatedly “I think AGW is probable”. I wince every time I read that, because it’s not yes/no, so “probable” doesn’t apply. Unless we’re all willing to take the time to express positions more precisely, all we’re going to get is more of this meaningless talk that doesn’t lead to clarity. And building the uncertainty into the question and into the answers is necessary to get that kind of clarity.
RE: “I haven’t seen any new science in the last year that would seriously challenge the IPCC statements.”
That’s because the most challenging science is not as recent as that, it’s now going on 5 years of age. The more recent science done along these lines is building upon it and is therefore not “new.”
Re#425, that is certainly more conservative than the rhteoric of many folks.
On a side note is interesting to me that the IPCC would say, “larger peak wind speeds.” The use of “larger” in that instance would seem like a layman’s way of saying stronger, more intense, etc. I can see why “higher” would be avoided because of the possible confusion with altitude. But “larger?” I don’t think I’ve ever heard anyone use the term “large” with reference to wind (other than to say, “large wind turbine,” or possibly “winds larger in magnitude than ___ mph”). But maybe that’s just me? A google search seems to just pull up website after website quoting the IPCC. If the author/authors demonstrated themselves to be unscientific using this terminology, how much confidence should I have when it comes to their probabilities?
Kenneth,
The Kossin/Vimont analysis was considered in the IPCC assessment. First, EVERYONE agrees that there has been no increase in the global number of tropical cyclones, this was clearly stated in Webster et al. 2005 Science. Second, the IPCC statement on intensity increase is restricted to the period since 1970 and in the North Atlantic, where the intensity data is judged to be most reliable. Kossin and Vimont objectively raised the issue of uncertainty of the intensities outside the North Atlantic, but their published study is not the last word in intensity. Global intensity analysis is contininuing to be refined, and Kossin/Vimont are important players in this.
With regards to the details of the IPCC process, i was not personally involved in the IPCC assessment in any way, and others will have to address the issues you raise about documentation. I can only state that in my assessment, their statements are credible and appropriate, based upon the available scientific evidence the level of certainty associated with it.
430 Michael
I believe that you are erecting a strawman. The statement is that the wind speed is larger, which is fine (although I would prefer ‘greater’, myself).
430 Michael
I believe that you are erecting a strawman. The statement is that the wind speed is larger, which is fine (although I would prefer ‘greater’, myself).
More on hurricanes:
The venue for the 88th annual meeting of the American Meteorological Society could not have been more conducive to the discussion: The Ernest N. Morial Convention Center is where thousands of people waited for days during the storm to be evacuated from a city drowning in water and misery.
Although weather experts generally agree that the planet is warming, they hardly express consensus on what that may mean for future hurricanes. Debate has simmered in hallway chats and panel discussions.
A study released Wednesday by government scientists was the latest point of contention.
The study by researchers at the National Oceanic and Atmospheric Administration’s Miami Lab and the University of Miami postulated that global warming may actually decrease the number of hurricanes that strike the United States. Warming waters may increase vertical wind speed, or wind shear, cutting into a hurricane’s strength.
The study focused on observations rather than computer models, which often form the backbone of global warming studies, and on the records of hurricanes over the past century, researchers said.
“I think it was a seminal paper,” Richard Spinrad, NOAA’s assistant administrator for Oceanic and Atmospheric Research, said Wednesday.
“There’s a lot of uncertainty in the models,” Spinrad said. “There’s a lot of uncertainty in what drives the development of tropical cyclones, or hurricanes. What the study says to us is that we need a higher resolution” of data.
Greg Holland, a senior scientist at the National Center for Atmospheric Research, said the new paper was anything but seminal. He said “the results of the study just don’t hold together.”
Holland is among scientists who say there is a link between global warming and an upswing in catastrophic storms. He said other factors far outweigh the influence of wind shear on how a storm will behave.
“This is the problem with going in and focusing on one point, a really small change,” Holland said.
He had a sharp exchange Monday with Christopher Landsea, a NOAA scientist, during the AMS meeting.
While Holland sees a connection between global warming and increased hurricanes, Landsea believes storms only seem to be getting bigger because people are paying closer attention. Big storms that would have gone unnoticed in past decades are now carefully tracked by satellites and airplanes, even if they pose no threat to land.
The exchange, captured by National Public Radio, illustrates how emotional the global warming debate has become for hurricane experts.
“Can you answer the question?” Landsea demanded.
“I’m not going to answer the question because it’s a stupid question,” Holland shot back.
“OK, let’s move on,” a moderator intervened.
The passion was no surprise to the TV weather forecasters, academic climatologists, government oceanographers and tornado chasers attending the meeting.
“One thing I’ve learned about coming to this conference over the years is that very few people agree on anything,” said Bill Massey, a former hurricane program manager at the Federal Emergency Management Agency.
“There’s a legitimate scientific debate going on and a healthy one, and scientists right now are trying to defuse the emotion and focus on the research,” said Robert Henson, the author of “The Rough Guide to Climate Change.”
Whether global warming is increasing the frequency of major storms or reducing it, Henson said, lives are at stake.
“Let’s say you have a drunk driver once an hour going 100 miles an hour in the middle of the night on an interstate,” Henson said. “Say you’re going to have an increase from once an hour to once every 30 minutes; that’s scary and important. But you’ve got to worry about that drunk driver if it’s even once an hour.”
Massey agreed. “In 1992 we had one major storm. It was Hurricane Andrew. It was a very slow year. But one storm can ruin your day.”
Re: #431
Kossin, Knapp, Vimont, Murnane and Harper found in their reanalysis linked below that the globally averaged (including the NATL trends in the global average) PDI and frequencies had little or no trend since the 1980s and that is in opposition to what the results showed without reanalysis. I would assume that their findings or any other climate scientists’ findings are not the last word or are never the last word, but that really is so general of a statement as to appear to be more of a throw away line than leading to insights on the merits of their works and comparing it to other’s countering data and analyses.
Click to access Kossin_2006GL028836.pdf
This statement is interesting in view of your concern for determining (objective, I assume) uncertainties of the findings in climate science. I take it you are saying that you generally agree with what the IPCC said, but that says little about any objective uncertainty in the results they report. It means little more to me than had this AR4 group done their probabilities by a show of hands, that yours would be up.
50,000 Quatloos to any NPR listener who can report what Landsea asked Holland. This could be fun.
Landsea’s question was something like this (he was on about data quality in the earlier part of the record):
If Hurricane Felix occurred in 1950, how would you have classified it? Cat2? Cat3? Cat4? Cat5?
Holland gave the appropriate reply.
50K Q, please
Why is that a stupid question?
Refusing to answer questions that make you uncomfortable is not a great debating technique. Which is why my Quatloos will not be on the Hornet.
I would have classified it as a Cat 2. But, the “NHC” NEPAC Division would have classified it as a Cat 6.
No answer might have been a good alternative to a stupid answer.
Thanks, Judith, for the answer. The 50,000 Quatloos are being teleported to your bank account as you sit 🙂
To answer Landsea’s question would require Dr Holland to
1. know how hurricane measurement techniques have changed and
2. know some detail about a famous category 5 storm which occurred 19 weeks earlier (September 2007)
which, I agree, is expecting a lot from Dr Holland.
A better response than “stupid question” would have been to say that he did not recall the details of Felix but suggest that they each write, and send to the moderator for public release, an e-mail answering the question, within say two weeks.
The substance of Landsea’s question is actually quite good and I’m interested in how Holland would answer it. Felix was a very small, short-lived hurricane last September which was vexed with intensity measurement problems. Surface measurements were sparse while the recon and satellite often gave conflicting indications.
In 1950 the recon flights into a small, intense, remote (from the US) storm would have been perhaps one a day and would have been quite difficult for the craft of the era. Had the 1950 aircraft been able to penetrate the eye at maximum intensity and measured the 929mb minimum pressure I would bet that would have been categorized as a category 4 storm, not a 5. Had the flight occurred 8 hours earlier, or later, it would have been about 950mb, which would indicate a category 3.
For familiarization purposes I offer the Felix windspeed estimate plot from the NHC storm report . The green line follows the offical wind estimate while the red lines show the range of key intensity data available to the analysts. On the left side I lined through, in blue, the measurement techniques unavailable in 1950. In 1950 there were both fewer techniques and there likely would have been fewer data points using the then-existing techniques.
I think it would have been a roll-of-the-dice as to whether Felix was a category 3 or 4 or 5 in 1950.
Why did the interviewer ask to move on?
Re #442
should be
this is from Figure 3 in the report.
Re #443 My guess is to diffuse the emotions.
Perhaps. But there are other possibilities: to rescue Holland from having to defend his insult and further expose his boorishness; or, to prevent Landsea from elaborating on the question in such a way as to illuminate its relevance to the discussion.
I’m wondering what Holland would have said if challenged to explain why the question was “stupid.” Perhaps Dr. Curry can enlighten us, since she has opined that his characterization of the question as “stupid” was an appropriate response.
Hmmm, couldn’t you manage to teleconnect the Quatloos?
Leif (#422),
I am in complete agreement with the first part of your comment
and even suggested a similar idea to the American Meteorological
Society. Of course the standard response is that a reviewer might
not want the author to know who he or she is. The humorous thing there is
that all of the reputable reviewers tended to sign the reviews
of our manuscripts, e.g. Bennert Machenauer, even when the results were
not in complete agreement with some of their work. IMO this is how a
reputable scientist should behave. On the other hand, the reviewers
that tended to be slime balls did not want the authors to know who they are so they could kill a manuscript for political reasons and not scientific
ones. If the reasons are valid scientific ones, why is the reviewer not willing to stand up for their supposed scientific case? I think the answer is obvious.
Note I also suggested that reviewers be chosen randomly from
a pool familiar with the area so that a less than impartial Editor
couldn’t play games. Of course this could be done by a secretary and the votes counted by anyone (that is all many of the Editors did, i.e. they would refuse to override bad reviews).
I have very specific examples of all of the above problems and IMO
these problems are the root of problems with the peer review system.
Jerry
David Smith (#442),
I continue to be impressed by your rationality.
Jerry
Also fully agree .
The answer of Holland was at best ignorant and at worst insulting .
In both cases it doesn’t witness a very respectable personality .
Saying I don’t know is the appropriate response when you don’t know the answer. Declaring that you won’t answer because the question is stupid, is never the right answer.
Well, yes and no. I’ve certainly asked stupid questions. In this case the question was not stupid, in fact it was too good to be answerable immediately, which would have been a better response.
==========================
David, your reasoning about the answer to the Landsea question has a logical fallacy: fallacy of the distribution of the divisional type.
This fallacy occurs when an argument assumes that what is true about the group is also true of the individual members. So if we assume that there are random errors in assessing the historical hurricane intensity record, that does not that the average error (or even any error) characterizes a particular hurricane. This is the same fallacy as saying global warming made hurricane katrina more intense. If the argument is correct that global warming is increasing average hurricane intensity, you cannot attribute the intensity of any one storm to global warming.
#453, excellent critical thinking. 20k Quatloos on Judith Curry.
Kenneth, #435 you miss the point of an assessment. An assessment is a process whereby all of the evidence is put on the table, it is assessed by a broad range of experts. No single paper is likely to change an assessment much. And an assessment would not go beyond what the original author said. for example, Kossin/Vimont’s paper says “However, it is presently argued that existing global hurricane records are too inconsistent to accurately measure trends.” This was exactly what was reflected in the IPCC report.
Yes, there are indivduals who would have gone further than what the IPCC says, e.g.
Holland would have said there is an increase in the number of NATL tropical cyclones
Emanuel would have said there is an increase in PDI since 1949 in the NATL and WPAC
Gray would have said (oops i’m not going to go there)
etc.
But the point of the IPCC statement, and the process, is that everybody can agree with the statements that were actually made (even if individuals would have liked to have seen other statements added). So if the community of researchers addressing this problem agree on the accuracy of the statement, is there any real point to saying the statement is wrong, inaccurate, or whatever? People can tilt at windmills, but this statement is appropriate and accepted by the broad community doing research in this area. Further, the wording was very carefully crafted so as not to mislead.
With regards to the process whereby the exact words were crafted in the summary for policy makers, it was an ugly where the U.S. delegation of policy makers was trying to downplay any possibility of a global warming/hurricane link. I don’t know if this is documented anywhere (personally I would love to see this, i only heard about it via phone calls i recieived from people actually in Paris at the meeting), but the Lead Authors of the IPCC report effectively fought to have the scientific process determine what is in the report, rather than U.S. policy maker sensitivity owing to Hurricane Katrina.
Re #453 Judith the issue is sampling, specifically the impact of changes in sampling techniques and frequency. Hurricane Felix is used to illustrate the matter.
Hurricane intensity varies, and in the case of Felix it varied rapidly (see graph). If one uses sparse (1950s frequency and aerial extent) sampling then the chance of capturing the peak is reduced.
That’s a systematic, not random, problem, and would occur whether the system being sampled is a hurricane or, say, interstate traffic .
David #456
In principle I agree with you and I do believe that the shifts in observational methods in general makes it hard to compare data from before 1970 to that after 1970, but isn’t Felix – aside from the fact that it had a short duration with extremely low pressure/high winds – a poor illustration of the point since according to the report it was hurricane strength when it went ashore? Couldn’t this type of Hurricane have a higher likelihood of having a land strike?
Holland’s response does seem to be excessively defensive and rude, as opposed to a “I don’t understand the question” or the more abrupt “What is your point?”. Perhaps they don’t like each other? 😉
I have noticed that many members of the team get agitated and defensive when asked to defend their positions. Such as Gavin declaring that even debating with a skeptic would give them more attention than their opinions deserve.
Steve: please move this to Unthreaded.
453, a.k.a the ergodic assumption.
Dr. Curry,
You say.
Why would random error be assumed? It appears to me the majority of errors are non-random and equipment based.
Looking from the surface in perfect daytime visibility. At a distance of 120nm you would not see any clouds lower than 11,000 feet. The clouds around the eye of a storm can rise to 50,000 feet. But the greater surface area of a storm is below 25,000 feet. To me that seems a very important point in what has been recorded pre-satellite era. Especially when darkness would require you to be in the storm to record it. Satellites have increased observations to effectively 24/7 in a 1,500nm swath. Quite a non-random difference in observational ability.
Then there is the problem of equipment destruction. Wind recording equipment such as anemometers didn’t malfunction randomly, it did so usually under high wind stress. You can’t record peak winds when the equipment malfunctions at lower than peak wind. Satellites don’t have to be in the storm to observe it. Quite a non-random difference in the rate of malfunction.
Consider that all 1950 records were over a span of less than 2.5 months, had 20% more 64kt+ tracks than 2005, and is still second in recorded ACE. The 2005 season took 7 months to just exceed that value. Should people hang their hat on the idea that 2005 was outside the bounds of what is possible without the GW effect?
I won’t speculate on what 1950 would have looked like if satellites had been in use at the time. I do think the difference would be non-trivial.
Hornet approach:
we have beat the observational data to death and sliced it six ways from sunday. And
we mostly agree in some kinda correlation between hurricanes ( increased numbers, or
increased intensity, or increased landfalling, or increased damage) and Global warming.
Now, it’s time to move onto the topic of actualy building models to understand this correlation
better, do the physics thing.
Correct me DR. Curry If I got that thumbnail sketch wrong. ( it’s cartoon of sorts, so cut me some slack)
On the other side We have folks still beating the dead horse of observations. (Flicka’s not
dead yet in my view, but never mind me.)
They are actually doing you a favor, and just delaying your match versus Dr. Browning.
Hehe. that’s the one I’m paying to see.
Climate science needs a Don King.
Re #457 Morning, bernie. I suspect that the point Landsea was trying to make is that a category 5 storm like Felix may, or may not, have been reported as a category 5 in earlier years, due to the limited sampling of the earlier era.
There’s no doubt that it would have been registered as a hurricane but perhaps not as a 5, due to limited sampling.
(As a side note, Felix was so small that the hurricane-force winds never extended more than 40 miles from the center in its existence. That is tiny. It made landfall as a category 5 but landed in an almost-unpopulated area, and despite its reported strength, the highest measured wind ashore was only 45 knots (65 knots is minimum hurricane strength).If I remember correctly, that 45 knot land measurement was made only 30 miles from the storm center on the weak side of the storm.)
“Keep it clean, above the belt” … [ding][ding]
I am ready to observe Round 1!
Re: #455
I am not expert in the area under discussion, but I have read sufficient papers on the matter to realize that the summarrization (and wordsmithing) of the available analysis is incomplete and particularly so if one wanted to truly juxtaposition the alternative views on these matters and let the readers decide for themselves. That it is handled in the manner it is does not surprise me, since I see the IPCC role in this matter as marketing evidence that will make the case for more immediate mitigation of AGW.
On, the other hand, having read enough of the current and past IPCC reports (SAR, TAR and FAR) I have become rather proficient in interpreting IPCCese into plain English and in this case, after all the mincing around with phrasing and including leading words in the same sentence, I conclude that the summary has in effect said essentially nothing about the TC frequency or intensity and coming from the IPCC’s position that says a lot. By the way I detect some of this IPCC wordsmithing creeping into some climate scientists’ writings and I am not sure that is a good thing.
Re: #460
I think the random error theory/conjecture is what I have heard from Dr Curry previously in attempts to rationalize a minimal historical undercount and measurement of TCs. It is a more general case of the dumb ships theory/conjecture.
I attended the AMS Tropical Symposium debate in New Orleans and am pleased to announce that there will NOT be such a debate at the AMS tropical meeting in Orlando. It was apparent that personal animosity has engendered such a negative “atmosphere” that the most basic of points cannot be agreed upon. The “stupid question” comment from Dr. Holland basically killed the debate’s usefulness at that juncture. Essentially peer-review was attempted, with Landsea challenging a colleague’s new research result, and quickly abandoned when it became clear that no constructive dialog would occur. Naturally, Dr. Gray piped up very early on and reiterated his arguments.
Now, the question that was supposedly stupid concerned a new plot shown by Holland that showed a remarkable exponential increase in the number of Category 5 hurricanes in the NATL. Holland asserted that Category 5’s are the bellwether of climate change, but he quickly qualified that nowhere does he say “global warming” just climate change. So, detection of Category 5’s and the technology / observational platform evolution are clearly fair game. Thus, Landsea’s question was right on target.
Thus, Judy, #437, why is this question “stupid” rather than unfounded, irrelevant, etc?
I agree with Judy that the Wang and Lee (2008) paper has critical flaws. Quickly a few:
I do not trust pre-satellite era NCEP Reanalysis (~1979) for tropical trends.
Wind shear and SST can be connected using the framework of the AMM shown by Kossin and Vimont 2007. There are covariances not addressed by Wang and Lee?
Also, Kossin and Vimont as well as Kyle Swanson (2007) showed that the SST gradient in the tropical Atlantic is also a relevant diagnostic, while the SST alone is perhaps not.
#453
Sounds similar to ‘fallacy of ecological correlation’, misuse of correlations derived from aggregated data to represent the correlation for individuals. Holland and Webster might do this in time domain, I’ve heard 🙂
#466. I’m pretty sure that Holland was the reviewer for the paper that Pielke and I submitted to GRL. His review was similarly intemperate and was far too oriented towards gatekeeping opposing views from the literature.
Ryan, bravo to whoever is putting a stop to these crazy hurricane/global warming debates at AMS meetings. The first one, held over a decade ago between gray and emanuel, was also an intemperate fiasco (chris mooney, storm world, has a good writeup on this one).
I am not trying to minimize in any way the historical undercounting/overcounting/incorrect counting issue. What was at issue in the Landsea/Holland exchange is the issue of correct categorization of major hurricanes in the 1950’s. Landsea’s own 1993 paper suggested that the estimates back then were too high. Then Kerry Emanuel took him at his word and adjusted the intensities, then Landsea came back and said you shouldn’t correct the intensities of major hurricanes prior to 1970. This little war over major hurricane intensities between Landsea and Emanuel still hasn’t been resolved. Now Landsea seems to be implying that we were underestimating the intensity of major hurricanes back in the 1950’s. While flip flopping is bad in politics it is ok in science to change your mind in light of new evidence. it is NOT ok to keep changing your mind in the absence of new evidence according to the expediency of your present argument.
#461 Steven, yes this is what i am trying to say, its time to do the hard physics thing, figure out what is going on, and build better models. The most promising effort to sort out the intensity data is Kossin/Vimont, but the satellite data they can use only goes back to 1977; this will help outside the Atlantic but no help in the Atlantic since the data since then is pretty much ok. The Atlantic under/over/incorrect counting in the historical data will probably never be resolved satisfactorily (hopefully there will be some improvement). Hopefully I will have some time this weekend to take on Gerald’s challenge 🙂
David, recall that Felix struck land as a Cat 5. If the Cat 5 was reached only over the open ocean in a storm with the horizontal extent of Felix, then the intensity might have been underestimated using aircraft obs alone. But since it struck land on the nicaragua/honduras coast, there would have been some physical evidence of Cat 5 damage even if wind speeds were not measured. Recall, we are talking 1950, not 1850; this region was definitely populated in 1950.
Judith:
OK, just to be clear. Are we talking of what would have been observed if a hurrican like Felix (2007) had occurred in 1950?
David’s description suggests that it still could easily have escaped notice. Is his description accurate? If so, doesn’t the point hold?
Re #471 Agreed, there would be physical evidence of a strong storm, but translating that to windspeed is problematic. Photos from the landfall region are here and, while damage is apparent and all areas aren’t inspected, it would take quite a detective to determine that a cat 5 had made landfall.
Judy, your answer in #471 would have served Holland well, as a simple response to Landsea’s argument. I am still lost on the line of reasoning that Category 5’s are the bellwether of climate change, especially in the North Atlantic. I liken it to an increase in the number of F5 tornadoes…
The recored presentations will be available online probably in the next week or two. Thus, we will all be able to sample the context within which each panel member made their same-old arguments. Until then, “I actually did vote for the 87 billion dollars, before I voted against it”
I paid the $9 (sigh) for the Wang Lee paper on global warming and US landfalling hurricanes. While the hypothesis is plausible and consistent with other analysis, I don’t see that it offered significant additional evidence to support the hypothesis.
Ryan noted the problems with reanalysis data. In addition to that, the 1855-2005 landfalling US hurricane data quality is soft and I’d be leery of putting weight on any slight trend that raw data might show.
I will note my belief that the magnitude of the windshear increase they report (circa 2m/s) would be large enough to noticeably affect long-term formation and intensity data. Two meters per second is not a trivial change.
The most interesting part of the paper (to me) is a reference to another paper that reconstructs Caribbean wind shear via corals and marine sediment cores. Gotta read that one, even if it means another $9 (sigh).
Re: #472
Bernie, my grandfather develop a rather selective hearing problem after years of living with my grandmother and my aunt, so I think I can detect that ailment when I see it and even understand its source.
Re: #473
Not so fast, David, lets give Inspector Holland a go at that determination.
re 473.
I sense a tree ring wind proxy of sorts.
http://snap.tbo.com/pages/photo_page.php?mm=1713363&gallery=317064
Ryan Maue (#466),
I do not understand why anyone trusts the reanalysis data in the tropics. just as in mesoscale storms in the midlatitudes
The lack of land based observational data near the tropics is well known and reanalysis data is simply a combination of that sparse surface based observational data (note that satellite data depends on being anchored by surface based measurements as discussed before) and global model parameterizations that are seriously flawed.
In fact, near the tropics any error in the parameterization of the actual total heating leads to instantaneous large errors in the vertical component of the velocity
(references cited previously and available on request).
In both of these cases, any observational errors in the initial relative
vorticity or parameterization of the total heating lead to inaccurate position and intensity of the corresponding storms. In summary, reanalysis
near the topics is suspect, to say the least.
Jerry
I agree with you Gerald #479, nice summary of the pitfalls.
Dr. Trenberth from NCAR has also weighed in (I found a comment through Google news), albeit rather tamely.
Since this is just another incremental fun-with-correlations paper, Wang and Lee (2008) will not change anyone’s mind on much of anything.
If a tree falls in an empty forest, does anyone hear its teleconnections?
David, a few comments. Cat 5 storms are relatively rare, and historically may not have been accurately categorized. So basing a “bellwether” argument on observations is problematic. However, if you take a pdf of hurricane intensity, then shift the distribution to the right slightly (with higher average intensity), you end up with a big increase in the # of Cat5’s. I think this is the gist of Holland’s argument. But hopefully the presentations will be posted online by AMS.
Re damage from Felix, here is summary from Wikipedia:
Early reports suggest severe damage in Honduras and Nicaragua after Felix made landfall as a Category 5 hurricane. In Puerto Cabezas, nearly every structure sustained at least roof damage, and many buildings were destroyed.[47] Along the Mosquito Coast, flooding and mudslides were reported, destroying many houses (mostly humble dwellings) and blocking highways. The Government of Nicaragua declared the northern Caribbean coast a disaster area.[48] The Miskito Cays, located about 70 km from Bilwi off shore in the North-Eastern Caribbean Coast of Nicaragua, was among the strongest hit areas. Hurricane Felix had not yet made landfall but reached maximum force when it passed over the Miskito Cays. The winds of the hurricane, with speeds of up to 160 mph (260 km/h), destroyed the Cays completely. Pillars, that previously formed the base of the houses, are the only remains on the Cays.[49]
At least 133 people were reported dead. At least 130 of them were in Nicaragua.[50] While few details have been disclosed, they include at least 25 dead Miskito fishermen swept away, a drowning death on a boat, impact from a fallen tree and at least one indirect death caused by medical complications after birth.[51] There were at least three deaths reported in Honduras, one of which was caused by a motor vehicle accident caused by heavy rain and landslides, [52] and two caused by flooding in the capital city of Tegucigalpa.[53] However, hundreds of others were missing (mostly at sea), and communications are difficult, to impossible in many areas. Some survivors were also been found on the Mosquito Coast that were initially reported missing.[54]
According to official information, at least 40,000 people were affected and 9,000 houses destroyed, most of them in the Nicaraguan city of Bilwi (Puerto Cabezas), where a “State of Disaster” was decreed by the government. A total lack of supplies and services were also reported in the area.
re 482. not so bad then. whew!
Re: 437
Judith,
For years I have been telling the people who work for me that there are no such thing as a stupid questions.
There are, however, stupid answers. IMHO, Dr. Holland provided one.
#482
Certainly tragic. But what would the damage have been for a category 4?
re 485. good thing holland isnt here
Here is a brief description of the damage expected to be caused by Category levels for Hurricane 3, 4, and 5. I included the non-existent level 6 as I recall JEG referencing that level.
You can compare the journal accounts with these descriptions and decide for yourself.
In modern times I suspect the hurricane level is determined by more or less direct velocity and pressure measures while in other times evidence might be taken from the damage done providing it hit land in a reasonably populated area.
One should for a more complete analysis look at the journal accounts of the hurricanes listed under the levels below and compare them.
Category 3
Tropical cyclones of this intensity and higher receive the name of major hurricanes when located in the Atlantic or Eastern Pacific basins. These storms can cause some structural damage to small residences and utility buildings, particularly those of wood frame or manufactured materials with minor curtainwall failures. Buildings that lack a solid foundation, such as mobile homes, are usually destroyed, and gable-end roofs are peeled off. Manufactured homes usually sustain very heavy and irreparable damage. Flooding near the coast destroys smaller structures, while larger structures are hit by floating debris. Additionally, terrain may be flooded well inland.[8]
Examples of storms of this intensity include Alma (1966), Alicia (1983), Fran (1996), Isidore (2002), Jeanne (2004) and Lane (2006).
Category 4
Category 4 hurricanes tend to produce more extensive curtainwall failures, with some complete roof structural failure on small residences. Heavy, irreparable damage and near complete destruction of gas station canopies and other wide span overhang type structures are also common. Mobile and manufactured homes are leveled. These hurricanes cause major erosion of beach areas and terrain may be flooded well inland as well.[8]
Hurricanes of this intensity are extremely dangerous to populated areas. The Galveston Hurricane of 1900, the deadliest natural disaster to hit the United States, would be classified as Category 4 if it occurred today. Other examples of storms at this intensity are Carmen (1974), Iniki (1992), Luis (1995), Iris (2001), and Charley (2004).
Category 5
Category 5 is the highest category a tropical cyclone can obtain in the Saffir-Simpson scale. These storms cause complete roof failure on many residences and industrial buildings, and some complete building failures with small utility buildings blown over or away. Collapse of many wide-span roofs and walls, especially those with no interior supports, is common. Very heavy and irreparable damage to many wood frame structures and total destruction to mobile/manufactured homes is prevalent. Only a few types of structures are capable of surviving intact, and only if located at least three to five miles inland. They include office, condominium and apartment buildings and hotels that are of solid concrete construction, public multi-story concrete parking garages, and residences that are made of either reinforced brick or concrete/cement block and have hipped roofs with slopes of no less than 35 degrees from horizontal and no overhangs of any kind. The storm’s flooding causes major damage to the lower floors of all structures near the shoreline, and many coastal structures can be completely flattened or washed away by the storm surge. Storm surge damage can occur up to four city blocks inland, with flooding, depending on terrain, reaching six to seven blocks inland. Massive evacuation of residential areas may be required if the hurricane threatens populated areas.[8]
Storms of this intensity can be extremely damaging. Historical examples that reached the Category 5 status and making landfall as such include the Labor Day Hurricane of 1935, the 1959 Mexico Hurricane, Camille in 1969, Gilbert in 1988, Andrew in 1992 and Dean and Felix of the 2007 Hurricane Season.
Category 6
According to Robert Simpson, there is no reason for a Category 6 on the Saffir-Simpson Scale because it is designed to measure the potential damage of a hurricane to man-made structures.[3] If the wind speed of the hurricane is above 250 km/h (156 mph), then the damage to a building will be “serious no matter how well it’s engineered”. However, the result of new technologies in construction leads some to suggest that an increase in the number of categories is necessary. This suggestion was emphasized after the devastating effects of the 2005 Atlantic hurricane season. During that year Hurricane Emily, Hurricane Katrina, Hurricane Rita, and Hurricane Wilma all became Category 5 hurricanes. A few newspaper columnists and scientists have brought up the suggestion of introducing Category 6 since then, and they have suggested pegging Category 6 to storms with winds greater than 175 or 180 mph (78–80 m/s; 150–155 kt; 280–290 km/h).[
http://en.wikipedia.org/wiki/Saffir-Simpson_Hurricane_Scale
Re 486
Wouldn’t be anything I haven’t heard before.
John M, good question 🙂
The Saffir-Simpson scale for intensity was largely developed to assess intensity from damage when wind speed measurements weren’t available. Details are found at http://www.nhc.noaa.gov/aboutsshs.shtml
There is a pretty big difference between cat 4 and 5 damage, even if the main damage is from wind. Wind damage goes as the cube of windspeed.
Characteristics of cat 4 damage: More extensive curtainwall failures with some complete roof structure failures on small residences. Shrubs, trees, and all signs are blown down. Complete destruction of mobile homes. Extensive damage to doors and windows.
Characteristics of cat 5 damage: Complete roof failure on many residences and industrial buildings. Some complete building failures with small utility buildings blown over or away. All shrubs, trees, and signs blown down. Complete destruction of mobile homes. Severe and extensive window and door damage.
Re 487 and 489
Thank you Kenneth and Judith for the clear definitions of hurricane strength and likely damage to result. Not knowing the building standards on the Mosquito Coast, I’m not sure how to apply these guidelines to the press reports. (My sense, admittedly perhaps wrong-headed, is that the damge criteria sound kind of “western”.)
In particular, since this is all in the context of how Felix would have been recorded in 1950, I think it still remains an open question—stupid or otherwise—as to how history would have viewed a 1950 Felix.
In hopes of redeeming myself with Steven Mosher, let me attempt what I hope is an astute observation. It seems that David Smith in his comment in #473:
had it about right.
Back in the 1950’s, ca. when the Saffir Simpson scale was created, no one had serious building codes yet. So the Saffir-Simpson damage criteria is not targeted at current Miami building codes. It is possible that there would have been some ambiguity between Cat4,5.
If there is no building damage and you only have tree damage to go by, you can’t discriminate between Cat4, 5. But there is no ambiguity say between Cat 2,3 and Cat 5 based upon damage, which is the level of ambiguity suggested by Landsea’s question.
@Judy–
So, based on the Wikipedia description you posted and the Saffir/Sampson scale, Felix reads like Cat 3- Cat4 based on wind damage at land. I was born in El Salvador, and take the “mostly humble dwellings” that were flattened on the Miskito coast to mean something rather less robust than a mobile home.
Hi All- On damage:
1) Judy’s assertion that “Wind damage goes as the cube of windspeed” is questionable. It has been determined empirically lie between 4 and 6, and William Nordhaus suggests that it is as high as 9, though this is clearly an outlier (which can be explained for methodological reasons). Discussed here:
Pielke, Jr., R. A., 2007. Future Economic Damage from Tropical Cyclones: Sensitivities to Societal and Climate Changes, Philosophical Transactions of the Royal Society, Vol. 365, No. 1860, pp. 1-13.
Click to access resource-2517-2007.14.pdf
2. On differences in damage between Cat 4s and Cat 5s, please see table 5 in this paper:
Pielke, Jr., R. A., Gratz, J., Landsea, C. W., Collins, D., Saunders, M., and Musulin, R., 2008. Normalized Hurricane Damages in the United States: 1900-2005. Natural Hazards Review, Volume 9, Issue 1, pp. 29-42.
Click to access resource-2476-2008.02.pdf
Damage should allow one to tell the difference between a Cat 2 and Cat 4/5, but as we have argued elsewhere, impacts data is not a good place to look to resolve debates about geophysical events.
And yes Holland’s juvenile response to Landsea and Judy’s endorsement of it help to explain why this debate is going no where until some fresh faces get involved. It is now purely tribal.
Well, not having been there, I guess the stupidity of the question depends on how one reads the following.
Judith Curry #437
Ryan Maue #466
Perhaps Landsea had a bit of an overly rhetorical flourish to his question. Had it been me, and the context was as posed by Judith, I hope I would have responded “clearly a 4 or 5.” If the context was as described by Ryan and I was put on the spot to specifically defend an argument I had based strictly on Cat 5 hurricanes, I’m afraid I might have responded as Holland did.
Re #493 Roger, insured damage seems to go as the 9th power of wind speed. Insured damage combines direct wind damage, flooding from precip, and storm surge. The structural damage from wind itself seems to go as the 3rd power. Clearly flooding causes much more damage than wind on average. But when comparing the structural damage from wind such as delineated by Saffir Simpson, the relevant thing is the damage from wind to structures. If the damage from wind is an even greater power than 3, then it should be even simpler to discriminate wind damage from a cat 4 vs cat 5.
It was not a “stupid” question. But it was a presumptive question. And the manner in which it was phrased and delivered (in a public forum) was very provocative. Holland understandably chose to disengage with an unfortunate choice of words. Had the same question been phrased and delivered differently Holland probably would have chosen otherwise.
Ah, human pride and tribalism.
JohnM, 494
Why would you have answered clearly Cat 4 or 5? Do you have more detailed information than in the Wikipedia article? I wanted to see what might likely have constituted ‘humble dwellings’ in “destroying many houses (mostly humble dwellings)”, as the type of homes destroyed would matter.
I googled a bit to see photos. This Guardian story contained images showing the sorts of home often called “humble dwellings” when people report goings on in Latin America:
At least this picure appear to match what Saffir/Sampson expects for Cat 3 damage, in the description you posted. Specifically,
“Buildings that lack a solid foundation, such as mobile homes, are usually destroyed, and gable-end roofs are peeled off. Manufactured homes usually sustain very heavy and irreparable damage.”
re 490. sorry, some jokes I cannot pass up, even if they are uncalled for.
It was a random fruiting.
P.S. I’m through on this thread, happy to engage with the climateauditor regulars, but snarky comments from Roger Pielke
And yes Holland’s juvenile response to Landsea and Judy’s endorsement of it help to explain why this debate is going no where until some fresh faces get involved. It is now purely tribal.
have deteriorated the exchange here in the past, and I’m not going there again. For the record, i do not endorse anyone else’s statements, I think independently and speak for myself, and do not include myself as a member of any tribe (otherwise i wouldn’t be spending time on climateaudit).
re 497. It looked like an F2 to me, being from the midwest an all. Thats like cat3-4 something like that.
Part of the debate allowed panel members to ask each other a question. Landsea chose to burn his question on this issue, so it was obviously not just rhetoric.
Each panelist had the opportunity to introduce their work with a 1-minute, 2 slide quickie PPT. Holland put up a graph that had the number/trend of Category 5’s over the past decades. The number had increased from i.e. 0.5 to 0.9 per year (I forget the numbers), but went straight up at the end. That was the gist of Holland’s presentation. Landsea concentrated on data quality and observation system changes.
So it is no surprise that Landsea would challenge Holland on aspects of Category 5’s. He discussed Wilma as an example and then turned to Felix. Holland should have been prepared to answer it, but he clearly was not. I refuse to accept that his answer was an appropriate reply. It was a weak attempt at deflection.
NPR has a short 4 minute summary of the exchange. NPR
I think these discussions too quickly get derailed from what, at least, I see as the major issue here. I will state it as simply as possible.
Given that frequency and intensity detection capabilities of NATL TSs changing overtime could well be confounding the relationship between increasing SST and TS frequencies and intensities, what quantitative evidence do we have for changes in detection capabilities over the long term.
I personally judge that good evidence has been provided for a nearly complete confounding of changing detection and SST over time. We have seen published evidence from Pielke Jr. and we have seen some original analyses and evidence from Steve M, David Smith and Bob Koss presented here at CA. These approaches and evidence have been so clear to me that I have posted some of my own amateurish and layperson musings and conjectures of fitting the annual frequencies of a category of TS called Easy To Detect storms (derived by David Smith) to an anticipated Poisson distribution after separation into the subcategories of AMM positive and negative. By similar categorization the ACE distribution can be fit to an expected normal distribution.
While I would not expect or anticipate a reaction from WHC to the unpublished analyses, I would hope that they would address more directly the findings of Pielke and that contributed recently by Landsea here:
Click to access landsea-eos-may012007.pdf
In my view debates are as meaningless in the sciences as they are in politics and evidently can sidetrack the real issues as easily with scientists as politicians.
communication between fringe tribe members is the only way to break down tribalism
Hi Judy- When you said that “Holland gave the appropriate reply.” I though you meant that Holland’s reply was appropriate. Apologies if I misinterpreted.
Your comments on insured damage are wildly off base, e.g., flooding (whether from precip or storm surge) are almost never covered by private insurance. No snark, just facts. Thanks, sorry to see you leave once I arrive 😉
Lucia #497
For the sake of argument and putting myself in Holland’s shoes.
If I put myself in John M’s shoes, I probably would answer “What the hell you askin’ me for?!?” 😉
did i somehow miss the part about improved protection measures or warning systems in this paper?
an increased vulnerability is a BIG part of the problem of AGW.
reducing CO2 has a couple of other economic side effects. i believe that this comparison is seriously flawed.
@JohnM–
Heh… that’s a bit non-responsive. Why, if you put yourself in Holland’s shoes would you have said that?
After all, based on the information posted here, it appears the damage matches Cat 3 or 4 (and more like Cat 3 than 4). So, ehmm… Do you think:
1) Holland would say it was clearly cat 5 or 4 even though even he thought the the appearance looks like Cat 3 and at most 4? or
2) Holland would interpret those rickity (some of which clearly survive) as the sorts of solid structures take n down by Cat 5? or
3) Holland has information that would permit him to defend Cat4 or 5?
If you think 1, that might imply you think Holland would resort bit deceptive when responding to questions, if 2, that might imply Holland isn’t very objective when assessing evidence. If you think 3 that might mean Holland knows something to support Cat4 or 5– but in that case, why dodge the question?
I honestly don’t know the answer. If someone had asked me yesterday, I would have said “beats me!”. But so far, based on the definition you posted, and the wikipedia article, it looks as though an assessment based on damage would have resulted in cat 3 or 4. Presumably those who read a lot about hurricanes ( Judy or Roger) might be able to point to more damage evidence– but Judy is gone now. So, likely, until someone digs up evidence this looked like Cat. 5 damage, it’s going to continue to look like Cat3-4 to me (and possibly others.)
That means to at least some curious third parties, it’s going to look like Holland dodged that question because he didn’t want to admit the answer: Based on damage, Felix looked like A cat 3-4.
Dearest Lucia,
Sheeez. I’ve had a rough day. First Mosh Pit implies I ask stupid questions, and now you won’t let me waffle away in peace.
Actually, I find your argument quite compelling. Indeed, I thought myself that destruction of ramshackle abodes in Central America might be difficult to match with our American ideas of Cat 4 or 5 storm damage, but lacking first-hand experience down there, I resisted making the comment. I’m glad you were able to add that perspective.
As far as what I think about Holland’s motives, I was only reflecting Judith Curry’s apparent opinion that the damage was consistent with 4 or 5. Maybe I am guilty of accepting that logic a little too quickly, but perhaps we can convince Judith to come back and pick up the discussion.
Now, if you’ll excuse me, I have some waffles to make.
A new Nature paper has hit the presses. Large contribution to sea surface warming to recent increase in Atlantic hurricane activity by Saunders and Lee.
A press release and commentary: USA Today
I am quite interested in the robustness the NCEP Reanalysis wind data prior to 1979 and the inclusion of satellite data (especially in the tropics).
Imagine a Cat 1 or 2 storm hitting Tijuana.
re 508. Sheesh John, now you are making me feel bad.
Re: #509
Sounds from the abstract that this would be a fun paper to analyze. If I pay the fee to download it can I put it up for all of us to look at and review?
All,
Has anyone seen the review of the dynamical cores manuscript from Judith Curry?
Jerry
#513 I’ve been lurking. Haven’t seen it.
bender (#514),
Thanks for monitoring. I have asked Steve M if he would like to
post the manuscript or start a different thread, but have not heard
back from him. Under any circumstances, I will write a review
upon seeing what Judith does as I feel much can be gleaned by a careful reading of the manuscript.
Jerry
Email me a thread and I’ll post it.
Steve M (#516),
I have e-mailed you a possible thread title and a brief intro to the thread. Let me know if it is appropriate. Thanks.
Jerry
Here is a review of the Saunders and Lea paper (Gerald, still haven’t gotten to dynamical cores, will try again this weekend)
Saunders and Lea consider the North Atlantic tropical cyclone data since 1965. They have chosen the period where there is relatively little debate over the quality of the data. The tropical cyclone numbers are fairly reliable, since this is the period for which we have satellite data (although there may be a few storms that were misclassified in the early part of the period). With regards to hurricane intensity, the data is generally accepted to be reliable since 1977 and probably since 1970, although there is debate about the intensity of major hurricanes prior to 1970. So overall, the credibility of the data they use is fairly good (and I don’t think Landsea would see much to criticize in this). Regarding the analysis of SST and wind data, again the data they use is credible, but wind data prior to 1979 may be somewhat less reliable (when satellite temperature and humidity data became available).
Overall this paper doesn’t tell us anything new regarding the relationship between the various hurricane indices in the North Atlantic and SST: this has been addressed in papers by Emanuel, Mann, Curry, Holland, etc. They apparently didn’t find any relation with wind shear, but rather found a relation with 925 mb wind speed. Correlation doesn’t imply causality, but I think there is some causality here but the cause and effect is mixed up. If you have a lot of hurricanes, you will have high values of 925 mb wind speed. So I don’t see the point of looking at 925 mb wind speed?
With regards to the hurricane/global warming debate. This paper doesn’t really have anything to say on the big issue of whether the recent increase in North Atlantic hurricanes is caused by natural variability or global warming, since the time period that they selected is too short to allow this discrimination (Landsea is correct on this point).
I don’t think this paper would have survived U.S. hurricane reviewers (say in Science), likely that predominantly European scientists reviewed this.
Re Felix: if you google hurricane felix trees, there are numerous reports of large trees being knocked down. This would indicate Cat 4 at least.
Judy,
NOAA’s web page on Saffir – Sampson says Cat 2 knocks down some trees and large trees are blown down by Cat3.
The Saffir-Simpson Hurricane Scale
Re Felix: … large trees being knocked down. This would indicate Cat 4 at least.
Perhaps you remember the remnants of Hurricane Opal, here in North Georgia:
http://en.wikipedia.org/wiki/Hurricane_Opal
Here are some North Georgia highlights:
– The peak wind gust in Georgia was a 79-mph (127 km/h) gust in Marietta …
– More than 4000 trees were knocked down within the city of Atlanta alone.
A peak gust of 79 MPH is pretty far short of Cat 4, more like marginal Cat 1.
We don’t get hurricanes on the west coast but we had 10000+ trees blown down in a winter storm last year. Many were very large and caused a lot of damage.
#518…The NCEP/NCAR and ERA40 reanalyses don’t have hurricanes in them:
If have you ever looked at the NCEP/NCAR reanalysis data in the context of a hurricane, this statement gives way too much “credibility” to the winds at 925 hPa.
Huh??? I sure hope (cross fingers) this means the Best Track winds and not the NCEP reanalysis.
Anyways, allow me to plot the Maximum winds for a couple of years and August 1 – September 30 (244 6 hourly points) from 1965 and 2005, to give a little flavor of what the NCEP Reanalysis offers. These wind speeds are in knots, so, 64 knots is a hurricane, but don’t bother looking for one. So, monthly means, which Saunders and Lea use, are of unknown quality.
1965:
2005:
Re: #520
Lucia, please remember that the Saffir-Simpson categorization goes back to the 50s and those trees were not as well rooted then. Well anyway you probably understand how these arguments go by now.
522, we sure as heck had one in the Puget Sound area in 1965. In October. The “Columbus day storm”.
Well, the main point about intensity, even landfalling intensity, is that we don’t have reliable information before 1970. We can probably for the most part distinguish major hurricanes (cat 3 and above) from weaker storms (although there will be some arguments at the cat 2/3 border) for landfalls in most locations in the periods since about 1920 (and in some locations, earlier). That said, we can’t really say much with any confidence about how any prior hurricane would have been classified with modern technology, there are too many “ifs”. So is this discussion getting us anywhere? Holland’s statement in a debate after being provoked several times by Landsea is surely not very important or interesting (amusing, maybe).
NCEP (and ERA) reanalyses are less reliable prior to 1979 owing to the lack of satellite temperature and humidity profiles, this is a well accepted statement (and a point that Ryan Maue raised earlier).
Ken Fritsch,
So….. is your point that you think those trees were saplings in 1950. So, if Felix hit in 1950 it would only have knocked down saplings, and so the only evidence for destruction would be knocked over Saplings? And so, it might have been designated a Cat1 or 2?
Sure. If the shore in Nicaragua and Honduras had no large trees in 1950, but was instead covered with nothing but shrubberies, then there would have been no felled trees. So, in that case, this evidence to support “Cat 3” would have been absent. In that case, unless other damage existed to support Cat 3 or above, the hurricane would have been rated Cat 1 or Cat 2.
That said, is there any reason to believe there were no large well rooted trees on the shores of Nicaragua in 1950? There were large trees on the shores in El Salvador in the ’50s. What was to prevent trees from sprouting in 1910, maturing and getting knocked over in 1950? Or felled to build ‘humble dwellings’? Unless someone proves otherwise, I’ll pretty much assume there were at least some large trees on the shores in 1950. Had Felix hit then, they would have been knocked down, and the hurricane would be rated a cat 3. But felled trees don’t appear to be enough to rate 4-5.
Judy—
Sure the discussion is getting us somewhere. Or at least its getting us somewhere if we are focusing on the technical point rather than Holland’s behavior.
We appear to all be agreeing that in the 1950s, hurricanes like Felix almost certainly would not have been ratedd Cat 5 or 4. Rather, it looks like the evidence points to a Cat 3 (unless we believe there were no trees there in 1950. In which case, it might have been rated a Cat 2.)
The result is hurricanes would likely be undercounted. And, analyses that assume the hurricane detection rate doesn’t have a biase over time have some difficulties.
This may not be important to Holland’s reaction during the debate, but it’s important to any scientific assessment of hurricane count trends.
Lucia, we still don’t “know” how a Fritz would have been classified in 1950. We would need to look at the statistics of ship tracks and airplanes in the region, and then “wonder” if one of them would have encountered Fritz. So this exercise isn’t useful in the context of an individual storm. Fritz definitely would have been “counted”, since it traveled through the Caribbean islands in the earlier stages of the stom.
If you go to http://en.wikipedia.org/wiki/List_of_Category_5_Atlantic_hurricanes
you will see that there were cat 5 Atlantic hurricanes identified in the 1950’s, several of which didn’t make landfall. So clearly the observing system was adequate in the 1950’s to pick up at least some cat 5 hurricanes even if they didn’t strike land. Some were likely misclassified; very doubtful that any major hurricanes in the 1950’s were totally missed
Lucia, I do not use emoticons, but that was my way of saying that these arguments go nowhere. Hurricanes are difficult to classify without modern detection capabilities and tropical storms are even more difficult to detect/measure without this equipment. I think Holland’s correct answer would have been I do not know, but that would have made Landsea’s point. Felix is but one storm, however, and there is bigger story to be told here.
The Landsea paper that I linked to above gives a good account of changing detection capabilities and what that has done for increasing counts and measures of intensities for NATL TSs. When you work with the Easy to Detect storms (defined in a few diffent ways) as we have here at CA it becomes rather obvious that most of trends in TSs frequency and ACE are very probably connected to changing detection capabilities.
Kenneth and Lucia,
You’ll see above or around here that I noted some musing about snapping trees and wind strength.
I did a little research ( one googlium) and determined that trees make better thermometers
than anemometers.
I suppose if you had a listing of the tree species, trunk diameter, tree height, Surrounding
wind shelter, soil composition, of all all trees in the path you could create an estimate
of wind speed.
That is actually a cool idea. The breaking or uprooting of the tree is probably an easily
modellable mechanical problem. Somebody has to have done this.
When I saw the pics that Dr. C linked for Felix the CAT x, I mentioned the
trees.
Tree rings for Wind lovers.
Here is a nice tree study Dr. Curry.
Click to access 01_HURRICANE_DAMAGE_TO_TREES_SAN_JUAN_francis.pdf
I accept payments in shubbery. A nice one, and not too expensive.
531, problem is, how much limb breakage you have depends on recent (past few years) storm activity. Storms tend to break off the weaker limbs, and you get a lot more debris if it’s been a while since the last storm. Same with uprooting.
Judy– The hurricane was Felix. 🙂
I didn’t mean to suggest Felix would have been missed altogether. What I meant was it would have likely have been missed in the sense of undercounting Cat. 5 hurricames. The storm would likely have been spotted, but likely mis-attributed as a lower level. Depending upon the methods used to spot hurricanes, it might have been classed as low as 2 or as high as 4. It seems unlikely it would have been classed as 5, and nothing you have suggested points otherwise.
Meanwhile, just as one presumes that, just as there were trees on the shores of Nicaragua in the 50s which would at least have made Felix be identified as a Cat 3, there would also have been some Cat 2 hurricanes (possibly even a named Fritz 🙂 ). Because the detections techniques were poorer, and biased toward missiing short lived peaks in intensity, these mgiht missed altogether or classed as a tropical storms.
But I have to ask you two things:
First: Who suggested that the observing system could not detect any Cat 5 storms during the 50’s? I didn’t, and as far as I can tell no one anywhere has suggested any such thing. What has been suggested is the possibility of bias. So, your presenting evidence that 5 storms were detected is largely irrelevant to any arguments being advanced. The question is: How do we know there weren’t 6 or 7 Cat 5’s?
Second: Who is doing this exercise in the context of an individual storm? You keep warning someone not to do this. But as far as I can tell, no one here (or anywhere) is doing this exercise in the context of an individual storm.
When trying to discuss a topic, it’s best to avoid providing counter arguments to arguments that have not been advanced. Doing that just wastes time and leads nowhere.
FWIW, I think this exercise is being done in the context of estimating possible bias errors in the storm counts in various categories. Discussing features of specific storms that have been detected, how they were detected, and categorized in the 50’s vs. now is the appropriate method for assessing whether or not there might have been a bias in any storm category, or possibly all of them.
How else would one try to assess bias in a measurement system other than by examining how it detects a range of specific events that actually happened?
As you emphasize “we can’t really say much with any confidence about how any prior hurricane would have been classified with modern technology, there are too many “ifs”.”.
We all agree. In spades. Over and over.
Not only do we agree that we an’t know for sure: the amgibuity, and difficulties associated with estimating the strength of past hurricances is precisely the point advanced by those who suggest systematic undercount was likely.
So, no, we can’t say with confidence how storms with Cat N characteristics would have been classified in the past. But we can observe it appears likely there could be systematic biases in the direction of missing the peak intensity. That is: some Cat 5’s drop to 4 (or 2) Some Cat 4s drop to 3 (or 1) Some Cat 3’s drop to 2 (or tropical storms) and so on. Meanwhile, there is nothing to cause any upward bias in estimated peak intensity in the past.
The result is that the data record for hurricanes measured using modern (and consistent) methods is rather short. If we examine the short recent data record only, it’s difficult to distinguish whether or not hurricane counts have really increased recently or whether the variation simply falls in the range of variation that has always existed. This is because we don’t have enough data.
Worse, the existing evidence suggests the 70s may have been a relative minimum in hurricane rates. So, even though that point isn’t cherry picked in the usual sense, there is reason to believe basing results on the short data record might result in our making hasty conclusions about trends.
And the danger of making hasty conclusions because of the ambiguity and probable bias would appear to be Landsea’s major point.
Semi related (storm energy proxy?):
http://www.mavsurfer.com/main_page/
Moshpit will enjoy this! (Notes / disclaimers – do not try this at home – this is way beyond the capability of anything I or any of my friends would ever contemplate. BTW – IMHO the people on the wave runners – used for towing in surfers when the waves get above a certain size, and, for rescues, are the most bat s#$% insane)
RE: #535
This is a point that frequently is overlooked when writers decide to start from the early to mid 1970s because that is when the records are perhaps more accurate and then fail to emphasize that the cyclic nature of NATL storms also coincides with a low point in that time period. Looking at the AMM positive and negative cycles with the Easy To Detect storms provides some insight into the cyclical nature of the NATL TSs in my view and allows one to go back beyond the 1970s and use more of the historical part of the time series. We all tend to repeat ourselves on this topic but this part bears repeating.
#535
Lucia, thank you for the precisely worded and elegantly composed post.
For someone such as myself, who has been doing industrial process control and improvement for twenty years, threads such as these are often quite painful to read.
If I were to enter a manufacturing plant on a consulting engagement, and asked to investigate why there had been 3 times the number of “category 5” product failures in the past six months than there had been in the past two years combined, I would be remiss if I didn’t ask for an operational definition of a category 5 product failure. No one would think twice were I to ask if that definition had changed over time, or if the peole making the judgements had changed.
I would be considered incompetent if I didn’t inquire about the state of any measurement devices used in passing these judgements, or ask for records comparing gauging techniques to determine if the measurement system has remained stable.
Even the most cantankerous plant manager would support me in getting answers to these questions before somebody from corporate engineering started getting into “the physics of it.” Because if the data are unreliable, you’re not going to get the right answers from the physics, even if that’s where they lay.
Lucia, two separate issues. The big issue is the liklihood of historical misclassification (or total missing). The trivial issue is the classification of a single storm, and the landsea/holland “stupid question” thing. I agreed in spirit with Holland that this is not worth focusing our attention (i personally wouldn’t have said stupid question).
Re the misclassification issue. Since 1945, there have been aircraft reconnaissance flights in the North Atlantic, and since 1950 there was pretty good coverage. Landsea’s 1993 paper describes the historical data set, and said that the intensity prior to 1970 was too high, and he suggested a downward adjustment. He also thought the data since 1950 was high quality, storms weren’t missed. Here is the landsea 1993 paper http://ams.allenpress.com/archive/1520-0493/121/6/pdf/i1520-0493-121-6-1703.pdf
Now landsea says you shouldn’t do the downward adjustment (which Emanuel did), and they are still arguing about this
Here is my understanding:
Hurricane count since 1950 should be ok, very unlikely to miss a hurricane. There is some fuzziness about tropical storms, and i would certainly agree that some that we’ve observed esp since 2003 wouldn’t have been counted in 1950. Re intensity, to me the intensity distributions prior to 1970 with or without the landsea corrections don’t make sense, so i would say we don’t have reliable intensity data before 1950 (except possibly for landfalling TCs). I think that those labeled cat 4 or 5 are definitely majors, but there is fuzziness between cat 2 and 3, so even the # of majors is suspect.
There is another issue of spurious misclassification of subtropical storms as tropical storms. This hasn’t really been done correctly probably prior to about 1975, in principle you can use the reanalyses back to 1950 to sort this out. Two different groups have tried this, coming up with two different answers. So there is both some under and overcounting back to 1950. Prior to 1945, things get progressively worse in terms of over and undercounting.
Re landfalls, it seems that the landfall data set is pretty reliable since 1920 (other than spurious subtropical storms in the dataset), so the hurricane count is probably better than the total TC count. The classification of major vs minor hurricanes is much better for landfalling hurricanes than for the open ocean ones in the earlier part of the period.
Every paper that i recieve to review, i hammer them on these data issues. Some editors pay attention, and others dont.
I would be interested to hear Ryan’s assessment of the data quality also
“Op defs? Puhlease … you fool, don’t bring all that enguneering mumbo jumbo and industrial thinking into the hallowed halls of climate science. Here’s a linky.” /Dano / Sarcasm
(I have actually gotten responses that said such things, in not so many words, over at RC, and the “Bunny Hutch,” when mentioning well established Sigma principles)
I would not use tree fall numbers for judgements on strength. As a long time resident of South Louisiana, now living in Houston, I have seen many trees downed by hurricanes. There are two modes of tree fall. The pine trees tend to snap somewhere on the trunk. I suspect fron repeated flexing. The oak trees on the other hand come up with a root ball. My observation is that they twist, liguifiying the soil near the trunk. The subsequent loss of support leads to failure and fall. I believe thet the length of time the tree is exposed to high winds is of much importance. I have watched trees stand up for and hour and then suddenly fail. This is in catagory 1 conditions. So I don’t think tree fall is necessarily a simple indicator of hurricane strength.
@Steve & Mike,
People told you scientists don’t look for systematic errors in data? That it’s only engineers?
That is absurd. GISS and Hadley both do tons of investigation of temperature records to provide their Cru, HadCrut, Met Land/Ocean measurements. The wrote peer reviewed papers on describing their efforts to turn the available data into as unbiased accurate set of anomalies they can. Experimentalists routinely calibrate equipment, and certainly look to differences in instrumentation (or lab set up) to understand why different results might be obtained in different investigations.
Understanding data uncertainty isn’t limited to process engineering.
Lucia – tell that to RC and all of them widdle wabbits and anonymice over at the Bunny Hutch. I am simply sharing the responses I’ve gotten when broaching such topics. Such topics seem to be taboo.
Steve… oh well. I guess I’d have to read the specifics of the exchange.
But worrying about discrepancies that arise between different measurement methods is routine in scientific experiments. If someone suggests otherwise, they must never have done experiments or had to think about reasons different experiments give different results when they are supposedly measuring the same thing.
Thanks Steve. I feel much better now.:)
Last nite i wrote a fairly long reply to Lucia #535, said waiting for moderator approval, and it never appeared. Hopefully it can be resurrected somewhere.
If you please, Lucia, that is not what I meant. And I think the context of my post (following your #535) makes that obvious. So I reject your strawman premise that I claimed “scientists don’t care about systematic error.”
Perhaps analogizing to industry wasn’t helpful, particularly for those who aren’t familiar working in that environment. So let me try again.
This thread is a challenge for me, because those scientists who raise legitimate issues regarding definition, measurement, and categorization of TC’s across the ship, aircraft, and satellite eras seem to be targets of ridicule or scorn amongst those who would prefer to “investigate the physics” behind the increase in Cat 5s.
It’s just a shock to see such resistance to what is considered the standard approach in industry: what are we trying to measure? Are we all talking about the same thing? Have standards changed over time?
With regards to NOAA, NASA, and other agencies, I think the work of surfacestations.org is demostrating that some of the most basic work regarding auditing of stations has been completely neglected. And the climate science community reaction? Again, largely ridicule and scorn for basic practices that are considered standard in industry.
Perhaps Cat 5 counts don’t change depending on the method. But consideration of such an issue is sound scientific practice. How it could be considered anything thing else, especially by scientists, is mind-boggling.
re: 542
lucia,
You seem to think the adjustments by GISS and CRU are valid and do not have systematic error. Steve McIntyre has done some work in this area and it appears the adjustments bias the record even more than the UHI or microsite issues may. When a warm bias is introduced into the record, the GISS often adjusts the older temps down and the newer temps up.
I do not remember when you began to visit ClimateAudit, but you may not have had a chance to read these discussions:
http://www.climateaudit.org/?p=1628
http://www.climateaudit.org/?p=1634
http://www.climateaudit.org/?p=1648
And note especially Comment #2 by Jonathan Baxter here:
http://www.climateaudit.org/?p=1687
Judith Curry says:
FYI – I have noticed that I sometimes get prompted for a captcha after a posts. My post goes into ‘waiting for approval’ limbo if I close my browser window without entering the captcha.
Mike B:
Actually, I think was agreeing with you not arguing against you. 🙂
Those who say that scietists don’t or shouldn’t try to understand uncertainty or error in data records and that that is somehow something unique to engineering process control are, to put it bluntly, flat out wrong.
It’s easy to find examples of scientists seeking to understand uncertainty in measurements in all disciplines including climate science. The process not fundamentally different from what is in industry, though obviously some differences in application exist.
In both science and industry, to the extent that there is uncertainty in an instrument record, it is more difficult to make strong positive conclusions about any hypothesis. When possible, you resolve this by doing more testing and collecting more data. When it’s not possible, you may simply be left in a situation where insufficient data remains to provide a definitive answer to a question.
(I think that, and not the specific issue about Felix, would have been Landsea’s larger point in the debate with Holland. And yes, I suspect the fact that Landsea was making a valid point, and had been over and over, contributed to Holland’s exasperation, and his decision to give a snippy evasive retort. But of course, Holland’s poor answer is not the important scietific point: Landsea’s point about uncertainty in the data record is the important scientific point.)
As far as my answer to Steve: I’m only saying that since I didn’t read the specific exchange with Eli or unnamed commenters at his blog, I don’t know precisely what was disputed. That means I can’t comment on their precise arguments.
@Ron Cram: 542
By using the example of GISS and CRU, I’m not making any judgements about the ultimate validity of their results. I’m agnostic on whether the groups actually suceeded in correcting correctly for the urban heat island, or any other features.
All I’m saying is that, those agencies do science, that data is used by science, and clearly both those creating the data products and using them try to consider uncertainty, and adjust historical records to account for any past deficiencies or systematic biases that have arisen over time.
Recognizing these possibility of these sorts of biases is SOP in science (and engineering.) If, as some here suggest, those who suspect this biases in Hurricane count data are ridiculed or mocked for misunderstanding the scientific processs, those doing the mocking are either being silly or disingenous.
(BTW: In my opinion, the fact that scientists believe data must be adjusted to correctly show the central tendency is evidence of uncertainty in the original data. Unfortuntely, while one might be able to do an best guess at the adjustment, this generally can’t eliminate uncertainty. )
@ Judy– Normally, moderated comments at this site appear as soon as you fill out the captcha submit and prove you were a human and not a spam bot. If your comment hasn’t appeared yet, it may never appear. I usually type in a text editor on my mac and then a paste into the comment box. IT’s less frustrating.
#540 Judy, I agree with your assessment of the data quality “issues” and realize also that the best track dataset in its current form is likely “all we got”. If a researcher is using ACE or PDI or any other seasonally integrated measure, then a bunch of baby storms or “Tiny Tims” could be missed and the annual accumulated measures would not care. Climatologically this makes sense, since the footprint that a minor tropical storm imparts upon the coupled-atmosphere ocean system is so small compared to a major hurricane plodding for a week across the ocean. So, for the weakest storms that were not detected, I do not think they even matter for long-term changes in hurricane activity.
However, if frequency is the metric you are using, i.e. TC counts, then the same weight is given to a 35 knot whirl as Hurricane Wilma, which does not make sense to me when you bring SST and global temperatures into the “fun with correlations” exercise.
Some more thoughts: why are we looking back into the 1940s and 1950s, when global warming and specifically Atlantic SST warming have accelerated so much during the past couple decades? I understand the complaints about not having a long enough dataset to deduce trends, but we have around 30 years of “good” global best-tracks, buttressed by satellite technology, model reanalyses, and aircraft/military recon. Yet, there is no trend in global measures of ACE/PDI/HDAYS/etc since 1981 (reasonable global satellite coverage data, e.g. Kossin et al. 2007). The current Northern Hemisphere (and Global!) TC inactivity is unprecedented since 1981. This statement has the same weight and veracity as saying: “Arctic sea ice is lowest on record” even though the record began in 1979. If the Atlantic is special, why?
I am more intrigued by the role of TC’s in climate rather than the effect of climate change on TCs. Both are important problems, yet one receives all the press and therefore all the research dollars. So, I think the TC/climate change answer does not lie in the historical best track dataset, but in a better understanding of how hurricanes work in the current climate.
some late breaking VERY IMPORTANT input to this discussion: new paper by Vecchi and Knutson, in press J. Climate, just posted
Click to access VK_07_RECOUNT.pdf
Very thoroughly addresses the “missed” storms (does not address double counted or subtropical storm issue)
Judy– Why the scare quotes?
These authors address missed storms– as logic and science both dictate when measurement techniques change. The find some storms were missed, particularly in the remote past. They don’t get Landsea’s number, but that hardly invalidates the larger point that one needs to address this issue when making conclusions.
As with all papers, it will take time for people to read and digest the results, but they took a stab at doing what was necessary. But the fact that this issue was addressed makes the paper much stronger than simply ignoring it, suggesting that asking is a stupid question or insisiting that those who ask about it don’t understand science. (Which, evidently happened based on comments here.)
lucia #554 huh? I think this is a good paper, and highly significant in this discussion on TC data quality. Its far better than the previous landsea and pielke papers that basically made assumptions about missed storms, rather than actually doing some analyses in the context of ship tracks, etc. Where did i suggest that people who ask such questions don’t understand science? I am asking such questions myself, see #540.
My guess is they are now noticing a lot more shorter storms that were missed previously, and still haven’t fully adjusted for that. If the current data were adjusted to have a continuous mix of storm duration, we would get further.
Re #552 Ryan, regarding tropical cyclones and climate, the usual focus is on their role in transporting heat towards the poles. I sometimes wonder if they also play an important climatological role in transporting heat and moisture upward into the lower stratosphere.
The occasional tropical thunderstorm overshoots and puts moisture into the LS. The tropical cyclones, though, would seem to do with more vigor and on a larger scale.
Stratospheric moisture, I believe, affects the chemistry, radiative properties and temperature of the LS, which in turn may affect all sorts of atmospheric functions.
Re #553 Judith thanks for the link. I look forward to reading it next week, along with the Saunders paper.
Re #556 MarkR my sense is that you’ve identified an important issue, and perhaps an explanation for the reported reduction in average duration.
Judy– Ok. It looks like we are now in general agreement.
I was thrown by the “scare quotes” on “missing”.
Scare quotes have a particular “meaning” at blogs, that suggest the person posting is using the word in some non-standard way. It’s a bit like using intonation. (See Autin Powers movies for use of scare quotes by Dr. Evil. The idea of surrounding words with quotes to denote the opposite meaning isn’t just blogs. I)
The “scarequotes” issue is sort of a convention– just as ALL CAPS is shouting.
You post here a lot, so I assumed your use of scarequotes was meant to convey something. (It would seem not?)
But, I suspect if you understand this whole “scarequotes” ambituity, you may understand whe I say The paper discusses the missing storms, not “missing” storms, and I was puzzled by your use.
On the other issue: comment about people criticizing those who ask was not aimed at you or meant to suggest you were one of these people. It’s in context of post by others. (For example, Mike B or Steve S who says others who have supposedly told them they shouldn’t ask these things because it’s unscientific. I have sometimes seen these comments– though not from you. So, sorry if it appeared I was suggesting you did.
That said,the “scarequotes” did throw me.
lucia, sorry i am totally oblivious to such blogospheric protocal and never heard of scare quotes, but i agree CAPS is screaming. but i think this is a pretty important paper tho, encourage you all to read (and it is free!)
Gerald, I am trying to track down the article you referred to
Jablonowski, C. and D. Williamson, 2006.
A baroclinic instability test case for atmospheric model dynamical cores.
Q. J R. Meteorol. Soc,
132, pp 2943-2975.
and can’t find it in webofscience or google scholar. do you have a web link? thx
also, do you have a specific paper by R Pielke Sr you are referring to?
Judy– It is free– which is nice. AND, you gave a full refrence and linke. (You cannot imagine how much I thank you on this.)
I skimmed the paper so far. I didn’t read it in depth. Jim’s 90 yo father and 89 yo mother, and two brother’s were invited for dinner and I’ve been cooking. So you can imagine I have have priorities other than to read the in depth this afternoon.
A quick skim suggest it’s a worthwhile paper.
Scare quotes are an, erhm, …. “issue”. Unfortunately, tone isn’t captured in comments, and I just sort of “jumped” to the “conclusion”… I think if I use these enough you may “get” the difficulties associated with unnecessary use of “quote” around “words”. When the person “speaking” uses them, “they” may seem to convey “nothing.” But the reader is put in the position of assuming that “missing” means something other than missing. Otherwise, what the heck are the “” there for? 😉
BTW– the opposite occurs. A user uses scare quotes to convey “something” and the reader, horror or horrors, thinks you are using the quotes … to suggest …. you are quoting someone. Go figure? 🙂
As a result “huh?” is often the good answer on blogs (and yet, so rarely used!)
The new VK 2008 paper is well crafted and should be a definitive reference on the storm counting madness.
Storm duration is a function of so many variables (lat/lon of genesis, proximity to land, time of year, atmospheric conditions such as shear, Saharan dust and oceanic conditions like SST) that I would be very suspicious of any trends/correlations reported without data quality mentioned.
#557, I agree. Hurricanes lift the tropopause and also mix quite a bit of ozone around. I have no clue about the amount of moisture injected upwards. I doubt the climate models have a clue how to deal with that since the TCs that they generate are usually cold core aloft.
re: 551
lucia,
You write:
I cannot agree that what they are doing is science. It appears to me to be pseudoscience. Phil Jones of CRU will not release his data, metadata, methods and code. Hansen and GISS make adjustments that are exactly contrary to what you would expect. Hansen has recently been forced to turn over some of his code, but he has been almost as obstructive to science as Phil Jones.
Despite the advanced degrees they have earned and the responsible science positions they hold, these are not scientists – these are people with an agenda. If they were really doing science, the process would be open and reproducible. Instead they remind me of the scene from Wizard of Oz – “Pay no attention to the man behind the curtain!”
Judith Curry (#561).
Your main library carries QJRMS and I believe they also have e-journal
subscriptions and electronic logons?
Jerry
bender (#404),
It appears that Gunnar has already lost all of his quatloos. 🙂
Jerry
Re # 561
Judith, you can find the paper on the personal website of the first author.
Gerry–
You are requesting people to read these papers. Judy is having trouble finding it. Rather than posting three comments in a row telling everyone on this thread you did various searches and found all sorts of references to early copies of the manuscript, why don’t you just provide the links you so easily found?
Or, since you are asking Judy to read this and write this as a favor to you, and you tell us you already have an electronic copy, why don’t you just attach the emanuscript in and send send it to her? She works at Georgia Tech and her email address is on this page. This sort of exchange for education or research probably falls under fair use, and should be fine.
In any case, since Judy may take some time to digest the paper, and you already think it’s interesting, why don’t you just post your own review for us to read? I’m sure we’d all find your thoughts beneficial even if Judy isn’t the one to do heavy intellectual lifting of posting the first review. You started encouraging reviews weeks ago. Had you just posted your own, the conversation would be well underway by now.
Judith,
A link to the paper Gerald mentioned is here.
This is the author’s personal page, which is also interesting.
Gerald, here are some comments on the Jablonski/Williamson paper. Thanks to Ron for providing the link and to Lucia for actually emailing the paper to me. The paper is very solid and well done; I don’t have any criticisms at all, so I will focus my comments on the implications of this for climate modelling. The ppt file is the more broadly useful document for those that don’t want to delve into the details but are interested in the motivation, punch line, etc.
This paper addresses the need for a standard suite of idealized test cases to evaluate the numerical solution to the dynamical core equations (essentially the Navier Stokes equation) on a sphere. Each modelling group runs through a variety tests to assess the fidelity of their numerical solutions. These include running idealized cases and comparing with an analytical solution, comparing with a very high resolution numerical solution, and testing the integral constraints (e.g. make sure the model isn’t losing mass). There aren’t any standard test cases used by atmospheric modelers. This paper argues that there should be, and further argues that there is much to be learned by using multiple models to establish the high-resolution reference solutions. They are not the first group to argue for this: the Working Group on Numerical Experimentation (WNGNE) of the World Climate Research Programme (WCRP) (has its roots in the World Meteorological Organization and the UN) has been (sort of) trying to do something like this for several decades. Maybe with leadership from Jablonski, this can happen.
The Jablonski and Williamson paper poses two such tests: steady state test case and evolution of a baroclinic wave. They consider 4 different dynamic cores, including finite volume, spectral, semi-lagrangian, and icosahedral finite difference. The main points are:
1) there is uncertainty in high resolution reference solutions, largely owing to the fact that a chaotic system is being simulation. Reference solutions from multiple models define a range of uncertainty that is the target for coarser resolution simulations.
2) In terms of resolution for the baroclinic wave simulation, they found that 26 vertical levels was adequate at a horizontal resolution of about 120 km. At resolutions coarser than 250 km, the simulations weren’t able to capture the characteristics of the growing wave.
So what do we conclude from this? Numerical Weather prediction models really need resolution below 125 km (note NCEP and ECMWF have horiz resolution at about 55 km). Climate models with resolution 250 km can reproduce the characteristics of growing baroclinic waves. Coarser climate models are not simulating baroclinic waves, and are accomplishing their transports by larger scale circulations. I did a quick search to see if I could find info on the resolution of the climate models used in IPCC, but didn’t find it. Many are in the 100-200 km resolution range. NASA GISS is about 500 km.
Owing to computer resource limitations, each modeling group has to make tradeoffs between horiz/vertical resolution, fidelity of physical parameterizations, and the number of ensemble members. The resolution issue is more complicated than the dynamical core issue, largely because of clouds (finer resolution buys you much better clouds). Does this mean that the solutions to climate models are uncertain? Of course. The IPCC and climate modelers don’t claim otherwise. Are they totally useless and bogus because they don’t match tests such as jablonski/Williamson with fidelity? Not at all. They capture the large scale thermal contrasts associated latitudinal solar variations and land/ocean contrasts; this is what drives the general circulation of the atmosphere.
Taking this back to the issue of hurricanes (the topic of this thread). Even at 125 km resolution, you are capturing only the biggest hurricanes, and at coarser resolutions, you aren’t capturing them at all. Nevertheless, the coarse resolution simulations capture the first order characteristics of the planetary circulation and temperature distribution. This suggests that hurricanes probably aren’t of first order importance to the climate system (the impacts are of first order importance socioeconomically). A dynamical system with 10**7-10**9 degrees of freedom can adjust itself to accomplish the unresolved transports, in the case of hurricanes probably by a more intense Hadley cell.
Gerald, I’m curious as to why you wanted me to review this?
572,
You lost me there. Why is the effect unimportant simply because it doesn’t show up on a coarse grid? I could understand that because they are few over the course of a year, that they might be unimportant, but why does the spacial grid size have anything to do with it?
thanks lucia. you get some quatloos from me for helpful offline (email) comments
#573 Larry, at a resolution of say 200 km, the models aren’t simulating anything that looks much like a tropical cyclone. Even without explicitly simulating tropical cyclones, the models manage to reproduce the main circulation features like rising motions in equatorial regions, trade winds, heat and momentum transport by midlatitude cyclones, the Asian monsoon, etc. This doesn’t mean hurricanes are totally unimportant in the climate system, just not of first order importance. They are probably of importance to the vertical transport of heat and moisture in the tropics and into the statosphere, horizontal transport of heat, moisture and momentum into the mid latitudes, cooling and ventilation of the upper ocean; although it has been debated whether these are local effects or project onto the large scale circulations. Kerry Emanuel has hypothesized that the thermohaline circulations are largely driven by hurricanes, but this hasn’t gained any traction. Does this help answer the question?
Re: #575
I remember Emanuel’s theory being given as a good news/ bad news scenario where the good news is that hurricanes will at some point with sufficient global warming become a negative feedback and the bad news is that that would mean more and higher intensity hurricanes — as in supercanes. I notice that the search for supercanes in the long past history continues.
Re: #556
Taken with other evidence of changing detection capabilities and finding this relationship after making what the authors assumed was a valid correction in counts would strongly indicate a further adjustment is needed. When I read this discussion above and again in the conclusion it appeared to me to be a show stopper that fits undercounts and is without any evidence or theory to relate it to some other phenomena. The authors seem to be reluctant to make the “leap’ in logic.
I think the use of a universally accepted Easy to Detect TC index for determining the historical record in the NATL is a long way off.
Judith Curry (#572),
I have asked Steve M to transfer the manuscript link (#571) and your review
(#572) to a new thread on the manuscript. I will then write a review of the manuscript so that readers can compare the two reviews in detail, one as seen from a meteorologist’s perspective and one as seen from an applied mathematician’s and numerical analyst’s perspective. The nice thing about this manuscript is that it compares different numerical models when only the unforced, hydrostatic system is approximated numerically at different resolutions. But there is more information hidden in this manuscript as I will discuss.
Jerry
The thralls are necessary to the game
Folks, let’s please be civil. Jerry tends to taking things very literally. If someone says they’ve read a paper, he takes that to mean they have read and fully understood it. Judith scanned the paper but in fact had not read it to Jerry’s standard. The previous spat between lucia and Jerry was a case where lucia did not take the time to go back over a thread’s history to locate a link to a paper. All three provide excellent commentary. But Jerry in particular has a message that is *very* interesting and, I believe, important. He tends to be impatient with people who won’t try hard to follow his arguments. I can’t imagine being his grad student 🙂
Nobody has a ton of free time in today’s world. Let’s try to be forgiving of people who won’t scan through a ton of blog noise, or scrutinize every single paper they come across, or take the time to point out where someone cited something.
Jerry, I’m with the consensus here. There’s too much information in this world and not enough time to expect people to ferret it all out. Right now, I’m trying to figure out how to use a chip called the Cypress PSoC. Great piece of hardware, but the documentation and the forums are all like this:
I really want to use it, but they’re not making it very easy for me.
The objective shouldn’t be to make things more difficult and arcane, but less. One of the central themes of this blog is how the climate scientists tend to keep things within the tribe, and not archive the data in an open way. Similarly, I don’t think anyone should be expected to chase rabbits if it’s not necessary. There’s just no point in this kind of approach.
Half time.
C’mon folks, how hard is it to be civil? Everyone count to three.
Hi Judy (#555)- Our paper (Pielke/McIntyre) made no such assumptions about “missed storms” as you have suggested, nor has any other paper that I have been involved in. We point out that the increase in NATL activity has occurred in the eastern part of the basin, and several other interesting spatial anomalies. Please be accurate when characterizing others work, especially when you do so in a negative manner. Thanks!
Roger–
Judy was answering me. In context, I don’t think she meant you made unwarranted assumptions. I think she was actually endorsing you and steve as examples of scientists who do assume some storms were missed as opposed to stubbornly insisting none could have been missed. I know jumping in later and skimming what went on before and after, Judy’s wording doesn’t read that way, to you. But, if you read the exchange between the two of us, I misunderstood her, she misunderstood me, and we finally got that sorted out. you might see what was going on in that particular exchange.
(Yes, I’m aware of the even larger framework of conversation. But in this particualr comment, she wasn’t criticizing you for making assumptions. Everyone makes assumptions. I see assumptions in this newer paper.)
Thanks Lucia, Perhaps Judy could clarify what she meant. Steve and I made no assumptions about missed storms one way or the other (unlike what Landsea did), we simply noted that basin-wide trends are different according to location, and we suggested that this needs to be accounted for in analyses some way or another.
Here is clarification on the comment re Landsea and Pielke papers. Both papers discuss potential undercounting of North Atlantic TCs. Landsea bases his argument on changes in observing technologies and density, and assumes that that total basin TC counts should look like landfall counts, and comes up with specific estimates of undercounting. Pielke and McIntyre (unpublished manuscript, plus extensive blogospheric discussion on climateaudit), based on analysis of trends in TC counts in the east vs west Atlantic, infer the possibility of undercounting in the earlier part of the record owing to lack of observing density in the east atlantic. Landsea and Pielke are correct to raise the issue, however the Vecchi analysis addresses issues that were raised by both Landsea and Pielke in a quantitative way that is much more defensible than Landsea’s quantitative analysis
Some further comments on the Vecchi paper (note these are made by student #2 from the fall 06 hurricane seminar class, if anyone remembers 🙂
I think this is a very thoughtful paper which does a good job highlighting
the discrepancies amongst the different proposed correction schemes and
variations in trends seen. There were a few items that caught my eye as
concerns:
1. They use subtropical storms – in the end of all this I guess the question
will become why to include or not include these storms. It is very feasible
in a rough estimation that in proposed increase in storms added could be
offset by properly removing subtropical storms that have been included but
not properly identified. I understand why they chose to include them, but
given the very different nature of STSs, not sure it is the right choice.
2. Validation of criteria – they do not attempt to verify if there is a
closed circulation and/or if a system is non-frontal. Tough to say the
influence they may have, but given that the analysis does not show what time
of year the additions occur, there is no way to say how many of the proposed
additions occur during times of the year when one would expect gale force
winds from non-tropical systems.
3. Assumptions – 7 and 9 really caught my eye. Particularly 7, which makes
a huge assumption about formation location which they actually talk about
may be flawed later.
#7: We assume that moder day TCs are representative of the TCs in the past, in terms of their number and location. This assumption would tend to make the adjustment err against any real trend in TC counts. If the modern era is in fact more active than the early period, the storm adjustment will be biased high. Alternatively, if a negative trend in storm counts existed the adjustment would be biased low.
#9 We assume that single storms have not been counted as two separate storms in the Hurdat database. If double-counting occurred, it would tend to bias our adjustment high
Re: #583
I do not agree. The Vecchi analysis, while an improvement over the dumb ships theory or the theory of past detections being as likely to be over counted as under counted, depends on the assumption excerpted from the paper below wherein the ship is idealized as a platform but remains dumb as to avoiding a TC.
The Landsea, Pielke, McIntyre and other Easy to Detect Storm observations are much simpler and to the point in indicating past and changing detection capabilities.
Given the Vecchi correction scheme assumptions and potential resulting weaknesses, the authors certainly do not hide those potential weaknesses, as evidenced in the excerpt below, that:
1. The TC count trend is not statistically significant from 1878-2006.
2. Trends taken for sub-periods over this time span can be greatly influenced by the apparent cyclical nature of TC frequencies.
3. Duration of corrected storm counts shows a very significant statistical decreasing duration with the obvious possible explanation being that the Vecchi corrected counts need further adjustments to correct for under counting.
As I think I stated somewhere before, the subtropical storm designation issue is a second order issue only after other assumptions have been made.
First, is the frequency of all tropical storms (like Holland and Webster 2007, or new Holland category 5) an operative metric to use for climate change correlation studies (SST, NAO, ENSO, etc)? If this is accepted, then the definition of a tropical storm is important, as well as accurate diagnosis of its intensity.
Second, the structure of a subtropical storm is sufficiently different/same as a tropical storm to count/not count. Subtropical storm genesis can occur in a few different ways, maybe a decaying or cut-off cold-core low or an occluded extratropical cyclone in a low-shear, warm SST environment. Shockingly, these storms occur in the subtropics usually from eastward propagating disturbances, unlike westerly traveling African Easterly waves. It seems to be a fundamentally different mode of development.
Yet, the footprint that a subtropical storm may have on the atmosphere/ocean system in a climatological sense may actually exceed that of many wimpy 35-40 knot Tiny Tims, mainly because subtropical storms have a much larger spatial scale (they came from decaying large-scale troughs). So, again we get back to the issue of whether Wilma should get the same importance in a climatological sense as Gert 2005 or Tropical Whirl Erin 2007.
Thus, Judy’s student’s point number 7 actualy dovetails with my reluctance to accept frequency as an accurate indicator of long-term changes, even if we didn’t have so-called data issues.
Judy, I would be curious about your musings on point #7, sounds like an intriguing thread.
Ryan, the different indicators (frequency, intensity, duration, ACE, PDI) tell you about different aspects of TCs, and each have different sensitivities to the observing system.
The challenge with subtropical storms (apart from their identification) is that what physics and thermodynamics we do include into genesis parameters, seasonal forecasts, etc. relate to tropical cyclones, not the aberrant subtropical storms that form from different mechanisms.
Subtropical storms are interesting in their own right, but ideally the would be separately considered in any analysis of trends, genesis, whatever.
Re #7, their analysis method is pretty complicated, would need to sort through it carefully to really understand the impact of #7. But I would say #7 would seem to diminish the utility of what they have done for any kind of trend analysis
Kenneth, you would be surprised how hard it is for a ship to get out of the way of a hurricane, especially if it is not forecasted correctly (or at all). We work with several shipping route groups in helping them plan around TCs in the Pacific and Indian Oceans, and they often get into trouble (mainly by not asking us for a forecast in time :). So without satellites and forecasts, it is pretty easy for ships to be dumb.
Here’s a “dumb ship” story, an email i received on 1/27 from a ship router regarding the Indian Ocean:
I always find it interesting to see systems designated as “invest” and then suddenly appear out of nowhere as a cyclone days later without discussion in bulletins from the JTWC, etc.
The tow is moving at 5 knots and couldn’t get out of the way with a strong tailwind.
We now have Fame magically appearing off Madagascar,
Cyclone 14S at 62E.
Although NOAA isn’t yet posting it on their sites, the satellite centers now tracking Invest 90s in the vicinity of 80S / 10S. Guess where my tow is located?
the most insightful description i’ve seen of observing hurricanes ca 1900 is in this book:
Isaac’s Storm: A Man, a Time, and the Deadliest Hurricane in History (Paperback)
by Erik Larson (Author)
The book is about the Galveston hurricane, and has two main focal points: the hurricane itself; and the human drama of Isaac Cline, the Galveston meteorologist who failed to predict the intensity of the storm and the “hubris” of the Weather Bureau at the time in belittling the Cuban forecasters and all the infighting and intrigues (seems like ongoing ruckus from National Hurricane Center has long heritage). A fascinating book, lots of drama and human elements, but from our perspective also makes us understand the issues of observing and correctly categorizing hurricanes back then.
Re: #586
And once they realized they are or might be in trouble, if these ships directors spent time making precise storm measurements, I would have to say those ships and their sailors were, real dumb. The other part of that theory/conjecture that would be necessary to put into the realm of pure theory would be that sufficient numbers of dumb ships roamed the oceans to be dumb to almost all the storms that in modern times would take satellites to detect and measure.
There are many interesting thoughts on this thread which I hope to explore later this week, once my schedule clears and I’ve properly read the two papers.
For the moment I’d like share a couple of observations on subtropical storms. I do think they are an important issue because, since they started being included in the record in 1969, they have added about 0.5 storms per season to the record used by Vecchi/Knutson. Prior to 1969 they were excluded from the record.
Vecchi/Knutson report an estimated storm trend of about +1 storm per century (based on my speed-read). Their inclusion of the 22 subtropical storms in the second half of the century, and none in the first half, plays a notable role in that reported trend, I imagine.
The time series of Atlantic subtropical storms in the HURDAT database is here .
The second point has to do with detection of subtropical cyclones by surface observers. Subtropical storms are structurally different in that their rain and strongest winds are away from the center (among other differences). Tropical cyclones, on the other hand, have their strongest weather near their centers.
Here is an image of 2007’s Subtropical Storm Andrea near its peak intensity. I’ve added an imaginary ship traveling from X to Y and written what I think it would encounter.
My impression from reading the old issues of Monthly Weather Review is that the forecasters looked for (1) strongest winds and rain near the point of lowest pressure and (2) evidence of strongly veering winds near the time of max winds. They also looked for classical indicators (low barometric pressure, warm latitude, a discernable path based on multiple reports and so forth).
Based on these criteria, weather reports from the imaginary ship would likely have not been considered to be a tropical system and thus Andrea would have been ignored in earlier decades.
And a quick comment on storm duration. Here is a map of storms lasting 24 hours or less, 1885-1965 (about 80 years).
And here are the short-lived storms from 1966-2007 (about 45 years). (I missed a red dot for Olga, which came and went in December after I made the map.)
These affect the seasonal duration averages. My rough guess is that if one removes those, then the average storm duration increases by about 0.5 day in the final 40 or so years of the time series.
If one includes them, then one should work on a “TexMex” explanation that explains why they are occurring in the last 40 years, but hardly before then, along the Texas and Mexico coasts.
I suggest that detection, not nature, is the major player in the change.
But, if the increase is real, then the “so what” question arises. These are weak, small and short-lived and of little consequence except for rainfall.
#577
Although to be fair, as I recall, Jerry was uncharacteristically and unhelpfully evasive. I think he might have taken lucia too lightly at first. Either way, I doubt it will happen again.
[Apologies for the superfluous commentary, folks. Just wanted to express my neutrality and my thanks to lucia for reffing. Her judgement is well tempered.]
Carry on. Back to science.
Here is the time series of short-lived storms.
It’ll be interesting to see what Vecchi/Knutson plot looks like if these short-lived storms and the subtropical storms are removed.
Re subtropical storms
there are two different groups that have done climatologies, and have found different results. Clearly we need to do a better job on this to sort all this out. Also, there is pretty much no way to extend this kind of analysis back before 1950.
Guishard et al. (no pdf available, unfortunately) http://www.springerlink.com/content/g3837470v7241217/
Click to access 107868.pdf
Roth http://ams.confex.com/ams/25HURR/techprogram/paper_37402.htm
Here is an informal analysis that was done by one of my students:
Guishard and Roth had different results. From 1957 to 2002 they identified
53 and 95 subtrops respectively. They only overlap on 26 storms or roughly
half of Guishard total.
For the roughly 10 years before NOAA officially started naming subtrops the
results for Guishard were (note: AL is atlantic coast landfall, FL is peninsula landfall, GF is gulf landfall, CA is central America landfall, IL is caribbean island landfall, None is open ocean).
AL FL GF CA IL None
3 2 3 4
and Roth
AL FL GF CA IL None
1 6
As you can see Roth tended to identify more open water system compared to
Guishard.
When comparing for the NOAA also years, 68-02, For Guishard, Roth and NOAA
the totals are 43, 89 and 22 respectively. They breakdowns over this period
for Guishard are
AL FL GF CA IL None
4 5 1 3 32
and Roth
AL FL GF CA IL None
8 10 7 8 60
In each case about 2/3 of the identified systems remained over open water.
As you can see, Roth shows a more even distribution whereas Guishard has
more for AL/FL.
bender (#592),
Citing specific references at the beginning and thruout the thread and providing mathematical examples to explain specific points is not being evasive. In the review of the Jablonowski manuscript, all points and references will be included in one comment so that intervening noise
can’t be used as an excuse for not finding the references.
Jerry
I would like to review some of the content and methods used in the Saunders and Lea letter to Nature, linked above, primarily because what I see seems to be a reoccurring theme in some of these climate science papers. I hope I can get some statistical feedback on the observations and analyses I make here.
The authors use the August-September SST from the Main Development Region (MDR) for NATL TSs and correlate it to unadjusted named storm, hurricane and major hurricane counts and the ACE index for the period 1965-2005. They also modeled the storm measures using both SST and an atmospheric wind field. I want to deal primarily with the SST to storm measure correlation and then say a few words about the authors’ derivation of the area from which the wind field was taken. I do not necessarily agree that no adjustment in storm measures should be made for this period as the authors suggest, but that is not my point of contention that I attempt to make below.
The authors show some strong correlations between seasonal storm measures and Aug-Sept SST in the MDR. When I attempted to reproduce the authors’ correlation I discovered that their correlations are based on 10 year moving averages for SST and storm measures. It would appear that authors have zeroed out some low frequency factors such as AMM or ENSO or AMO by making the correlations with 10 year MAs. I do think that on first glance this MA correlation can mislead with the high R^2s computed as it neglects the cyclical effects of the climate on storm measures by inflating that for SST (and wind fields, for that matter).
In testing the sensitivity of the SST to storm measure relationship I calculated correlation R^2s using 10 year MA as the authors did for August and September and then did the same calculations for annual correlations for both Aug-Sept (AS) and the more commonly used Aug-Sept-Oct (ASO). My thinking on this matter is that any correlation over a reasonable range of SSTs should remain relatively constant over time as the essence of the relationship must be the seasonal SST and the seasonal storm measures, i.e. there is a new starting point beginning each season (year). To test that sensitivity I used 1965-1990, 1950-2005 and 1950-1990. The results are listed below:
1. Using 10 Year MA for SST (AS) and storm measures starting with the period 1965-1974 for the year 1974:
R^2 for Named Storm Counts = 0.72. R^2 for ACE = 0.85. Trends were positive in both cases.
For the period 1965-1990: R^2 for Named Storm Counts = 0.37. The trend was negative.
2. Using annual SST versus annual storm measures for period 1965-2005:
Using AS SST: R^2 for Named Storm Counts = 0.42. R^2 for ACE = 0.52. Trends are positive.
Using ASO SST: R^2 for Named Storm Counts = 0.43. R^2 for ACE = 0.48. Trends are positive.
3. Using annual SST versus annual storm measures for period 1965-1990:
Using AS SST: R^2 for Named Storm Counts = 0.22. R^2 for ACE = 0.19. Trends are positive.
Using ASO SST: R^2 for Named Storm Counts = 0.10. R^2 for ACE = 0.11 Trends are positive.
4. Using annual SST versus annual storm measures for period 1950-2005:
Using AS SST: R^2 for Named Storm Counts = 0.31. R^2 for ACE = 0.30. Trends are positive.
Using ASO SST: R^2 for Named Storm Counts = 0.30. R^2 for ACE = 0.25.
5. Using annual SST versus annual storm measures for period 1950-1990:
Using AS SST: R^2 for Named Storms Counts = 0.03. R^2 for ACE = 0.04. Trends are positive.
Using ASO SST: R^2 for Named Storm Counts = 0.07. R^2 for Ace = 0.03. Trends are positive.
While the authors selected their 1965-2005 period based ostensibly on that period using accurate satellite reporting, the “good” period other authors have selected is frequently different. The period that I chose for my sensitivity test were selected based on my peeking at the end results and choosing periods representing those with likely poorer correlations. Nonetheless all these periods had a similar range of SSTs and if the correlation should be at the yearly level and not something trending over a long period of time then I think the sensitivity tests show that other factors are operating here, either cyclically and/or confounding, that can overwhelm any SST versus tropical storm measure relationship that might exist.
I excerpted the following passage from a note on how the authors selected the areas for the wind field measures that went into their model. If I read this correctly I think they are fitting their model more by data snooping and than any a prior reasons. I might be wrong and would like to see what others think of this passage.
I would think that a more appropriate model would use any reoccurring ENSO like phenomena, SST and wind field (if it added explanatory power) based on annual inputs. And of course I would use an Easy to Detect storm measure for correlations/regressions.
David Smith,
Here is V&K figure 1 with the subtropical storms removed. Graph. Here is a link to the spreadsheet of data I used. 1876-77 are included only for the start of the 5-year mean.
Reduces their trend about .6 storms per century. Couldn’t graph one day storms. Couldn’t find any. Graphed two day storms and it looks basically similar so I won’t link it. That did reduce the trend another .2 per century.
I also put a yearly summary spreadsheet of the Atlantic database up on Google docs. It includes storms, tracks, ACE, and mean SST for the individual track dates and locations. Used Reynolds ersst v2 monthly for that. Also includes sub-sets for 2 day or less storms and subtropical storms.
Figure people might find it useful.
Kenneth Fritsch,
I’m with you about fitting. Why compare two months SST to entire seasons of storms?
There may be a relationship between SST and storm intensity or quantity, but I don’t think it is simple to perceive. I suspect it might be due to local air temperature and humidity gradients relative to SST rather than SST being the key component. In any case, I don’t think the data quality is good enough at the present time to discern such a relationship with clarity.
Steve M, could you start a Hurricane 2008 thread, as we’re approaching 600 posts here.
My suggestion is to transfer #553, #563 and posts from 583 onwards to the new thread, for continuity.
Thanks
Re #597 Thanks Bob. I’ve just started reading the two papers in detail and am looking at some of the Vecchi references, so I’m still in the orientation phase on all of this.
The Vecchi Figure 5a shows Atlantic storm count after the Vecchi/Knutson adjustment. I wondered what Figure 5a looks like with (1) subtropical storms removed and (2) short-duration (24 hrs or less) storms removed.
The answer is here . The trend drops to +0.3 storms per century (noise level).
Why exclude subtropical and short-duration storms? The subtropical storm issue has been discussed on CA. On short-duration storms I suspect that Vecchi’s KM2004 doesn’t work properly for short-duration (=small, weak windfield) systems, but I need to read the original work before arguing that point.
Re #596 Good points Ken. A fair question to ask is why, if the SST/storm relationship is strong, does the reported correlation drop so much if the period 1990-2005 (or 1995-2005) is excluded.
#595 If I say I agree, Jerry, I’ll be back in the crossfire. I am going to have to back away from this one and let the ref do her job to the best of her ability. Always enjoy your posts.
David,
I’m confused. I suspect you mean 48 hour storms, since the only 24 hour or less are pre-1871 and discovered near hurricane speed.(34 of them) That’s why I couldn’t find any from 1878 on. If you really mean 24 hour, how did you arrive at the count?
Look at my spreadsheet summary in comment #597 for the 2 day or less storms. All storms post 1870 are 5-8 tracks. In your comment #593 your time series graph should match my spreadsheet if you meant 48 hours. I don’t have the 2007 data yet though.
bender (#602),
Understood. I hope you are reading the comments on the new thread.
The nice thing about the dynamical cores is that they are much less complicated and still will make the point that needs to be made.
In mathematics, there is a theorem that says that if you can solve the
inhomogeneous (unforced) PDE system, then there is a formula for the solution of the forced system. Thus we only need understand the problems with the unforced system. I will show how this applies after the problems in the unforced system are revealed. 🙂
Jerry
Re #603 Bob I’ve caused the confusion – when I refer to 24 hour or less storms, that means 24 hours or less at storm-force (35 knot and higher) winds. I don’t count a system’s time as a tropical depression, wave or extratropical system.
An example is tropical storm Erin (2007).
Short-duration storms typically have immature, ill-defined wind fields which are small and weak and sometimes already interacting with land. They may have a 50km by 100 km-wide band of squally weather on the northeast side and that’s about it. The storm center shifts around as it tries to organize. It’s a mess which usually takes modern tools (aircraft carrying GPS dropsondes and wind-detecting radar, buoys, oil rigs, shore-based doppler radar, etc).
There are also special problems such as proximity to the US, which can make the forecaster err on the side of declaring a system to be storm-strength so that people take it more seriously. In the case of the near-Mexico storms, coastal geography (mountains which funnel north winds) can create a small band of storm-force winds.
My current question is how does the KM04 approach handle such micro storms. At first glance it looks like the minimum diameter KM04 uses is 160km by 160km. How do they handle a system that’s one-fifth or one-tenth of that area?
After a second reading of Vecchi and Knutson in the J. Climate 01/03/2008, what caught my attention is the precautionary nature of the authors’ message about the results and conclusions that can be obtained using (corrected) NATL TC data. While the authors make what sometimes appears to me to be an the obligatory discussion in papers like theirs of the recent trends in SST with the proper references, including those from the IPCC, to AGW and the accompaniment of increases in TC measures, the results presented are in line with observations of no long term trends in storm activity from easy to detect storm indexes. They give a comprehensive view of the measurement methodology that needs to account for the multi decadal variation in storm measures, corrections for historical undercounts, the sensitivity of starting points when looking for trends and further analyses of their methodology that provide additional precautions as to its potential limitations.
There is, however, an observation they make about the shifting eastward of the NATL TC activity that I think bears more discussion in this thread. From the excerpt immediately below one would surmise that for their correction method to work properly they have to assume that no changes in the spatial distributions of storm track density over time. If that were the case, it would seem to indicate that an index of easy to detect storms might be a simpler and more straight forward approach to indicating trends in NATL TC storm measures. What I have derived from the proposed easy to detect storm measures that have been discussed on these threads is that they have invariably not shown a statistically significant decrease in storm measures but rather a more or less flat response over time.
If one found that the easy to detect TC indexes did go down significantly over time while the other excluded TC measures went up, then one might attribute at least part of what they were seeing to a change over time of the genesis of NATL TCs. This is essentially what the authors are suggesting in the excerpt below, at least for the west to east changes that they attempt to show in a trend map. Those maps are difficult for me to read in sufficient detail to draw any conclusions. I was frustrated by not finding any statistical analysis of the east to west trends in this paper. It is this point that I would like to see discussed and analyzed in more detail in this thread.
Re #606 Kenneth you raise an interesting subject, as usual. My conjecture is that part of the explanation lies in changes in how the early HURDAT construction effort handled the initial stages of systems. Specifically, how they determined when a disturbance reached storm strength (35 knots).
For background, it may be good to glance through the Unisys map database and look at the western basin storm tracks. Pick some of the pre-1945 maps and look for green (tropical depression stage, which doesn’t count in the Vecchi analysis because the winds are too weak). I think you’ll see very little green in the beginning stages of the western basin storms. Then, take a look at maps in the modern era, where green is much more apparent.
In the early HURDAT years the data was sparse and the analysts took a best guess as to where a disturbance became a storm (turned yellow on the maps). They didn’t even try to estimate the depression-strength stage. In the modern era we have much better tools and can find the transition points (green to yellow) much better. (We can also find fluctuating systems today, whereas in the olden days that was mostly a guess.)
My conjecture is that, in the early days, they tended to trace the path of a storm backwards as far as possible and assume that it was of tropical storm strength throughout that path. They thus tended to overestimate the tropical-storm strength period.
If this (systematic errors in estimating the date of transition into a tropical storm) then there will be a tendency for storms in the early periods to have longer reported durations than in the modern era. I think that’s one of Vecchi’s findings.
There may other ways to check this conjecture, perhaps involving the time taken to transition from tropical storm to hurricane or maybe the use of a different windspeed (say 65 knots instead of 35 knots) as the filter, which I’ll think about.
Re: #605
From Post #230 in this thread we have the Bob Koss graph (posted below) showing the trends for ACE east and west of -60w longitude for the past 100 plus years. Vecchi and Knutson would appear in their paper to be indicating, at least to me, that the red west trendline should down and not flat as it appears in the Koss plot.
Why the difference? It bears much weight on using Easy to Detect TC measures as proxy for NATL TC activity.
Bob Koss, if your Storm-O-Matic map maker is available, and you’re willing, could you replicate Vecchi Knutson Figure 8 ( here ) for the period 1945-2006 ? VK did 1878-2006 but I think it would be interesting to see if the same trends hold in the recon (1945-current) era. Thanks.
If this doesn’t easily fit your program’s capability no problem, please don’t do a special effort on this.
What I think we’d see are much weaker, if any, trends in the western basin.
Kenneth,
RE: 608
V&K used a count of all storms including 22 subtropicals. My Ace data is based on only cyclonic storm tracks with winds of 34kt+. Same as NHC. All other tracks are excluded. So, 25% of the entire database since 1851 is excluded. The exclusion is also heavily weighted toward the last 40 years.
Those other tracks include cyclonic less than 34kt, (S)ubtropical, (E)xtratropical, (D)epression, (W)ave, and (L)ow. There are thousands of them in the database. There are no S-D-W-L tracks recorded prior to 1968. E type tracks date back to 1862. Most storms have a mix of track types. Heavily extratropical near the end. The others mostly near the beginning.
I guess it depends on how you look at it. Have they become more accurate in describing the track type? Or have they simply added more tracks that would have been ignored even if spotted in previous years? I think a few tracks in the early years might have been designated a different track type if they had the current observational ability. Not very many though. Most of the track types apply mainly to low wind speed. Not very many low speed tracks were even recorded early in the record.
V&K mentioned several choices of reasonable starting years, but neglected what I consider to be a significant one. 1886 was the year they became confident enough to move from recording in 10kt wind speed increments to 5kt increments. They also recorded the first sub-30kt track that year.
David,
I see said the blind carpenter as he picked up his hammer and saw. 😉 Thanks for straightening me out on how you did it. Now that I know, here is the graph you were looking for. No subtropicals and no 24hr or less cyclones.
Did up a graph similar to your weakling time series. There are some differences. You might want to do a recheck. Here is a link to a spreadsheet from 1851-2006 for those storms.
I’ll look into your request if I get a chance tomorrow. See what I can do.
Tropical cyclones typically progress from depressions (winds under 35 knots) to storms (winds 35 to 64 knots) and then to hurricanes (winds 65 knots and higher). One question that can be asked is, “How long does it typically take a cyclone to go from 35 knots to 65 knots?” A related question is, “Has that changed over time (per the database)?”
The first question is interesting on its own merits while the second can shed some light on the quality of the data. (As mentioned earlier, I think that the older data exaggerates the time that a new storm was at tropical storm strength, a systematic error which contributes to the pattern shown in VK Figure 8 and also to the odd storm duration pattern shown in Figure 7c.)
To explore this, I plotted the times it took cyclones to go from 35 knots to 65 knots in the twenty-year period 1986-2005 (“modern era”), which is shown here . I was surprised at how relatively orderly the data behaved. The average period was 47 hours.
Then I did the same exercise for 1880-1899 (“When-Nipper-was-a-pup era”), shown here . The data flattens, lumps and spreads vs the modern era, with an average of 62 hours.
For ease of viewing I used a 3-yr smoothing and overlaid the two series on this plot .
This broad-brush exercise indicates to me that, indeed, there is reason to be suspicious of the Nipper-era data. Also, the change in patterns are directionally consistent with over-estimation of the early stages of a tropical cyclone.
Such an over-estimation can account for a noticeable part of the Figure 8 pattern, because the over-estimation would have been in the western basin (that’s where the reported storms were).
What’s the magnitude of this? Well, if the Nipper storms were 6.5 days in duration, which included a 0.5 day error (62hrs-47hrs, rounded down) which was corrected in the modern era, then the track density would drop by 5 to 10% (modern era vs Nipper era). I think that could account for a chunk of the western basin pattern in Figure 8.
Re #612 I used special rules to handle a small number of odd storms in the database, which I can list if anyone wants. The mainly had to do with storms that fluctuated in strength (depression-wave-depression) in their early existence.
David,
Decide to take the time to check a couple cells in figure 8A. I checked the extreme violet cell just off the western tip of cuba. Looks to me to be 22.5n-24.9n by 87.5w-85.1w. The average storm days per year for time period is only 0.38 days. Made me wonder how the trend could be between (-0.5 and -0.6 days per year) per century.
Checked the most red cell in the mid-atlantic. Appears to be 32.5n-34.5n by 52.5w-50.1w. That has an average storm days per year of 0.38. They have a trend between (+0.4 and +0.5 days per year) per century.
I have no idea how they came up with those trends. More than half the years had zero storm days. Here’s a graph of those cells.
It will be some work to do what you want, and the above graph compared with their cell figures, hardly seems worth the effort.
Arrrggh.
Put the wrong figure in for average storm days per year in the mid-atlantic cell. Should be 0.15 per year average.
Re my previous review of the Wang and Lee paper, that was posted a week or so on this thread. I reread it yesterday, and it is positively dyslexic in terms of writing decreasing shear when i meant increasing shear. I now understand the cause of the dyslexia, it was cognitive dissonance of not correctly assimilating that they are saying wind shear has been increasing the North Atlantic (from observational data of the past 50 years or so). Everyone else has found that it is decreasing wind shear.
See especially this paper by Goldenberg, Landsea, and Gray:
http://www.sciencemag.org/cgi/content/abstract/sci;293/5529/474
Also Hoyos et al. from the Georgia Tech group:
Click to access Hoyos_Science312.pdf
I was on the Barometer Bob podcast radio show last nite discussing the wind shear issue and some of the broader hurricane/climate change issues, here is the link if anyone is interested
http://www.barometerbobshow.com/podcast/index.php?id=152
RE #614 Thanks, Bob. No need for further effort. Much approeciated.
I finally read the Kimball Mulebar (KM04) paper which Vecchi Knutson (VK) used. I’m reasonably sure that the KM04 data used by VK is not applicable to newly-formed storms (KM04, as used by VK, overestimates the size of the new storms).
New storms have irregular, asymmetrical windfields, often small and closely connected to one squally area. Typically the center is at the west or southwest edge of the precipitation, which adds to the asymetry problem. It takes time for the precipitation and winds to “wrap around” the center and for the pressure envelope to expand. These problems are compounded if the storm is near land and part of its circulation is already ashore.
Consistent with #594 and #600, in my opinion it’s appropriate to either drop the short-duration storms from the analysis or develop special sizing rules for short-lived systems. I’m looking for the data mentioned by KM04 and see if I can extract and characterize the short-duration storms.
The other option, removing the short-duration storms (and subtropical storms), gives this result , as shown previously in #600. It’s basically no-trend in Atlantic storms.
That trend is pretty close to the US landfall record and to the Easy Detect (near-land including islands and which covers almost 70% of Atlantic storms) record.
Judy #616, I am also somewhat baffled about the claim of increasing vertical wind shear in the MDR, but upon careful reading of Wang and Lee, I see where they come up with this “regressing” result. Again, if you believe in the NCEP reanalysis, which I do not prior to 1979 for marine analyses of temperature and winds (for very simple data assimilation reasons), then the vertical wind shear in the MDR since 1948 has exactly zero trend when each month is plotted. This can be verified in about 2 minutes with the freely downloadable NCEP monthly wind data and 10 lines of a GrADS script.
However, when you average June-November wind shear, which is a rather long time period, since SST’s in June are poorly related, if at all, to SSTs in November, you do see some long-term variability (attached image link). Since about 1980, averaged wind shear has decreased about 3-4 knots over the MDR. This is against an average shear of about 25 knots, so a 20% reduction, which could be meaningful with all else being equal. However, according to the NCEP reanalysis piror to 1965, which I don’t suggest believing, the wind shear was 15% lower than it is today.
NCEP Wind Shear (Wang and Lee 2008)
Thanks, Bob Koss and David Smith for explaining the differences in the Easy to Detect TC index east and west of -60w and the Vecchi/Knutsen maps.
The asymmetry problem in detecting TCs was assumed not to be problem in Vecchi/Knutsen correction methodology, but the authors made it clear that it could be one – or at least as I recall.
I must admit that I really enjoy these analyses and particularly when I can lean on others for their detailed knowledge and insights on the subject matter. I missed getting these replies while the blog was shutdown yesterday and that will drive a retired man between projects crazy.
Ryan, if Wang and Lee are correct in that wind shear has been increasing, the elevation of TC activity since 1995 would really be astonishing, the inference being that SST increase has a much greater impact than we are currently inferring, if it can overcome an increase in wind shear.
Re: #620
Call me confused.
620, 621 On behalf of STAG I can only say that is really staggering,
Judith, you got us all there!! You or we got that diagram upside down???
Ok here is what i am seeing from the wind shear diagram. I see the impact of the AMO, with low wind shear in warm periods (1950-1964 and 1995-present), with higher values in intervening period (cold phase). Assuming that wind speeds before 1979 are ok (ryan thinks they may not be), all we are seeing is the effect of AMO on windshear, nothing to do with global warming or SST. This is my take on it. If the data went back to the 1930’s, which is arguably the analogue for the present period in terms of AMO and PDO, then we could possibly filter out AMO and see if there is a signal from SST.
A wind shear map, with a comment, is located here .
It has been postulated in the literature that there is a relationship between (1) the strength of this trough (and the related wind shear) and (2) the mean sea-level pressure (SLP) over the western Caribbean. The weaker the trough and wind shear, the lower (on average) the SLP in the western Caribbean.
What does the western Caribbean SLP time series look like? Check here . Looks like a pronounced shift in SLP around 1995.
The SLP shift correlates as well with ACE as does MDR SST.
Does the increase in ACE (hurricanes) cause the drop in SLP? That’s been checked (Knaff?) and found to not be the case.
Does the increase in SST cause the drop in SLP? Well, if that’s the case, then I’d expect to see a pronounced cycle in SLP as SST varies across the year.
Something to ponder.
Re: #624
David, I found that the seasonal summaries in the link below cover some of what you introduced in your post. The 2002 summary by Bell, Blake, Landsea et al seemed to me to cover it best and I would guess that it remains relevant today.
http://www.cpc.ncep.noaa.gov/products/outlooks/hurricane-archive.shtml
They discuss the 200-850 hPa vertical shear of zonal wind and they have a historical graph of the shear up to 2006 (in the 2006 summary) for the MDR during the AugSeptOct seasonal period. They also present the historical ACE indexes and show the multi-decadal variations.
All this brings me back to the Saunders and Lea paper that was discussed in posts earlier in this thread where they talked about the vertical wind shear for 200-850 hPa for the Aug-Sept seasonal period and gave a correlation for it against TC measures using 10 year MAs. They failed, however, to show the historical variations for 200-850 hPa, but did so for the SST, TC measures and the 925 hPa wind field. They also indicated by my reading of their description that they selected the area for the correlation with 925 hPa wind field by iterating the area that gave them the best fit for their model. I was hoping someone reviewing that paper could either confirm my view of what they did in this case or show me where I have misinterpreted what they did because my view would say they are grossly over fitting their model.
What I would like to do are some sensitivity studies of the areas and seasonal periods selected for these correlations. In order to do them efficiently I am looking for time series of the 200-850 hPa vertical shear by month and region. What I have found so far are time series for the u and v components of wind at 17 different levels including the ones I need for my analyses. Do I have to do my own calculations using the appropriate vectors for the 200 hPa and 850 hPa levels or is that available already calculated? I have had trouble downloading files with an .nc extension but have so far found ways around that problem to get the data into an Excel spreadsheet. Any suggestions would be most helpful and appreciated.
Re #625 Kenneth I’ll take a look to see if I can find wind shear time series for different tropical regions. No doubt they exist but whether they exist in one user-friendly form is unknown to me.
(My personal view is that the 850-200 shear estimation using NCEP grids is that it is a coarse estimation, at best, of the true shear environment. The problems include accuracy of the data, failure to capture important smaller-scale detail and most importantly the failure to capture the shear above and below 200mb. But, it’s what we have and it is much better than nothing.)
I’m remiss in reading the Saunders paper in detail (it looked simplistic in a quick read-through) will do so later today.
David,
I am unconvinced that pre-satellite era tropical winds in the reanalyses have that much skill. The data available for ingestion is very limited and the NCEP relies heavily on the background climatology of the model for first-guess analysis fields. As a way to show the uncertainty in the zonal vertical shear calculation, I am plotting the average root mean square deviation (RMSD) between the ERA40 and NCEP reanalyses for the period of June-November. There are 366 comparisons of the 850-200 hPa zonal wind shear vector differences (m/s) (if one uses the magnitudes, the plot is qualitatively the same).
So, this image clearly shows the “anchoring” effects of land/in-situ obs like radiosondes, because the NCEP and ERA40 agree much more closely, even though each model has different physics, resolution, and assimilation methods. Yet out over the oceans, where there is little real data to ingest, the model background fields of each respective reanalysis “take over” and you see that the estimations of vertical wind shear diverge wildly.
Now consider the plot of 2001 RMSD’s, when satellite data is assimilated, and expanded to the whole globe:
The same data assimilation issue is occurring. How does the model handle in-situ data with the inclusion of satellite radiances (or temp retrievals), winds (GOES, scat), etc? You need accurate estimates of the background error and observation error covariance matrices to get the most bang for your buck out of the remote sensing data. Each reanalysis has its own strengths and weaknesses for sure and that is well beyond the scope of this simple example.
Finally, let’s look at 500 mb Temperature RMSD’s, but for the entire year of 2001, this time comparing the ERA40 and the newer JRA25 models. Temp diffs are in K. Temp Differences 2001 Anyone care to point to the radiosonde stations?
Re #627 Wow, thanks Ryan, those maps communicate very well.
I’ll revise my statement to, “But it’s what we have and, on a good day, maybe it’s better than nothing, if one is very very careful.” Sounds familiar 🙂
Even with those large differences that I show in the day-to-day wind fields, the NCEP and ERA40 monthly mean products are indistiguishable for vector vertical shear, with correlation R ~ 0.97 (not kidding) when averaged over the MDR. Wang and Lee are on solid footing there. So, does this mean that Atlantic tropical winds are robustly represented pre-satellite in each reanalysis product (and I was just blowing smoke)? For low-frequency applications, vertical wind shear (averaged over a large domain on a monthly time scale) should be well-estimated (think of MDR SST I suppose) in the reanalysis. But for high-frequency applications, I am far from convinced.
Re: #627
The area used by Saunders and Lea in their paper for the vertical wind shear was 12.5N-17.5N and 40W-85W which appear from your maps of differences to be an optimum area for least differences between data sets.
David, I found that I could download from the link below to obtain NCEPR zonal wind speeds (1948-2007) for 200 hPa-850 hPa to calculate what I assume is used for vertical wind shear. I have simply taken the monthly mean differences and averaged over the period of interest. I need to check my results against some plots I have to insure that I am doing this correctly.
I looked up the ERA40 data set and after seeing the fees they wanted to charge for their data decided that a renewed effort to download the NCEPR was in order and that for now I would assume that for the area of interest I could ignore Ryan Maue’s general cautions from above.
http://www.cdc.noaa.gov/cgi-bin/PublicData/getpage.pl
Re #631 Kenneth, to confirm, wind shear is based on both zonal (west to east) and meridonal (south to north) components.
On possible Atlantic basin regions for wind shear, this link shows possible areas (“sub-regions”) about midway down the page.
David, I have found that some climate scientists use and reference specifically to the 200-850 hPa vertical wind shear as zonal and even include the letter U in front of it. I have seen references to a vectoring of the vertical wind shear using the u and v components.
Even more interesting are the regions that these scientists use in connecting wind shear mearsures to TCs measures. They sometimes change from paper to paper and report to report. I am in the process of reproducing the graphs I have found in the literature using my recently found NCEP Reanalysis site for downloading into an Excel spreadsheet. I have nailed some and had differences on others. I plan to go through the process to determine what each of these authors did to obtain their results. It is often not clear from the paper.
I have had a number of frustrating moments using the NOAA linking paths to the downloadable data. It may be just me, but unless I get the correct path exactly right I am given no clues to how to get to the time series and end up with only the option of producing a map with the data. But the greater the challenge and frustration the greater the satisfaction.
I found the link to the ERA40 data set most illuminating in that besides some stiff fees they have a form that ask specific questions about the purchaser and to what use the data will be put. I judge that they feel that their data have some worth as intellectual property and they must think there are users who find it superior to the NCEP Reanalysis data that is available at no cost. ERA40 data set goes to 2002 and the NCEP Reanalysis data set goes through Jan 2008. The fees for ERA40 are also in British pounds so one has to pay for the devalued US dollar in the deal.
But such is life for those of us who play at the game of climate science.
Re #633 Good point, Kenneth.
Interestingly, the use of zonal wind shear instead of total wind shear originated with Bill Gray many years ago, mainly for convenience. Personally I’m unsure that his rule of thumb (ignore the north-south component) is applicable when overall wind shear values are low, as in ASO in the tropical Atlantic, but it’s probably the least of worries in the current application 🙂
Good luck on the exercise! I look forward to seeing what you find.
One of the first things I noticed is that a vectored resultant using both north-south and east-west vectors in the MDR is primarily determined by the east-west (U) component.
I have yet to completely determine how the shear was calculated in the graph that I posted from Ryan Maue’s post for the Wang and Lee 2008 paper for the MDR shear time series.
Vecchi Knutson (2007) does a commendable job of estimating “missed” Atlantic storms. The authors use historical ship locations, typical storm extent and other information to estimate how many tropical cyclones existed, but were not detected, in pre-satellite times (roughly 1880 to 1965).
When their adjustments are applied to the historical records the Atlantic trend becomes +1.6 storms per century. This is notably lower than the unadjusted trend of +3.8 storms per century but still somewhat at odds with the no-trend pattern of US landfalling storms.
They also find that storm durations have decreased, which is an oddity.
As discussed earlier in this thread, VK07 uses subtropical storms in their analysis. This, as several of us believe, is not a good practice when examining long-term trends in tropical systems – the subtropical storm count should be excluded from their analysis. I won’t recount the reasoning here. If that exclusion is made then the long-term trend decreases slightly, to about +1.4 storms per century.
There is a second, bigger concern that needs to be thought about and which is the purpose of this post. It has to do with short-duration storms, those which I define as those having 34+kt winds for only 24 hours or less.
Short-duration storms are a non-trivial part of the historical record. They are increasing in both absolute numbers and as a fraction of all storms and are numerous enough to play a role in modern storm trends.
I’m unaware of any physical hypothesis (AGW or otherwise) which plausably explains the apparent increase in short-duration storms since WW2. In addition to tackling the time series, any such hypothesis would also need to address the geography of short-duration storms, which has them clustered in odd places.
An alternate explanation, which I favor, involves improved detection of weak systems, especially those approaching the US mainland. And it involves the particular features of newly-formed systems, as mentioned earlier:
So, does the record show real changes in short-duration storm frequency or simply changes in detection? Inquiring minds want to know 🙂 and VK07 attempts to tackle the issue.
A key part of the VK07 approach involves their Figure 4 , which is based on an earlier study. This involves the size distribution of Atlantic tropical cyclones. My concern has to do with the indicated sizes on the low end (circled), as I think Figure 4 overestimates the size of newly-formed tropical storms.
So, to examine my concern, I looked at the 27 short-duration storms of the period 1988-2007. This is a period with the best-available detection data and which matches the period used by the sizing study. I went to the NHC online archives and looked at the surface (ship and shore) record for each storm, to see what kind of actual surface footprint these short-duration storms had.
(Caveat: the records are not always easy to read and may have inconsistencies in reporting over time. So, I am not fully confident that there are no gaps or that I did not misread something. But, they’re the best I’ve found and all that I have. I welcome anyone who reexamines this source or has alternate sources.)
Seventeen of the twenty-seven storms (about two-thirds, most of them landfalling) had no surface record (land or ship) of storm-force winds.
The data from the remaining ten are combined here . The black dot is the composite center while the small numbers indicate windspeed observations. Each line is one degree of longitude/latitude, about 110km. The circle is what I understand to be the expected region of +34kt winds, per the VK model.
What I see are:
* a total lack of storm-force wind observations in the southwestern half of the composite, consist with the notion of a highly irregular windfield in these newly-formed storms.
* shore observations which are tightly clustered near the composite center rather than spread out some distance west and especially east from the center.
* a lack of ship observations within the circle
* most of the ship observations outside the circle associated with systems which had subtropical characteristics at some point in their existence (like 2007 Olga and 2001 Allison)
In short, to me, these newly-formed systems typically have a very small footprint, considerably smaller than what would be expected from VK07’s Figure 4.
What to do? Well, there may be some way to estimate the footprint of these short-duration systems and plug that into VK07’s methodology, but I don’t know what that would be.
An alternative is to eliminate the short-duration storms from the record, as estimated here . This elimination reduces the trend to a weak +0.3 storms per century and also helps with the duration-reduction mystery mentioned earlier. (Note that I don’t know how many short-duration storms might be incorporated into VK’s adjustment so this plot is only approximate.)
Even though the cure is not obvious to me I think it is important to note the problem. And, I plan to look at a composite of longer-lived tropical storms to see how their impact contrasts with the one shown above.
Re #636 One of the puzzles in VK07 is the apparent decrease in storm duration, even after making their missing-storm adjustment.
This is illustrated in their Figure 7d . Even for a partial period, such as 1931-2006, the downward trend is present.
A question is, what would the duration trend look like if subtropical storms and short-duration storms were removed, as discussed in #636.
Here is a plot covering 1931-2006, with the subtropical and short-duration storms removed (solid line). (I chose 1931-2006 to cover an AMO peak-to-peak period. I excluded the 1930 outlier, as that season had but two storms with one being particularly long-lasting. I did not make the VK07 adjustment as the effect is small in this period and I am unsure of their methodology.)
When subtropical and short-duration storms are excluded the trend falls to a marginal -0.15 days per century. This contrasts with the puzzling -1.0 days per century of those storms are included.
With the two classes of storms excluded there is no need to search for a physical explanation of declining duration, at least in the modern (post-1930) period.
To me this is one more indication of the validity of addressing the subtropical and short-duration issues.
Regarding 1880-1930, I suspect that there is a systematic problem with the initial parts of the storm tracks, namely a tendency to show systems reaching tropical storm strength too early, perhaps 12 hours too early. Dunno how to find evidence of that, but I’ll look.
Re #637 I had forgot about post #612, which looked at the time it takes a storm to go from 35kts to 65kts in two eras, as shown here , here and here . No wonder it sounded familiar 🙂
That may account for most of the remaining apparent trend in the records, 1880 to today.
DR Curry I have a question.
This quote has been attributed to you:
“You cannot blame any single storm or even a single season on global warming. …
Gore’s statement in the movie is that we can expect more storms like Katrina in a
greenhouse-warmed world. I would agree with this,” said Judith Curry.
She is chairwoman of Georgia Tech’s School of Earth and Atmospheric Sciences,
and is co-author, with Mr. Webster, Mr. Holland and H.R. Chang, of a paper titled
“Changes in Tropical Cyclones,” in the Sept. 16 issue of Science, a weekly publication
of the American Association for the Advancement of Science.”
Now, I want to let you break this down for us in scientific terms.
More storms LIKE katrina.
LIKE katrina.
What are the salient features.
1. Windspeed?
2. Duration?
3. Landfalling?
4. Damage?
5. location?
LIKE KATRINA in the american imagination is one thing ( 10000 dead! remember that)
LIKE KATRINA in science is something entirely different.
So “like Katrina”, did you mean more CAT 3s? more landfalling CAT 3s? more gulf coast landfalling
cat 3s. more huricanes landfalling on areas and communities who refuse to prepare and who live
under sea level.
What did gore mean. what did you mean. and what does the science say.
Not in katrina terms, in science terms.
A metaphor or similie is a powerfully misleading trope, sometimes.
bump
In previous posts in this thread I analyzed the SST correlations that were reported in Saunders and Lea, Vol 451| 31 January 2008| doi:10.1038/nature06422. The correlations in this paper involved three relationships of NATL TC measures, such as TC counts and ACE indexes, versus (a) the vertical wind shear at 200 hPa-850 hPa located at 12.5-17.5 and 40-85W, (b) the U wind component at 925 hPa located at 7.5-17.5N and 30-100W and (c) the SST located at 10-20N and 20-60W.
On extending the SST correlations that the authors found in the time period 1965-2005 to the period 1950-1990, the correlations broke down nearly completely. I attributed that breakdown to a possible confounding of SST with other changes and/or the 1965-2005 correlation being spurious. To complete my analysis, I wanted to look at the wind variables in a similar manner and determine how the correlations held up in different time periods, geographic locations and when using different months for the wind variables. The table below contains the complete set of calculations for both the SST and wind variable correlations with NATL TC counts and ACE indexes.
The results in the table show that generally the correlation with SST breaks down in the 1950-1990 forty year period rather completely for both TC counts and ACE indexes while for vertical shear it breaks down but not as completely and significantly less so for the ACE indexes than TC counts. For the variable 925 hPa u component wind the correlations hold up better for both TC counts and ACE index, but with the ACE index holding up significantly better than TC counts.
From this analysis I would conjecture that the SST correlation holds up poorly to sensitivity testing, the wind shear fairs somewhat better while the 925 hPa holds up well and particularly so for correlations with the ACE indexes. The correlations were all insensitive to changing the monthly periods in which the variables were sampled from Aug-Sep to Aug-Sep-Oct. The wind variable relationship showed some sensitivity to location with the TC count being more sensitive than the ACE index.
I would further conjecture that the better performance of the correlations of the wind variables with the ACE index over the TC counts could bear on the detection capability changes over the time period analyzed being more apparent in storm counts than ACE measures. Others here have suggested that ACE is the more appropriate measure of TC in these matters than counts.
Finally I would conjecture that the findings of Saunders and Lea of the relationship of the u component of the 925hPa wind with ACE indexes might well be a new insight into the factors influencing NATL TCs.
Re #641 Excellent sensitivity analysis, Kenneth. I wish that such was the standard practice in the field, along with the use of unsmoothed data in calculating correlations.
The west-east 925mb wind component is interesting. What is the direction of the correlations (stronger easterly wind = more TCs and ACE?). Those winds could be indicative of pressure patterns, vorticity, evaporation rate and other factors.
Kenneth, the main issue i have is i don’t have any confidence in the intensity data prior to 1970. Depending on whether or not you make the landsea 1993 correction to major hurricane intensity before 1970, you get totally different results (note using landsea correction gives a large increase over the period, whereas not using the Landsea 1993 doesn’t give an increase). emanuel and landsea have been debating this issue for 3 years now. My opinion is that the ACE numbers prior to 1970 aren’t of any use, at best you can discriminate between major and minor hurricanes (but there is some fuzziness there in the border between cat 2/3 in terms of landsea correction or not).
Steven, here is what “like Katrina” refers to:
• Katrina was the 6th strongest hurricane ever in the North Atlantic
• Katrina was one of the five deadliest hurricanes ever to strike the U.S.
• Also, Katrina was very large in terms of horizontal dimension (size isn’t usually analyzed in terms of hurricane, but it is certainly important in terms of damage)
To “like Katrina”, I would say, we can expect more storms like Katrina, but not because of Global Warming. Furthermore, because some researchers do not accept data before 1970, or use mainly satellite data, I have some difficulty accepting their conclusions.
http://www.climateaudit.org/?p=2114#comment-215315
David, the stronger the easterlies the lower the TC count and ACE.
As an aside I was surprised how well the correlation of ACE, and to a lesser degree that of the TC counts, held up for the 925 hPa u component velocity to changes in geographic location. The authors of the paper indicated that they were looking for a sweet spot location for regressing the 925 hPa wind variable against TC measures and that made me suspicious.
http://www.climateaudit.org/?p=2114#comment-215315
Judy, thanks for using the O word. My opinion is that the detection capabilities have changed rather continuously over the period of TC recorded history and that the ACE index contains more of the easier to detect TC measures than does the TC counts. I need to take a further look at correlations to the variables posed by Saunders and Lea using the Easy to Detect TC measures.
http://www.climateaudit.org/?p=2114#comment-215330
Katrina hit the area with the most damage, New Orleans, as a category 3 hurricane. Most of the damage has since been attributed to US Corps of Engineers errors in constructions that were built and maintained to withstand Cat 3 hurricanes. That to me it is an object lesson in what portends for what the mitigations by the US government might accomplish for the effects of AGW.
I was thinking back to our bets on the numbers of NATL named storms for 2007 and wondering whether I could complete my evaluation of my bet which was the average of the Gray/Klotzbach and the Europe combine of 3 models that included Meteo France. Does anyone know whether the European ensemble has reported their 2007 NATL TC counts? If not is the count later than last year’s announcement? The London modelers did report their results before the season so we awaiting the other two.
My musings from above got me to thinking about the differences between the empirical Gray/Klotzbach model and the European models that work more on first principles. I will state how, in general, I think these models work and then ask to be corrected where I am in error:
1. The EU models use variables such as SST to determine climatic conditions that tend to create TCs.
2. The EU models do not fit past variable data to past TC counts, but instead create an independent model that will spit out a TC forming tendency.
3. The EU models cannot resolve a localized weather occurrence such as a TC or hurricane and therefore they must relate the TC tendency to a season having a given number of named storms.
4. The EU models must therefore use past TC counts with hindcast tendencies to calibrate their models so that TC counts are spit out.
5. Forecasting in advance of the season requires the EU models to have long term weather/climate forecasts to determine the inputs for the model.
6. We, therefore have the same situation as that discussed for the Hansen 1988 Scenario A, B and C in that an evaluation can be performed in two separate parts. The first part is how well the model performs to the real world when the real world inputs are used. The second part is: how well were the inputs into the model determined.
7. One could have the correct answer from the model, but for the wrong reason, i.e. the model had both the inputs and modeling on those inputs wrong. Or the model could do well in handling known inputs but fail because predicting the weather/climate was unsuccessful. (The Gray/Klotzbach models seem to improve in skill significantly as the time between prediction and weather/climate condition is shortened).
8. The Gray model is constructed primarily by fitting past variable data to past TC counts.
9. Under these conditions the Gray model, unlike the EU models, can also be used to predict hurricanes, major hurricanes and ACE indexes.
10. Like the EU model the Gray model depends on two separate operations, i.e. weather/climate predictions for inputs and then a model to use the inputs to predict TC counts and other TC measures.
If the above is correct would not a proper evaluation of both the Gray and EU models involve separating the weather/climate prediction part from the modeling of the inputs part?
Kenneth, here is how the European groups (EUROSIP) do their seasonal forecasts. Each uses a coupled atmosphere/ocean climate model with a separate ocean analysis system to initialize the ocean. Documentation on the ECMWF seasonal forecasting system is given at
http://www.ecmwf.int/products/forecasts/seasonal/documentation/index.html
The atmospheric component is the same model used for weather forecasting, but at a reduced resolution of T159 (about 120 km). I think 40 ensembles members are run for each month.
The Vitart et al article is at link below, but i can’t find free online copy
http://www.agu.org/pubs/crossref/2007/2007GL030740.shtml
The tracking is done following Vitart and Stockdale 2001
Click to access i1520-0493-129-10-2521.pdf
at 120 km resolution, their system will miss some of the smaller storms (tiny tims), hence the final seasonal forecast is “bogused” slightly based upon hindcast simulations and their comparisons with observations. At a resolution of 55km (currently used in the 15 day forecasts), they catch essentially all the storms with credible intensity.
Gray/Klotzbach scheme is based on the same data Hurdat that is alleged to be flawed, undercounted, etc. in the context of the natural variability vs global warming debate.
http://www.climateaudit.org/?p=2114#comment-215723
What are the data sources that the EU models use to calibrate storm counts to the model outputs. Outputs that, from my readings and recollections, evidently are only capable of giving conditions conducive to TC formation. The models do not actually show storms whirling up on a gridded map — do they?
ECMWF has done hindcasts for the period 1993-2003, then actual forecasts starting in 2004. So they are using data back to 1993, which should be pretty reliable.
Kenneth, my recollection is that the EU approach is to run high-quality weather models covering a long forecast period, perhaps the next six months. They then count the number of TC-like vortices generated by the models over those six months. They then take those counts and multiply them by an empirically-determined factor to give a forecast of TC activity.
The empirical factor comes from forecast runs which used the starting conditions (say, June 1 1995) of prior seasons. The output of those runs was then compared to what actually happened (in say 1995) and adjustment factors were developed.
The EU approach appears to be dependent on those adjustment factors developed in-sample. The test will be, of course, when they go out of sample.
(The above is my recollection, which may be all wet. I welcome any corrections.)
David and Judith your comments seem to ring true with what I now recollect about the ECMWF model. Those modelers at ECMWF appeared to explain, in layperson terms, best what they were doing with their model. Are the modelers actually able to visualize storms forming in their models?
I would still like to see the models’ (empirical or otherwise) performances separated into the weather/climate prediction part and the part where they take these inputs and use them to predict TC counts or other measures. Perhaps the separations in the model operations are not that distinct.
An aside: I would like to obtain the ACE indexes, east and west of 60W for the period 1901-2006, that Bob Koss used in the graphs in post # 260 in this thread. David Smith has my email address and, if either Bob or David has the others email address, we could go that route.
Kenneth, ECMWF is doing experimental weather forecasts of tropical cyclones. We are also doing them using the ECMWF Ensemble Prediction System (15 days). Our tracking for the ECMWF ensemble forecasts for the West Pacific and Indian Ocean can be found at http://cfan.eas.gatech.edu/Bangladesh/Tracks.html. The ECMWF model did an impressive job during last season, note the resolution for the 15 day forecasts is 55 km.
This is a footnote to #636.
In that post I mentioned that newly-formed tropical cyclones may be too small, on average, for the VK07 methodology to work properly. Since then I stumbled across a NHC website which offers some graphical data on storm wind fields.
My access to this data is limited (may be a browser problem on my part) but there are several storm wind fields which I can access. This is a look at one of them, Tropical Storm Beryl from 2000, which peaked at a typical 45 knots before dissipating inland. The purpose here is simply illustration.
The wind field maps are
6 hours
12 hours
18 hours and
22 hours
The contours show the estimated wind speed (knots) while the x and y axes are longitude and latitude.
On these maps the mauve dot represents the storm center while the mauve circle represents the typical radius of storm-force winds assumed by VK07.
The red shapes represent the region of tropical storm-force winds (35kts+).
In the 6-hour map there is no established 35 knot wind field, only a spot observation of 35kt winds probably in a squall.
By 12 hours several regions of storm-force winds have developed on the eastern side (nothing to the west) which total to maybe 40 to 50% of the VK07 assumed wind field.
At 18 hours the winds are becoming a little better organized but coverage has shrunk down to maybe 10 to 15% of the VK07 assumption.
At 22 hours the storm-force winds are in a reqion, probably squally, on the north side which covers maybe 35% of the circle.
I hope this illustrates some of this statement from #636:
This problem may affect VK07 in both the short-duration storms and also, to a smaller but more widespread extent, in the initial stages of all storms.
David,
You can send my email address to Kenneth or his to me. Then we can communicate directly. I just don’t like the idea of putting my email address out in the wild on the internet. My account is almost spam-free and I’d like to keep it that way.
Kenneth,
Once I here from you or David I’ll send you the data. Feel free to ask at anytime. If I can accommodate, I will. Still no 2007 Hurdat figures though.
Re: #654
The reason I asked about the modelers’ capabity to visualize TC formation is that if they could do this readily then why could not they expand this visualization to hurricanes and major hurricanes and the all important ACE index. As I recall the EU models were only reporting TC counts. Thanks for the link. I need to review the EU and Gray models again.
Re: #655
VK 07 contains a number of precautionary items in their paper and I give them much credit for that. I particularly appreciated their reference for the need of using very long time periods to capture the full effects of multi-decadal cycles on TC events in the NATL. They caution, generally, on the shape symmetry of the storm formation and how it could effect their assumptions and adjustment model, but without presenting maps/pictures (even though anecdotal) as you did here, David, the full effect is not appreciated.
By the way, when I was searching for information on the use of wind shear in TC formation analyses, a paper by Vecchi and Soden was the only one I found that very clearly laid out and defined the wind shear measurement they were using.
As an aside, as I was searching for ways to download daily wind shear measurements with an nc extension I found online programs that worked but would put the data into graphical and map formats directly without conveniently allowing me to capture data in an array as an intermediate step. I think this tendency points to the emphasis that these people working in this area put these graphical depictions. The need for it certainly has become clearer to me on looking at the graphical presentations that David Smith, Bob Koss, Ryan Maue and others have made here.
As a further aside I have not been able to reconcile the absolute numbers used in the vertical shear time series presented by Ryan Maue at http://www.climateaudit.org/?p=2114 from Wang and Lee 2008. I can reproduce the numbers that correlate very well with those in the graph but I cannot duplicate them (my numbers are lower). Does anyone know the exact source of these wind shear measurements?
Re: #656
David if you could get my email address to Bob and he could send the data requested I would be most appreciative of both your efforts.
Re #658 Done!
A couple of notes from the NHC website
and
I think we need to find a cloud swirl and ask that it be named “Hurricane Sadlov” – it’d drive him nuts 🙂
Just to put some perspective on the statistical versus dynamical modeling, I post the following two links and excerpts:
From Klotzbach and Gray we have:
http://typhoon.atmos.colostate.edu/forecasts/2006/aug2006
From the Met Office in the UK we have:
http://www.metoffice.gov.uk/weather/tropicalcyclone/northatlantic.html
http://www.climateaudit.org/?p=2114#comment-216239
Thanks again David and Bob. I have the requested data.
Re: http://www.climateaudit.org/?p=2114#comments
I looked at the Saunders and Lea variables as I did in the previous post, but this time for the correlations I used the David Smith Easy to Detect TC counts and the Bob Koss west of 60W ACE indexes. I did this in an attempt to analyze the correlations with TC measures that are less contaminated with the effects of changing detections capabilities. The results are presented below in the table. I included only the ASO monthly variable measures, but the AS measures were similar and as with the previous analysis was not sensitive to the monthly period used.
The results again show that the correlations are consistent over time for the wind shear and 925 hPa variables but not for SST. With the easy detection TC measures it appears that the wind shear becomes a larger factor and more consistent with time.
It should also be noted that the trend lines of the Easy to Detect TC counts and the west of 60W ACE indexes over the time period 1900 to present are, for nearly all purposes, flat. Given those flat trends it is worth noting that for given periods of times one can get correlations between TC measures and SST that do not apparently hold up over other and longer time periods.
I went back and reviewed the article “Dynamically–based seasonal forecasts of Atlantic tropical storm activity in June by EUROSIP” in the Aug 24, 2007 AGU — which I paid $9 to see.
In it the authors write about their models not having the capabilities to resolve TCs, and thus needing to calibrate the models with historical data. They also note that the different integrations of the model require different calibrations. They do, however, refer to vortexes (that I assumed were model generated) that are then converted to TCs – when and if the temperature anomalies aloft are of sufficient value. The models can then construct tracks of the TCs of which the authors show examples in the paper.
They state that the model generated tracks are unrealistically short in length and that the TC intensities are significantly weaker than in the real world. They apparently attribute these limitations to the models not being able to resolve features the size of a formed TC and hurricane and state that this limitation does not allow the models at present to predict TC intensities or landfall tendencies.
Another item in the paper noteworthy to this discussion was how they used the Met Office (UK), the Meteo France and the ECMWF combined model results in comparing to individual statistical models. I do not know whether a combination of statistical models would improve their results, but the combination of the three dynamically based models was an improvement over the individual model results.
On viewing the limitations of the current dynamical models it would appear to me that their practical use would only be in a “contest-like” showing of getting TC counts more correct against the empirically based models. Given years like the past TC season with higher TC counts and a relatively low ACE index and these dynamical model limitations why are they so coy about announcing their results before the fact? Surely no enterprises are paying hard money for this limited information. And besides I want closure on my bet.
One of the researchers cited in VK07 was kind enough to point me towards the wind radii raw data used to develop VK07 storm sizes. As mentioned earlier, I am concerned that the storm sizes (aerial extents) used in VK07 are too large for short-duration and early-stage storms, thus over-estimating the extent to which these small storms would have been detected prior to our modern satellite/dropsonde/doppler era.
I’ve just started looking at the data, so all I have at this point is anecdotal in nature.
(1.) I happened to pick Tropical Storm Charley (1998) as it’s one I remembered. Here is a map of the storm wind (knots) distribution. The storm center is the blue dot in the middle. There is no region of sustained 35 knot winds (the minimum for being called a storm) so I marked the closest thing (30 knots) in red hatching.
What does the database say? The database, which feeds indirectly into VK07, says that the 35 knot winds were the entire region enclosed by the blue dashed line.
That’s a rather gross over-estimation.
(2) I looked at the advisory archive for Charley. What I saw was that the database gives the same wind radii as are used for the marine warning. That’s a big problem (if it is true for the entire database) because the marine warning radii are a worst-case statement and tend to overstate the wind regions.
Again, this is anecdotal evidence but consistent (so far) with my concerns. I’ll work to create something less anecdotal.
I suspect that VK07 made their assumptions in order to make the calculations tractable. It all seemed rather straight forward to me until someone out there decided to challenge the model assumptions. Whoda thunk.
I think this is a critically important analysis that you are doing David — even if it is of a paper that brings the storm counts more in line with the Easy to Detect count index.
David Smith,
I took a look at the Best Tracks data for Charlie for 0000z and 0600z and the winds are 45 and 60 knots respectively. I doubt the winds slowed and then increased up to 60 knots in the six hour span. Seems there is an awful lot of wiggle room in how they assess windage. Maybe they do it Kentucky style. 🙂
Bob, it’s a head-scratcher.
By the way, the extended best track data is here . My conjecture is that we’ll find it’s OK for mature storms but too inaccurate for new storms and Tims.
Thanks for the link, David.
Downloaded the extended data. Not sure if I’ll do much with it, but at least I have it.
A plot of Atlantic tropical storm size distribution is here . I’ll comment later. This plays a role in storm detection.
Atlantic storm count is a worn-out topic but, like a dreaded vampire, it does return from the dead on occasion.
Before I bury some recent work into the muck of my hard drives I’ll offer three plots regarding the recent Vecchi Knutson 07 (“VK07”) paper.
VK07 is a good paper. But, I’ve expressed a concern about VK07’s use of subtropical storms and a nagging concern about the sizes of tropical storms used by VK07, especially newly-formed tropical storms.
As best as I can determine, based on my reading of VK07, the distribution of tropical storm radii observations is represented by this plot . Note that none are shown with a mean radius below about 40 miles. Also, a significant number of storm observations are shown with radii greater than 100 miles.
Here is a plot of the VK07 model with the actual observational data (red) overlaid. And here is the same plot with a couple of notes (green) added.
One concern is VK07’s lack of very small storm observations (left side of graph) which are especially important in newly-formed storms. Also, VK07 is heavy on large-radii observations, which does not agree with the observational data. I think this all leads to VK07 “under-detecting” tropical storms in the pre-satellite era with their methodology.
Beyond this, I suspect that the raw data (which is based on marine advisories, which are mainly intended as a tool to warn ships) over-states the actual extent of storm winds, especially with poorly-defined and asymmetric new storms. The windfield maps now available from the NHC are probably a better source for tropical storm parameters.
The net effect of all of this is that VK07, despite its good efforts, may still have underestimated small, weak, short-duration storms in the early decades of its study.
At some point I’ll put the NHC windfield maps to use and also write down my notes, maybe on the CA auditblog, before re-burying this vampire 🙂
David Charles Dickens Smith, thanks for the excellent analysis and getting the well-deserved recognition for the Tiny Tims of this world. I think its time to ACE the TC storm counts.
This is a footnote to #671.
I mentioned my concern in #671 that KM04 (and thus VK07) used data based on the NHC forecast advisories (sometimes called marine advisories, with an example here ).
My concern is that these real-time advisories are intended as warnings and thus tend to err on the side of conservatism, meaning that they tend to overstate storm wind radii. Also, they are based on the best available (but limited) information at the moment the advisory is issued and involve some guesswork.
The NHC now issues wind maps for storms, based on after-action reconsideration and analysis of all the data. These are about as close to “true” radii values as we have.
So, to see if my concerns are warranted, I checked twelve storms from 1998-2000, a period of available wind maps. These are storms that never made it to hurricane strength. I compared these values against the radii given in the advisories/KM04/VK07.
An X-Y plot of “true” radii versus forecast-advisory radii is given here . If there is no bias then the values should evenly scatter around the equalization line.
In this case, however, the points almost all reside in the lower half. That is the region where advisory radii are greater than the true radii. This indicates a tendency for the advisories to overstate storm wind radii, which causes a problem for VK07.
Admittedly the sample size is small. I plan to expand it to cover all available storms but I imagine that the pattern will hold.
This is a footnote to #671 and #673.
The NHC is making an increasing number of storm wind maps available to the public. They can be found here (select a year, say 2007, and then view the maps. Some years are populated and some are not).
I picked 14 storms from the populated years, gridded the maps and then calculated (by hand) the size of their regions of storm-force winds. Not fun but it works.
An X-Y plot of the results is here . The x-axis is hours after formation while the y-axis is the area experiencing storm-force winds. Each blue dot represents a storm at a point in time. Note that this is a sampling for illustration purposes and needs more data points (a useful project for a student). The plot shows (green line) the median area used in VK07 for tropical storms, as well as the median of the data points.
Note that these young storms, while expanding, fall well below the assumption in VK07. That creates two problems:
1. The short-duration storms, on average, simply lack time to grow to the size assumed in VK07.
2. All storms likely have their size over-estimated by VK07 for their first 12 or so hours. While this may seem like a small matter, recall that this initial time may represent 5 to 10% of the life of a storm which, with a large population, makes a difference.
(Aside: a plot which converts area into inferred radius is here . It may be that, in the VK07 technique, radius is more important than area – hard for me to tell. Note that VK07 uses a 43-mile radius cutoff (nothing smaller than that) which misses a number of the data points.)
(Another aside is that I believe they assume that any storm which nears land will be detected. While reasonably true for normal storms there’s evidence that this does not hold for short-duration storms.)
Anyway, VK07 is a good paper which I think has a young-storm problem to be sorted out. If I’m correct then the VK07 technique probably under-estimated the number of “missed” storms.
Just stumbled on this thread.
There’s so much bad science around in climatology, mainly due to political considerations, it’s a pleasure to see some genuine scientific methodology being applied to the controversial issue of storms.
There is a paucity of accurate data in this area and much of the speculation is based on poor quality information. Anyone who can shed some light on this difficult area deserves a big thanks. I will continue to watch how this progresses with interest!!!
Is this the right place to mention the recent talk Briggs gave at GISS?
Click to access briggs_hurricane.pdf
Re #676 Interesting Briggs presentation Andrew.
I see nothing in his conclusions that looks unreasonable. He plans to do a similar exercise using Kossin’s global data, which would be good.
very profound analysis 🙂
Hello from Germany! May i quote a post a translated part of your blog with a link to you? I’ve tried to contact you for the topic YTD Hurricane Activity « Climate Audit, but i got no answer, please reply when you have a moment, thanks, Gedicht
Then come back here and tell me climate science can make pronouncements about anything. Including todays temperature accurate to 1 deg K…
data recovery
3 Trackbacks
[…] Atlantic hurricane seasons appear to have become steadily milder since Katrina […]
[…] http://www.climateaudit.org/?p=2114#more-2114 […]
[…] Dan and Jennifer wrote an interesting post today onHere’s a quick excerptThe long-term Atlantic increase has been in the entirely-at-sea category, a category which shows only a loose, odd relationship with SST but (my opinion) a stronger relationship with changes in detection. […]