Don’t you think that someone on the Team might have been a little curious as to what bristlecone ring widths have done during the past 25 years? For this, we have the classic excuse of Michael Mann and the Team for not updating bristlecone and proxy records is that it’s not practical within the limited climate budgets:
While paleoclimatologists are attempting to update many important proxy records to the present, this is a costly, and labor-intensive activity, often requiring expensive field campaigns that involve traveling with heavy equipment to difficult-to-reach locations (such as high-elevation or remote polar sites). For historical reasons, many of the important records were obtained in the 1970s and 1980s and have yet to be updated.
From the first moment that I got involved with paleoclimate, it seemed obvious to me (as it is to anyone not on the Team) that, if the classic “proxies” are any good and not merely opportunistic correlations, that there is an ideal opportunity to perform out-of-sample testing of the canonical Team reconstructions by bringing the proxies up-to-date. I wrote an Op Ed in February 2005 for the National Post entitled “Bring the Proxies Up to Date”, where I expressed the view that this was really the first order of business in Team world. While the addition of new proxies is also important and nice, this is not the same thing as out-of-sample testing of the proxies used in MBH99, Crowley and Lowery etc – especially the bristlecones.
I’ve continued to satirize this failure pointing out that several of Graybill’s classic bristlecone sites were easily accessible from UCAR world headquarters in Boulder and that no heroic expedition was required to update, for example, the Graybill sites to the west of Colorado Springs.
To get to these sites from UCAR headquarters in Boulder, a scientist would not merely have to go 15 miles SW of Colorado Springs and go at least several miles along a road where they would have to be on guard for hikers and beware of scenic views, they would, in addition, have to go all the way from Boulder to Colorado Springs. While lattes would doubtless be available to UCAR scientists in Colorado Springs, special arrangements would be required for latte service at Frosty Park, though perhaps a local outfitting company would be equal to the challenge. Clearly updating these proxies is only for the brave of heart and would require a massive expansion of present paleoclimate budgets. No wonder paleoclimate scientists have been unable to update these records since Graybill’s heroic expedition in 1983.
Pete Holzmann (Mr Pete), who lives in Colorado Springs, agreed with this satire and this led to what I’ll call the Starbucks Hypothesis: could a climate scientist have a Starbucks in the morning, collect tree rings through the day and still be home for dinner?
To make a long story short, last summer, when my wife and I visited my sister in Colorado Springs and I thought that it would be rather fun to test the Starbucks Hypothesis and I gave a bit of a teaser report in late July, promising some further reports in a few weeks, but I got distracted by the Hansen stuff. At the time, I mentioned that, together with CA reader Pete Holzmann and his wife Leslie, we visited some bristlecones in the Mt Almagre area west of Colorado Springs.
But I have a little secret which I’ll share with you as long as you promise not to tell anyone: our objective was to locate the precise site sampled by Graybill. Not just that. Prior to the trip, I obtained a permit from the U.S. Forest Service to take dendrochronological samples from bristlecones on Mount Almagre and we did more than look at pretty views; we obtained up-to-date bristlecone samples. I only went up Almagre on the first day. Our permit lasted a month and Pete and Leslie spent two more days on Almagre, finally locating and sampling tagged Graybill trees on the third day.
Altogether (and primarily through the efforts of Pete and Leslie), our project collected 64 cores from 36 different trees at 5 different locations on Mount Almagre. 17 Graybill trees were identified, of which 8 were re-sampled. All the cores are currently at a dendrochronological laboratory, where sample preparation and scanning steps have been completed. Cross-dating is now taking place. For the most part, we tried to sample non-stripbark trees in keeping with NRC recommendations, but some stripbarks were sampled to reconcile with Graybill. Of the tagged Graybill trees, the tag numbers do not reconcile with the archive identification numbers and, in the absence of any concordance, reconciliation may prove more difficult than one would think.
We will archive at WDCP detailed information on the location of all samples (current spreadsheet is here) , which has already been sent to the U.S. Forest Service. Photographs of each tree are shown gallery here. Here’s a fun presentation that Pete prepared of our Day 1 itinerary. Here is a Google Earth tour. If you run it and when Google Earth comes up, go to Tools “ Play Tour , you’ll have some fun.
Some expenses have been incurred for this expedition. Leaving aside travel expenses (which were vacation expenses that I was going to incur anyway), the jeep got a bad scratch on the first day and cost about $500 to repair plus some more repairs from Days 2 and 3; it’s going to cost a few thousand at the dendrochronology laboratory for the sample prep, scanning and cross-dating as this has been done on a contract basis. I’ve submitted an abstract to Rob Wilson’s divergence session at AGU and would like to present these results (and to cover Pete’s expenses if he can come). On the basis that we submit a data paper to a journal, publication expenses will be another $800-1000 or so (academic authors pay the journals to publish). This has been a Climate Audit project so I’d like readers who contribute to the top jar to think about a special contribution for the bristlecone sampling. Maybe Martin Juckes, James Hansen and Michael Mann will contribute as well – I’m sure that they are all anxious for the results.
I’ll add some more information later in the day. Right now I’m off to visit the dendro lab and see how things are coming along. In 2002, Malcolm Hughes sampled bristlecones at Sheep Mountain and nothing has been reported or archived from this study. In 2003, Lonnie Thompson sampled ice cores at Bona-Churchill and we’ve heard nothing about it. One might guess that 20th century dO18 levels were not high as, at the nearby site of Mount Logan, 20th century dO18 levels were lower than earlier levels, attributed to regional changes in circulation rather than temperature.
I’ve obviously been very critical of what appears to be opportunistic reporting of results. With my experience in mining speculations, I fully understand how much temptation that there is to delay reporting of “bad” results in the hope that later drill holes in the program will salvage things. But you don’t have any choice in the matter – you’re obliged to report the results. Plus investors are smart enough to now that delayed results are virtually never good results.
Right now I have no idea what the sampling will show – maybe it will show a tremendous response by the bristlecones in the past 20 years – perhaps due to CO2, nitrate or phosphate fertilization, perhaps due to temperature increases. Maybe they won’t go up and we’ll hear more about the divergence problem. I don’t expect these particular measurements to settle anything. But jeez, doncha think that someone would have tried to find out?
Anyway I promise one thing: the measurements are going to be made public as soon as I get them. Just like a mining project. No waiting for 5 or 10 or 25 years like certain people. No losing the data like other people. Whatever they show. As soon as I get the cross-dated measurement data, we will immediately send it to the World Data Center for Paleoclimatology (which I expect to take place within a few weeks.) I hope that this will set an example to the trade as to the type of turn-time which is practical.
I’m visiting the dendro lab today to say hello and I wanted this to be on the record before my visit. I’m not sure how far along they are, but I think that they’ve finished sample prep and scanning and have started cross-dating. I don’t expect any results, but they may be far along enough so that I’ll have an impression of what the result growth will have been. So I wanted to be on the record on the planned schedule prior to my knowing anything about the results, just in case I get an impression today of what the recent growth has been.
UPDATE 2 pm. OK, I’m back from the dendro lab in Guelph. They are further along than I expected. The longest core is 883 years (Tree 30A). This had a Graybill tag 84-55, but if you go to the archived measurement data
and look for ALM55 (which would presumably be the match), there are no corresponding measurements; there is obviously a sequence ALM01, ….; there is an ALM53 and an ALM60. Is there an alter ego somewhere or is it missing? Right now we don’t know.
After sanding the core is scanned. The measurement of ring widths is semi-automatic. For these bristlecones, earlywood and latewood was easy to distinguish. Using a magnified version of the scan, each ring is picked out (with the computer recording the pick). The computer then yields back the measurements. I’ve posted up a couple of print-screens showing the most recent widths for 30A and the widths in the mid-19th century.
.
Below is a print screen showing the 30A ring widths from 1124 to 2007. I’ll post up a re-plot at some point with a legible x-axis. For orientation in the absence of a scale, the upspike on the left is 1174; there are low values from 1353 through the early 1400s; there is a 1690 spike; 1865 and 1880 are upspikes; 1941 is a small upspike.
According to the Team hypothesis of a positive linear relationship between temperature and ring widths, the warm 1990s and 2000s should have yielded the widest ring widths in history. What do you think? This is only one tree, but my quick impression was that recent growth was not elevated. So this looks like a Divergence “Problem”. If CO2 or other fertilization has been a factor, then I hate to think what the growth would have been without the fertilization. Remember the NAS panel saying that the Divergence Problem only affected high-latitude sites? Maybe they should have done some testing before they opined on this.
BTW while I’m critical of how the Team uses dendro information, I think that it is well worth supporting the collection of dendro information, even if it’s meaning is not clear right now. It has the advantage of being well-dated – and when you see the problems with dating ocean sediments, it’s nice to have some records that are well dated. There’s a role for it; so please – no posts dumping on dendrochronology. The dendrochronologists who’ve been doing this work (and who I will credit in due course) are excellent people.
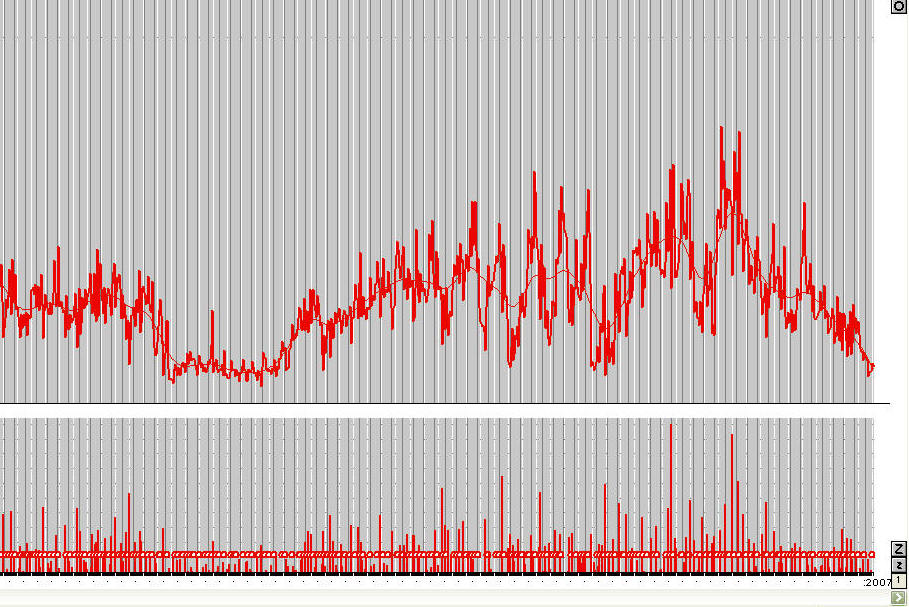
Tree 30A Ring widths. 2007 on right. i’ll replot this some time soon. For orientation in the absence of a scale, the start is 1124; the upspike on the left is 1174; there are low values from 1353 through the early 1400s; there is a 1690 spike; 1865 and 1880 are upspikes; 1941 is a small upspike.


375 Comments
Thanks for doing this, and nothing says thanks quite as well as PayPal.
PayPal? I thought Exxon and all the “Big Oil” would be covering the costs, paying-off the dendro labs to skew the results, etc 🙂
You’ll be please to know I’ve donated $5 to help cover your latte costs.
Steve
Didn’t they say at the National Academy sessions last year that tree rings were no longer working as a proxy?
Steve,
Outstanding, but you are missing out on the start of the Al Gore Fun.
Al Gore Joins Yasser Arafat
By the way, it would sure be fun to put the photos in their proper location on Google Earth! Anyone know how to go from [Digital Photos] + [GPS Locations] to [Tagged Photos] => [Google Earth Presentation] ?
It doesn’t appear to be easy (yet).
I’m interested in the tree ring data from that skinny tree in the foreground of picture #1.
Outstanding, Steve, I’m gagging to see the results. In the near future (but alot quicker than the Team can make a turnaround) I’ll put a donation in the tip jar (just need to OK my expenses with B.P., first).
OK, I will not tell anyone.
Steve,
I just dropped you a C note for your troubles. Keep up the good work.
cbone
Is that a TabletPC I see in some of the pictures?
Why Steve! You don’t have horns and a pointy tail after all! Its nice to place a face to the man who is doing the yeoman’s work. Excellent job!
Re: #11
Yes, I experimented using a bit more advanced technology for tracking and recording our location:
* Toshiba M400 Tablet PC, with several spare batteries
* SirfStar III GPS with Bluetooth adapter
* National Geographic TOPO! software
The experiment was successful in that we were able to accurately track and record our route and each tree (and the backup GPS turned out to be not computer-downloadable.)
The experiment also taught me that “next time” I’d want to use a modern field GPS unit. Battery life was unacceptable, the bluetooth connection required resetting after placing the computer on standby, and the software crashed multiple times, delaying progress.
>> Anyone know how to go from [Digital Photos] + [GPS Locations] to [Tagged Photos] => [Google Earth Presentation] ?
I can definitely help you with that.
Just one small question Steve Mc:
Did you remember to buy carbon credits to offset your carbon footprint, doing this study? I imagine there must have been some driving involved 😉
What about the Starbuck Hypothesis?
He shoots! He scores! Nice work, Steve.
#13 – hey, real teleconnections for a change.
Very exciting news. Added my contribution.
Uh, UCAR is in Boulder, not Colorado Springs. On a clear day I can see it from my window. Colorado Springs is about 75 miles from here.
I’m sure that Dano will will be along to congratulate you. He was always suggesting you get along to core some trees.
Dr. Mann, how expensive? Y’know, like maybe numbers would be preferable to broad statements? Do you think with over $20 billion spent on climate research, there might be enough in one of those grants to do this work?
Steve:
Contribution made. Excellent work, especially the Helen Keller quotation. I anxiously await the updated bristlecone proxies. By the way, the bristlecone I saw at Bryce looked much, much older- all gnarled and twisted. Any sense of how old these particular tree are?
I noticed the heavy equipment and the Brutes you brought alng to assist in the Job.
I would submit this tree coring job to the ‘dirty jobs’ program on Tv.
looks like you guys had fun. It’s a tree ring circus
20 euros winging it’s way by paypal. Keep up the good work.
I cored trees for a term paper as a freshman in college. I survived the expedition and the biggest expense was the tip I just sent you. Good job.
Steve your are a little tinker arn’t you. Ther’s always something cooking that you surprise
us with. Hmmm nobel peace prize for you.
As the months roll by we will all be privy to far more accurate records thanks to you-we may not like what we see but at least we’ll know where we stand
All the best for you, Anthony and all and your stirling work
Lawrence (3 I think I’ve seen a couple I’m sure)
Excellent stuff. True scientific endeavour, ready and willing to publish the results whichever way the chips fall. Hope you get to publish off the back of it as well.
I was just thinking earlier – according to Dano’s first law of field workology, the moment you drilled a hole in that tree, you instantly acquired the ability to perform statistical analysis on climate data. I think James beat me to that thought though 🙂
One small tip from Spence_UK, as part of one giant leap for climateauditkind.
“Ka-ching!” says the tip jar. Just added my contribution as well.
Nice work.
We have some areas where we disagree, but kudos for doing this. I am particularly impressed by your public disclosure and commitment to sharing the results prior to seeing the results.
Steve, this is really good stuff. I also just sent a C note to help the cause. Now I hope this donation does cause some adverse publicity or accusations of you being in the employ of the oil and gas industry because the money I just sent to you comes from my paycheck which is derived from oil and gas activities. I am Chief Reservoir Engineer at my company and we do produce oil and we are scrambling to produce more and hopefully some gas.
I agree with #23 in that with all the money spent on climate research a little could be thrown at this proxy cone activity. Keep up the good work. This is facinating stuff and great sleuthing. By the way, I have been doing numerical reservoir simulation for over 30 years and know how squirrely model results can be. Modeling climate/weather is a daunting task. As I tell my friends and family, “the weatherman can’t model one day ahead with the kind of accuracy I would like so how accurate do you think modeling climate 100 years out would be?”.
64 cores from 45 different trees at 5 different locations in 3 days by around 5 people…. The way the team talks about it, 64 cores would take months and hundreds of people!
Maybe we’ll finally find something out. Can you imagine that, 25 years? What have they been doing….
Free the tree rings!
All you folks are now “McIntyre et al. 2007” !!!!!!
😀
Hopefully more efforts to update these records will now take place.
My U.S. dollars added.
Make sure that lab data is done and verified independently by at least two or even three sources (you probably know this of course). Also maybe labs in US and Europe. Good luck
Heck, the last time I was at UCAR, August 29th, I did in fact have a Starbucks in the morning, then drove over 100 miles to survey two USHCN stations. While I was 1 for 2 in the effort, since one was so remote and difficult to find that I ran out of daylight, I was in fact back at my hotel by 10PM and stopped for dinner along the way.
What a bunch of pansies at UCAR. Go get ’em Steve. Great to see you doing field work!
Gunnar says
Awesome! Photos and GPS data are available online from the links Steve provided. Look at the “GPS Trees” tab for tree locations. If you can come up with a set of tools and process for the conversion, I’d love it. (The original photos are a rather large download. I’m guessing it will be much quicker to share the “how” than to attempt to transfer tagged files to me. And then I can tag everything else…)
If the hockey team had access to the Halliburton black helicopter to airdrop its lattes the way you obviously did they would have been up there years ago.
Steve: You forgot to add Phil Jones’s name to your list (Martin Juckes, James Hansen and Michael Mann).. uh huh, now it’s a gang of four… 😉
Great effort. Look forward to seeing results, regardless of what they may show. One question, is there some sort of ‘accepted’ methodology for this type of collection procedure? Will we hear later on criticisms based on the field procedures employed? Same for the lab work…will the resulting data be beyond dispute prior to further statistical analysis?
Thanks
I am contributing in honor of Michael Mann. I hope he gets the “thank-you” card.
Steve, will the Team say this was an unprofessional effort, or do you have that angle covered?
Great work.
SteveM, you rock and the tip is in the jar. Awesome idea and awesome to share it with the rest of us in this way. Way too interesting! Very exciting! Keep on shining that light of yours (along with the others who have helped you along the way) on this very important issue. Thanks so much. 🙂
I’ve had a lot of visitors since declaring “Stewart Dimmock Day”. Most European commentors share such witticisms “Has he (Dimmock) won a Nobel Prize recently?”
I will continue to refer readers to this site. It just seems counter-intuitive to me to advocate policy prescriptions in advance of an understanding of what our science of climate can actually understand, let alone predict. I can’t help thinking of those long-lost Mesopotamians seeking an answer for the world’s uncertainty arriving at the “Baal Solution”. Sacrifice needed? Let’s just hope the New Science whizzes don’t start looking at the world’s supply of virgins. A reduction in the world’s standard of living I can live with. A reduction in the world’s supply of virgins would just be wrong.
Thank you for your continued work…and scepticism.
Bernie (#22),
Take a look at trees 020, 022, 028 — are those gnarly enough? Just a guess, but exposure, bark stripping and age combine to eventually hit the trees with asymmetric growth. It really is amazing how healthy most of them look. The really bad ones are obviously victims of ancient fires. (More recently, human visitors have had a direct impact. We can talk about that painful topic later… for now, we’re focused on having fun with the adventure!)
Age — would hesitate to guess. There were a LOT of rings in those cores. We’ll know soon enough!
VG (#33),
A certain amount of the lab work can only be done once: removing the cores from their transport containers, mounting, prepping for the scan. We were very careful to preserve as close to 100% of the cores as we could, even with soft/loose/rotten rings. But the whole physical prep process could easily cause further damage. This part of the processing can’t be done in more than one place.
I’m curious about the process from there on out. Apparently a lot of it is now digital: digital photos, processed by specialized software. There may be a way to replicate the analysis, either by shipping the mounted cores, or by making the digital photos available. I’m sure we’ll learn more from Steve after his lab visit today!
Steve, Thanks for undertaking this. Perhaps you’d be willing to share some additional information:
What lab did you use? What fees did they charge?
I have cores from bristelcones taken near Denver, also obtained with permission,
and I need some help getting them cross-dated. I’m told they are among the oldest in the front range, yet see deadfall of trees on the barren slopes above them. Never got an answer back from a local expert as to what dead trees are doing at that elevation (above modern treeline).
Thanks if you can help,
Bill
Steve Geiger (#38),
Hope to have some helpful surprises there a bit later. One thing at a time, folks!
Right now, we hope that taking a page from other fields to pre-release the data provenance is of some interest. And we hope the data provenance itself is of acceptable quality (again, our standard of comparison is what we have experienced in other arenas.)
42, you bring up an interesting question. If you take several cores radially, how consistent are they?
I’d be curious how they actually measure the cores for rings. Maybe a CT or MRI?
Hats off to you Steve!
Also, I noticed a typo:
“Plus investors are smart enough to now that delayed results are virtually never good results.”
should be
“Plus investors are smart enough to know that delayed results are virtually never good results.”
MrPete, the Pete mentioned is you… duh!…
so you and your wife rock too! That’s what I should have said!! lol
Seriously thanks so much. It is all very cool.
We had a lot of fun — one of the first times my techno/data background intersected so nicely with her enviro/bio background… and in a drop-dead-gorgeous location as well!
Mr. Pete, I think I’ll need to send you something by e-mail.
Plus investors are smart enough to know that delayed results are almost never good results.
Webbed.Pete (at) gmail ought to work. Thanks!
As Gore’s canonization illustrates today, the battle is not about valid data, it is about public opinion. The Hockey team will likely work hard to bury any findings from this that don’t prove their point, and glorify any that complement it.
The (modest) tip is in the jar. Just yesterday I donated to Operation Mom for a friend manning a Chinook in Iraq. I hope you don’t get sent a box of cookies by mistake.
A few hints about the photo gallery:
Comments are accepted: sign in to picasaweb, and drill down to a specific photo. You’ll find a comment box at the bottom of the page.
Other options available at per-photo level: you can link to any individual photo, at any of several sizes. You can download the original full-size photo. (Very nice for the 360 degree panoramas! Download a copy of WPanorama to view them in all their glory.)
You can even download a complete copy of any of the galleries. There’s a link on the left at the gallery level.
I agree with #45->#42. Taking several core samples from different postions around the circumference and along the length of a single tree would be very helpful in understanding systematics. Has that been done? Do multiple samples hurt the tree?
#42
Pete:
Tree #28 is closest to the one I saw at Bryce – but I am definitively no expert. Terrific job.
Bernie
Paypal donation already sent, in memory of my late brother whose proposed doctoral dissertation was to be on the “philosophy of self-deception.” Alas, it’s not worth as much as it was in the days of the 67 cent Looney.
#54/45/42:
Columns AY and AZ in the data provenance file (Core Height, Side of Tree Cored) give a hint about that.
No single tree was cored more than four times; we tried to take two samples from most trees.
Tree #6 has cores from three sides plus (just to see!) from a HUGE root. Many two-core trees have samples from two sides or from different heights on the same side. We hope something can be learned from all this.
So, now you know which data samples to look for in asking your questions. 🙂
Also of interest, at least to me personally: many of the cores go through the center and beyond, so there may be additional “mirror image” data available. I hope the “extra” data is not just elided from the record.
No time right now, but it would be fun to do an “extreme coring” experiment on one of the trees on my own property. We only live at 7000 feet, so our trees are not stressed, but a few are very large. It would be interesting to core four compass points, at three or four heights, and see what we can learn.
How difficult was it to relocate previously sampled trees (the Graybill 17) one you were at the site?
Heh.
The available data: 2 sq km “bounding box” based on Lat/Lon. And quite helpful forest service people who had a few ideas.
Bottom line: we did not find them until day #3. That ought to tell you something.
It was not easy at all, and required a bit of a miracle. After day #2, a rumor was passed on, that tags had been seen near where we did our sampling on day two. So we went back again, determined to find the tagged trees. There was no reason to continue coring other trees, as plenty of “good” (non strip-bark) samples had been collected. All that was missing was exactly-identical trees; the “real” Graybill trees. It took a couple of hours of searching before the first one was found.
Once in the correct general area, many more were quickly found. (In fact, it was discovered that some of the day #2 trees were within a few meters of Graybill trees… but the tags had not been seen. Once the typical tag placement and style was known, and there was confidence more trees could be found nearby, it became easier.
Back from the dendro lab. See my update. It connects to a couple of images at esnips which will interest some readers (the full-size images from esnips are each 7.5 MB. We’ll make a friendlier version, but this is form a print-screen.
Which end of that printscreen is supposed to be the hockey stick blade?
The 100ppm increase in CO2 should result in a measureable increase in growth rate
Some references to studies at:
http://www.co2science.org/scripts/CO2ScienceB2C/data/plant_growth/description.jsp
quick question for a person of dendro background….could a physical stress (say, for instance, someone drilling holes into the tree) affect future year’s growth potential? Just curious.
thanks
Kudos Steve, you’ve earned my tip. I should divulge, of course, that I am a regular purchaser of petroleum-based products (as much as 20 gallons a week), so my tip might get you accused of being supported by the big oil companies!
>> dendrochronology
Obviously a valid scientific endeavor. The problem is in the interpretation. It would seem to be a good measure of the growing climate that the tree experiences. There are many factors that go into that, but I think it would be hard to argue that water is not the most dominant. It’s hard to see how it could possibly be a direct proxy for temperature. It would depend on where the plant is located, compared to it’s ideal temperature. For example, Cloud berries won’t grow south of around Trondheim. If the temperature were increasing, cloud berries just north of Trondheim would grow less well. This would seem to be the opposite of how it’s normally interpreted, no?
Re #63 (stress effect on future growth)
This was discussed early on with Leslie H (my wife) and Leslie T (Steve’s sister). They both have good bio backgrounds.
Let’s break that down into the two component parts:
1) Can stress affect future growth? Certainly. Just think about the impact of severe fire, drought, cold, insects, etc. Stress can kill trees. And can bring them close to death. Other stresses (think about pruning, for example) might help accelerate growth if anything.
2) Would drilling holes in the tree affect future growth? Not these (4.5mm) holes, at a few per tree and only done every many years. Even a slow-growing tree simply grows over the hole.
The only evidence we could find of previous coring was the metal tags on the trees. That, plus some significant evidence of recent human presence (trees cut down, remains of a large campsite) were the only thing telling us we were not the first ones to visit.
66, do they patch the holes, or fill them with anything? Does sap fill the holes in in short order? I’ve seen cedar trees die from perforation by insects. Those holes were maybe 1-2 mm, but there were many of them.
Steve: We sealed the holes – which is a Forest Service protocol for dendro work.
Great job Steve and friends.
I won’t pretend to understand all your charts and graphs.
But I do appreciate a man that gets his hands dirty for good science.
Here’s a hundred bucks for your efforts.
Regards
re insect damage:
I’m not a true expert on this (I just have to deal with the impact), but Leslie is away for a week, so I’ll tell you what I know:
Western Cedar Bark Beetles dig lots of tiny holes just as you describe; they’re similar to Mountain Pine Beetles (a scourge that impacts our own trees here.) See here for more. I doubt those cedars were hurt by the holes that you can see. The insects do a lot more damage underneath, essentially interrupting the entire flow of food for the tree.
Ultimately, it can be about as bad as cutting a ring all the way around the tree. Do that, and you do kill the tree. If there is no continuous path from roots to leaves along the bark/outer part of the tree, the tree is a goner.
RE: #15 – Next time, pack mules and horses, bro! LOL! 😆
RE Update 2PM
Steve it sure seems that the Maunder Minimum is visible in this plot. Is that it about 1/3 of the way from the left? The dates are hard to discern. Do they do any C14 dating to go along with the tree rings as an alternate dating method? The reason I ask is that I wonder if a tree can be fooled into doing 2 rings a year by odd weather patterns.
I’d concur with your early observation that it appears “recent growth was not elevated”. But then again, one tree does not a climatic conclusion make.
[snip – Gunnar – c’mon – you know better than to intrude this stuff on a tree ring thread.]
Depending on the results, we could see various excuses coming from the Team. Will we see a move suggesting that one site is no longer representative?
However, that was a ROBUST trip!
Great Work!
Mr. Pete,
What does your notation “compressed core” in the spreadsheet refer to?
Thanks,
Bill
Bill (#74) asks about the meaning of “compressed core” in the data provenance file.
Early on, it was noted that for many trees, the core sample was much shorter than the depth of the bored hole. For a 25cm deep hole, one might find the core to be anywhere from 10 to 24 cm long (approximately, just for illustration.)
More compression (i.e. short core in long borehole) appears mostly related to areas of very soft wood in the tree’s interior. We didn’t notice any wood that was obviously “rubbery”… it either felt solid and uncompressible, or very soft/crumbly.
This is an arena that we can only speculate about at this point. Do some trees have wood that so pliable one can’t trust the ring widths over certain ranges? I have no idea. My assumption: the compression is mostly limited to sections that are soft/rotten.
All of this led to some pragmatic choices in terms of methodology. It was determined that cores should not be neglected just because the sample was difficult to collect or save, or because it was not a nice long pencil/dowel of wood. One way or another, if a core was removed from the tree, it was saved and sent to the lab for analysis.
can’t you take some slices out of the peak and troughs and have a look at both the oxygen and carbon isotope ratios? It might be nice to know if the there is depressed/eleveated C14 from 1350 through the early 1400. The Oxygen data could show if the O2 ratios match growth, or something else.
Anthony Watts,
The poster that Siderova, et al, generated for Holovar 2006 refers to synchronization with known volcanic eruptions. Here is a very decent paper, (in the sense that even I can understand it), concerning the same type of synchronization wrt Polar Ice Cores. I’m looking forward to seeing that legible X-axis. The down spikes due to eruptions should be easy to find and identify.
Gunnar
It’s not about how the AGW’s treat this sort of data however the results turn out, it’s about gathering all the data which they have used and auditing it. If it turns out to confirm AGW, even though they have messed up their use of the proxi and Steve and Pete haven’t, then so be it. In other words if Steve and Pete² confirm AGW by their actions then we will at least know where we stand and what the future may hold because as sure as eggs is eggs there is nothing we can do about it.
But I know from your previous posts you know all this really.
I just had a thought. Now that the lunes of Danemark have awarded the IPCC team a lot of money, what will those scientists who asked for their names to be taken of the IPCC list be doing??
Re: Anthony:
Assuming this question refers to the long, flat period of narrow rings, I’d be very interested as well. If wagers are allowed, I’ll put my money on the 14th century, corresponding to the Great Famine in Europe. William Chester Jordan documents the (arguably) greatest famine in European history, and its causes, beginning with a description of the unremitting cold, wet weather that decimated crops, starting in the early 14th century. Here in Colorado, the anthropologists seem to like to point to drought during the same period as one of the major causes for the migration and disappearance of the Anasazi Indians. Brian Fagan describes the oceanic causes for that.
I’m anxious to see Steve’s results in whatever forms, but I do especially look forward to graphs of other clearly-dated cores, to get a comparison to this first, and of course his conclusions.
Bill
&”é’é'”( computer. it jumped. I was trying to say that the long flat bit is about the time of the great drought, it is also after the century of volcanos, and a bit before the MM. I guess the difficulty with using trees as a proxy is precisely that. Trees grow and don’t grow for many different reasons and the reasons cannot always be separated. God this is a difficult langue.
By the way, Steve most definitely gets the credit for this whole thing. I’m just the tour guide and tech guy 🙂 — sure, I can answer on-the-ground questions, but that’s most of my ability to be of assistance.
Steve envisioned, initiated, planned, prepared and promoted this, and now is guiding the analysis through to completion, at which point I’m sure he’ll then do the stats work as well.
For me, I just think it’s great to have the opportunity to serve in a practical way, that might be helpful overall.
The efforts and initiatives of Steve M and MrPete are to be admired and certainly worth a visit or two to the tip box. Perhaps we can do some wagering with the winnings going to the tip box along the lines of speculating on the reactions to Steve’s and MrPete’s efforts by the dendrochronology community:
1. They will embrace the effort and hold it up as example of individual initiative to the dendro community.
2. They well pretty much ignore the efforts.
3. They will consider the effort in the same manner as anyone elses doing work in dendrochronology.
4. The effort will be given significantly more scrutiny than what is afforded those works of the dendro regulars.
What does the temperature data look like for this region? Does it trend up or down during the last 50 years? Is it currently being collected in a reliable weather station per Anthony Watts’ criteria?
Will the analysis follow the original methods of the initial dendro analysis, i.e using a given few months of temperatures for calibration and sometimes regressing with TRW only and other times the TRW in combination with MXD? I assume, since most of these data will be used as an out-of-sample analysis, you will merely be plugging the measurements into the calibrated regressions. Does that mean you need MXD and TRW measurements? Are the processes for detrending for growth rates and other confounding factors part of the TRW measurements or does that take a separate effort?
You have my donation. Your satires are worth the price! Good stuff.
Did you have to fend off any prairie dog attacks while hiking? Those foul little rodents are everywhere out here.
Re #90:
Unless these data are written up in a refereed journal, then they are likely to be ignored, and rightly so. This is not to say that I think the data should be ignored. It is to say it should be written up. Science 101.
Ooooowwwww, a delayed knife-thrust — I love it. Even if the ring-widths go out the roof, it’s a big embarrassment to the “Team” & IPCC.
Erik #90, I’m interested in your perspective on this.
I would have thought that good (well-sourced, carefully collected) data is useful across the board, as part of the overall set of data that’s interesting to climate researchers. It’s data after all, not hypothesis nor conclusion. I would hope it could be fodder for lots of papers, including papers by a variety of climatologists.
Your statement leads me to a few questions:
1) Can one really write up “data” in a refereed journal?
2) Is there a bit of “NIH” in climate research (and perhaps other sciences)? Not Invented Here, or more accurately NCF (Not Collected by my Friends)? I don’t want to presume but that’s what your statement suggests to me. Data is only useful if written up in a journal paper.
94, that would be the most productive (and entertaining) part of the whole process, watching Mann and cohorts come out of the woodwork (so to speak) and try to challenge this work. Or maybe truer to form, they will ignore it during the comment phase, and then come out with a rebuttal paper later, so they don’t have to defend their criticisms.
Steve and Pete,
No matter how much fun you think you had with this “boring” pastime, you have your work cut out for you if you want to catch up with the pros: Next stop Turkey??
#96:
MrPete:
Typically scientific data does not exist in a vacuum. It is collected to test a hypothesis. That is particularly true in this case. Correct me if I’m wrong, Steve, but it was collected so as to ‘audit’ other proxy measurements. And nicely done, in my opinion. If it contradicts or confirms other measurements, then that adds to the general knowledge base in the field. But just as a medical doctor needs accreditation to find a job, data needs a similar process of accreditation so as to contribute to the story being developed. This is the day-to-day ‘business’ of science, if you will. If you work outside this kind of framework, then you run the risk of being ignored, like it or not.
Erik
I was always a bit skeptical about the accuracy of tree ring measurements. Can someone describe the process and give some sense of accuracy and precision. Are the boundaries between rings distinct or fuzzy?
re “catching up”…
Speaking for myself, I have no need to run in that race. I’ve got my own races to run in!
It would be good if this project is done well and helps promote a higher level of discourse in climate research. It would be wonderful if this data is useful for extending the record for BCP in Colorado by a few years. If the work results in something surprising, that’s more than I could hope for.
Who are we to have lofty goals? The Team has long argued that climate science can only be done well by climate scientists.
This work will stand or fall on its own. The nice part from my perspective: hopefully we’ve done good work no matter what the data says.
Honestly, it will be wonderful if very many of the core samples produce usable data! In my (semiconductor) world, it takes a lot of care to get high yield. I can easily see that coring a tree is not quite so reliable.
#92. Erik, all the measurements and dendrochronological work is being in an accredited lab. The site selection was, in effect, done by Donald Graybill.
As to testing a “hypothesis” : I didn’t have a “hypothesis” about what the tree rings would look like. The people with the hypothesis were the Team: bristlecone ring widths should have been off the charts according to Team theory. Me, I had no personal views or expectations. They could have been anything as far as I was concerned. It seemed outrageous to me that the Team should rely on bristlecone ring widths and seemingly be so incurious about them that they haven’t updated the results for nearly 25 years. (Of course, Hughes updated Sheep Mountain results in 2002, but not a whisper of the results. You might ask him where the results are.) For good order’s sake, we’ll submit a “data paper” somewhere. I don’t anticipate that I’ll do principal components on the data or try to see if there is a teleconnection to Czech temperature history.
Actually I did have one “hypothesis” – the Starbucks Hypothesis. That you could have a latte in the morning, collect bristlecones and be back in time for dinner. Now the trip was by no means a walk in the park; it required skilful 4-wheel driving by Pete but I’d say that we confirmed the Starbucks Hypothesis and disproved Mann’s excuse as to why this data has not been updated.
92,
Which is why the audit in the first place. I think we all agree that ensuring quality and integrity of the data and it’s manipulation is the mission. But what does refereeing do to insure quality of data? Isn’t it more a question of accreditation of the lab?
Steve/Mr Pete:
Great job!
Can you provide more details of what criteria you used to choose specific trees for coring? For example, did you consider the physical condition of the tree? Local topography and a tree’s exposure? Make random choices? Did you try to core multiple trees in close proximity and/or widely separated trees?
I’d really like to make a donation in direct support of this core gathering effort (mostly just to get a vicarious sense of participation.) I really hate Paypal, though, so is there a P.O. Box I could send a check too?
I don’t have the data set yet. That will be a week or two to complete the crossdating.
This is not the only bristlecone series in MAnn’s PC1 or for that matter the most heavily weighted – that’s Sheep Mountain, which Malcolm Hughes sampled in 2002. Maybe interested parties can email him and ask him for the status of his data.
As someone observed, this is just one tree that I’ve shown, but I got the impression from other cores that recent values were low. BTW here’s the section of the Graybill chronology that corresponds to Tree 30A from 1124 to 1983 (the one above goes to 2007.) It has a different and more HS appearance, but it’s not as HS as Sheep Mountain.
There’s something else that’s odd about Tree 30 (Graybill 84-55). It doesn’t seem to have been included in Graybill’s measurement data assuming that the identification numbers in the archive match the tags – and nothing in dendro can be assumed. I wonder what information exists on it in Tucson. Why wouldn’t it be in the data set? It’s not a cross-dating problem because the tree is absolutely dated since it’s alive.
#95 earns my donation. Why should anybody limit themselves to an argument or answer that can be inferenced from #92, that only a scientifiic hypothesis counts? I agree with Mr. Pete. I just “won” a business argument based on “show me the data, here is mine, where is yours?” It seems to me that this has been one of the underlying comments from the Team and others. I just have to wonder now that Steve has done as they asked, exactly what reception his data will recieve. Now Steve can argue, if he does his own correlation that disagrees with theirs, that if they don’t give him the code (theirs), obviously they were not using the right code (Steve’s).
I think the hypothesis should be that it benefits everybody if tree-rings are updated and work is confirmed (or denied or shown to be indeterminate).
Ok. Donation sent.
Steve, you sure have a penchant for stuffing Mann’s foot into his mouth. I know next to nothing about statistical analysis, so ignore this question if it doesn’t make sense. Since the Bristlecones were the PC that generated the blade of the hockeystick, would it make sense to go back to Mann’s original work and replace the original bristlecones with the result of this work to see what happens to the hockeystick?
Here’s a fun presentation that Pete prepared of our Day 1 itinerary. http://climateaudit.info/data/colorado/Almagre_Day1.kmz is a Google Earth tour. If you run it and when Google Earth comes up, go to Tools — Play Tour , you’ll have some fun.
Bill #91
Via your link, and a few more clicks, I found this page:
http://www.civag.unimelb.edu.au/~argent/treering/treefaq.html
which I found the most informative outline on the science.
Re #92
The data that Steve and MrPete are collecting will potentially , from my perspective at least, provide much needed out-of-sample results that can test whether and how much overfitting was used in calibrating the reconstruction. The people working in dendrochronology have appeared to ignore or certainly downplay this aspect of their methods. I doubt that this would be the case in other fields like econometrics, so perhaps this work is beyond the appreciation of the dendros. Publication, therefore, outside the dendro and dendro related fields may be a more judicious choice for presenting the results.
We should surely be prepared for whatever the results of this effort might be. I understand that means the creation of a “Censored” folder in advance…
Re: 104
So compliments only, Steve; the other comments get binned on Unthreaded? AnthonyW in # 51 and Larry in # 90 are both dead on.
Steve: You can discuss tree rings or things like that. I realize that Al Gore is in the news; I realize that many people want to talk politics and it’s hard to avoid this, but let’s keep the focus on scientific things.
OK, I give up: could anyone tell me why tree ring width is used to estimate absolute or rates of tree growth/year, instead of circumferential tree ring surface area? – Not to mention volume.
kinda funny and ironic to watch the sceptics come out about CA dendro. Kinda telling too.
OK, I give up: can anyone tell me why tree ring width is used as proxy to measure absolute or rates of tree growth/yr., instead of tree ring circumferential area?
Mr. Ramberg, [- snip. c’mon, be more polite. It wasn’t that bad]
Re: 108
StevenMosher
A comment I made earlier to SteveM that all the good science notwithstanding, I don’t understand the use of auditing without meaningful consequences, was binned on Unthreaded.
What am I missing in your comment?
Re: 110
StevenMosher
Clearly SteveM is editing no holds barred [it’s fine, his site]. I have no idea what Erik Ramberg posted that got you all steamed up.
RE 110.
I take exception to selective scepticism.
Plus, how can you snip a quote from Billy Madison. ?
RE 111.
Tetris. Here is what I mean. Expect the team to scruntinize your results with more
vigor than they scrutinize their own results.
Where I was headed with #90 is it might be a good idea to specifically invite Mann to comment on any paper review. Don’t give him an opportunity to say that he was blindsided.
Re: 106
SteveMc
Thx for for you footnote reply.
The politics of this thing are way out of the barn. I understand you don’t want to discuss politics/policy on CA. Your perogative and that file is closed here, as far as I am concerned.
What I have asked you before and was getting at yet again earlier this evening, because the answer is still not there: why do what you do on CA [which is clearly very important and something I am a great fan of] without a pathway to it having any real consequence on those who are not playing the game by the rules?
We disagree, but I don’t think that at this stage of the game the consequences play at the level of HT academic career consequences. Unless there is a way of funnelling what transpires on CA into the political realm, I’m concerned that you are moving water to little effect.
I think it’s a core issue. If you want to snip this, pls go ahead.
PS: You have my email address on file.
Steve: I’m not trying to change anything at a political level. I’ve often said that, if I had I a responsible political job and had to make a decision in the next 5 minutes, I would be guided by views expressed by institutions such as IPCC. However, if I had a year or two to make a decision, I would do what I could to try to improve the quality of analysis and information that decision-makers are receiving. The only policy that I’ve advocated consistently is better standards of data archiving and disclosure and better standards of ensuring that adverse results are reported.
What’s funny about the scrutiny: we’d be quite pleased with scrutiny. We have much to learn, I’m sure. And perhaps others will find something of value in the work we did.
With respect to methods, we do not (yet) know if our methods are more reliable or productive than those of more experienced specialists. We have to assume that we have much to learn here. So we welcome the scrutiny, and expect to learn much. If our methods somehow incorporated helpful innovations, that’s nice too.
With respect to data management, we assume our methods and practices are in accord with basic good practices to be expected of any scientist. We would be quite pleased to see examples of better practices than ours: more comprehensive provenance records, speedier public release of data, more transparency on selection methods, etc. Again, we’re just bringing in baseline practices from other fields. Our goal was to get useful work done within the constraints of the Starbucks Hypothesis, not to create the best dendro data set ever. I would expect that the full time dendro folk, with their years of experience, have done better than this.
And of course, as Steve has long said, we’d love to know where to find those extensive examples of analysis that make prompt and appropriate use of all data, not just the data that fits someone’s hypothesis.
Great work. I guess this is “Open Source Science”.. just as Linus Torvalds and a bunch of
nerdscomputer enthusiasts got together and built a world-class operating system out of sheer enthusiasm, so are Mr. McIntyre and Mr. Holzman benefiting science (and ultimately all of us). Will Open Source Science be the revolution in the climate realm that Open Source Software is? I doubt it, but with the sorry state of establishment science in this field, it would be nice.Steve Mc,
I know you have said elsewhere that if you had to make a decision today you would have to go with the Climate Consensus as it exists.
I would like a clarification. If this was a mining venture would you say invest?
A yes/no would be sufficient. If you would care to elaborate that would be good too.
Steve was obviously hard at work testing the Starbucks Latté Theory as well:
Steve: this is us just before leaving for Mount Almagre. When I said that we were going to test the Starbucks Hypothesis, I meant it seriously. Left to right: Pete Holzmann, Leslie Holzmann, me, Leslie Thomas (sister), Nola McIntyre.
Oooohhh… good question, M Simon. Off topic, and not a good comparison, but still a good question!
My thought: not a good comparison because I have choices with respect to mining and other investments. I can invest in any of 1000 options, or I can stay in cash. With AGW, the apparent choice is “alarmism” or “denialism”. Any more nuanced perspective (such as “we don’t yet know enough to take helpful action”) is not available.
The gallery has even better evidence 😉 …

From 1. Almagre Hard(ly) Work
MrPete,
We also have other options re:climate. Malaria eradication. Clean water for the third world. Accelerate fusion research etc.
However, your point is correct relative to my initial framing.
Where I’m coming from is that Steve has been on a tear, demolishing 2 to 3 papers a week for 2 or 3 years that I know of. That IMO is a HUGE hole in the work. Steve says he would like 2 years of better papers before making a decision. Given the state of the science and the actual current players on the Team, I think that 2 to 3 years is optimistic. Well I’m so far OT it is best I shut up and await Steve’s answer.
#100 and #101
I’m sure once all the requisite steps have been followed, Steve M and Mr Pete will almost certainly include the data from their ‘Starbucks hypothesis’ expedition in a re-analysis of MBH98 etc. Steve M will no doubt do this regardless of whether or not the data confirms or refutes the existence of the ‘divergence problem’.
I think what Steve M is attempting to do here is to embarrass Malcolm Hughes sufficently (as he has done with hansen etc) that he is forced to publish the 2002 Sheep Mountain data without which the Mannian PCA methodology cannot produce a hockey-stick shape. We know this, because Michael Mann knew this himself when he carried out his PCA and excluded the BCPs from it and chose to store the results of his R2 analysis in a folder called CENSORED.
For Numberwatch visitors – ‘In the Blue Ridge Mountains of Virginia on the trail of the lonesome pine….’
Regards
KevinUK
Ref 101
Sheep Mountain?
Extra BCP growth rate due to mineral fertilization?
Is that mineral Carbon or Nitrogen?
Is the clue in the name?
JohnA,
Could you provide names to go with the faces?
Re #119: Likely the reason you go with the consensus is you are supposed to go with the people doing the work and advising you, unless in rare cases you know better. But if the people advising you are not using good or all available information the advice can be flawed.
Anyway, that looks like it was a “robust” expedition!!
Great Post.
And a great reminder of how science should be done. I would encourage everyone with a cut tree in the backyard to do their own tree ring analysis. I casually looked at a bench made out of an old maple in my parents yard a few months back and I was able to see changes in tree ring width when the house was built (they cut down competing trees) when they harvested oaks before the war, and the gypsy moth invasion in the 70’s. Really a fascinating exersize for me.
Reading this post I have no doubt that dendrochronology is real and valuable, but I have to wonder what it informs about temperature unless you know all the other factors that affect a particular tree’s growth rate. One example I learned from my own exersize is that there is a survivor bias, so bad conditions which kill competing trees could cause wider growth for a period of years afterward. Is this accounted for? how?
#92 >> Typically scientific data does not exist in a vacuum. It is collected to test a hypothesis
Or to falsify an existing hypothesis. Data collection and archiving is all that is required for that.
#100 >> would it make sense to go back to Manns original work and replace the original bristlecones with the result of this work to see what happens to the hockeystick
No, since if the results are as I expect, it will falsify the hypothesis that tree rings are a good temperature proxy. Therefore, the whole idea of Mann’s reconstruction will be invalidated. You can plug that into Mann’s graph, but all you will end up with is: a reconstruction of tree growing conditions over time
#107 >> instead of circumferential tree ring surface area? – Not to mention volume
because that would imply that growing conditions are improving as the tree gets bigger. A bigger tree eats more, puts on more weight, but not because the growing conditions are better, simply because it is bigger.
#118 >> Open Source Science be the revolution in the climate realm that Open Source Software is
First of all, Open software is no big deal, fading every day. EBay is quite disappointed in buying Skype. However, the comparison is invalid. The rational purpose of publishing software is to make money. The rational purpose of scientific inquiry is to discover the truth. This purpose can only be served by placing all scientific data into the public domain.
RE: #128
#100 >> would it make sense to go back to Manns original work and replace the original bristlecones with the result of this work to see what happens to the hockeystick
No, since if the results are as I expect, it will falsify the hypothesis that tree rings are a good temperature proxy. Therefore, the whole idea of Manns reconstruction will be invalidated.
That result makes sense to me, so the answer should be “yes”.
(Bleah… the spam filter appears to be eating my recent posts. Too many links? I dunno.)
Keeping things in perspective, there have been some very good traditions in tree ring archiving – and some poor ones. The International TRee Ring Data Bank – started in Tucson and now maintained by NOAA-operated World Data CEnter for Paleoclimatology – was a very early effort at data sharing.
Some dendro people are better than others at archiving data. Jan Esper hasn’t archived anything as far as I can tell, but Ed Cook has archived a lot of series. Jacoby has archived a lot of series, but has diminished his stature IMO by being selective in what he archives. Keith Briffa archived some data about a year ago that he had collected about 25 years ago – better late than never. Schweingruber has made a very large contribution, but there is negligible contributions from the Russians.
Hughes who is at Tucson has a very poor track record of archiving – his sequoia data from nearly 20 years ago is unarchived as is his Sheep Mountain update.
One of the difficulties is that many of the sites used in multiproxy studies just happen to be the ones for which data is unarchived – the Team, as you know, is always “moving on”. So measurement data for Taymir, updated Tornetrask, Yamal,… is unarchived.
A year ago, I reported that
http://www.eebweb.arizona.edu/drift/drift_archives/06_07/12_01_06.htm
Re 125: I would assume that is Mr. Pete on the left with his bride (he does seem a bit familiar), so that leaves our host as the tall fellow in the middle – also recognizable from his great video appearances on YouTube. Plus, if you look closely you can see the “I ♥ Hockey” on the ballcap. Assuming he is also standing with his bride, that leaves the lady to the far right.
Sorry I can only spare the default tip at the moment, but I do want to support this valuable and sensible endeavor.
Steve: My sister Leslie from Colorado Springs is beside me; my wife is on the right. My cap is “B&R Squash”.
>> That result makes sense to me, so the answer should be yes.
You don’t explain why you think this.
Assuming the temperatures in that area have not been falling, how can you say that tree rings are good temperature proxy? This is exactly why the Team has not been updating the data, and why Steve M sarcastically refers to their reference to the “divergence” problem. That’s a subtle way of saying: not a good temp proxy.
Tree rings obviously reflect “tree growing conditions”. So, Mann claimed that “temperature” has a hockey stick shape, and Steve M/Wegman said “maybe, but your statistical methods were incorrect”, and now with this data, “tree growing conditions do not match the hockey stick shape”.
Your position seems to be “temperature is not a hockey stick, and what’s more, temperatures have fallen since 1941”.
But this is contradicted by actual temperature records.
Hey All;
I just wanted to pop in and suggest that in my limited experience that the width of a trees ring appeared to have much more to do with the available water and length of growing season then temperature. I think that jcb in post 127 points this out fairly well. The variation in annual growth has much more to do with the best conditions being present for flourishing rather then the limitation of growth.
I believe Dr. Mann attempted to address this issue a few years back in which he suggested that the area of analysis was chosen because of the limited associated variables. Meaning that the choices were limited to those such that the primary variable was the annual seasonal temperature. Of course, as any good statistical analyst will share, you actually do not want to limit your diversity of your population when comparing variables; however in this case the attempt appears to simply been to establish an association between tree growth and the suspected known variable.
Thanks for the opportunity to pop in and have a great day!
Dave Cooke
Who’s that leaving Starbucks?( photo from Gallery )
No WONDER we can’t find Waldo! 😉
Caveat Coordinates!
When reporting coordinates with higher precision than 1′ (1852 m), beware that it depends with respect to which geodetic datum the coordinates are given. Common datums used in the US are NAD83 (North American datum 1983) and WGS84 (World Geodetic System 1984). Differences can be as large as 300 meters, which is pretty annoying in a forest: you could end up barking to the wrong tree. 😀
So when using precise coordinates allways add (WGS84) or (NAD83) (eg)
http://en.wikipedia.org/wiki/North_American_Datum
http://en.wikipedia.org/wiki/WGS84
Gunnar, 135, I think I know why you’re getting confused. You think that falsification is a scientific concept, when in reality it’s a philosophical concept. Things are rarely that cut-and-dried in science. It’s extremely rare for a theory to be completely pw3ned in one motion. Most bad science dies of 1000 paper cuts. So forget about falsification, unless you’re in a philosophy class.
Hans, it’s true — we need to be sure that WGS84 is specified, as that’s what was used.
I’d be interested in any material claiming a significant difference between NAD83 and WGS84. Last I heard, the point of origin of WGS84 is only 2 meters different from NAD83, and otherwise they are essentially equivalent.
>> Gunnar, 135, I think I know why youre getting confused
Gunnar, 140, I think I know why youre getting confused, you need a course in logic
MrPete: This page excerpts the relevant NAD83/WGS84 info from the original NOAA source: http://www.mentorsoftwareinc.com/resource/Nad83.htm
Gunnar’s not confused at all. He is absolutely correct. Tree rings are not a good proxy for temperature. We also have richardT spouting about “teleconnections” and that sometimes, probably only when necessary to prove his case, the teleconnections cause trees rings to switch to precipitation proxies which are again proxies for temperature in another part of the planet. Indeed, the use of tree rings as a proxy for any one element of the climate is the most absurd hypothesis I’ve ever heard. This one graph doesn’t own the theory in one motion, it is yet one more obvious piece of evidence that proves the null hypothesis: tree rings are not good proxies for temperature.
Mark
Dear Mr. McIntyre:
I’d like to send you a copy of our new book for kids 8-12, called “The Sky’s NOT Falling: Why It’s OK to Chill About Global Warming,” by Holly Fretwell. Published by Kids Ahead, an imprint of World Ahead Media, this is the antidote the hysteria being generated by schools and “experts” like Laurie David and Al Gore. If you’re interested, please send your address along and I will send you a copy.
Thanks.
Judy
I can well understand why the team haven’t been back there, it’s clearly inhospitable territory. Why it’s clear from the discourse, and the accompanying photographs that a major vehicle accident occurred, and it would seem Steve had to be medivacced off the hill in a helicopter (pictures show this – although the team seem to be downplaying it – brave souls) and was hence unable to complete the mission, leaving it to the other brave members to carry on until they could be evacuated off the mountain top. Scary stuff, indeed it’s clear that they were completely lost up there, unable to navigate despite advanced equipment and weren’t able to find the wood from the trees for many days.
144, I’m not disagreeing with Gunnar’s conclusion at all. My only point is that there isn’t going to be a slam-dunk falsification. If the hockey stick is going to die, it’s going to die a slow, painful death from 1000 infected papercuts, slowly oozing pus. It’s too optimistic to think that you can kill it with one whack. It’s already been whacked severely, several times. But, like Dracula, it just keeps coming back from the dead.
The hocket stick died after the NAS panel, and the coffin lid was nailed down after Wegman took it to task. That’s the point I was trying to make. This plot is only further evidence of its obvious demise.
Mark
Mark, it’s alive an well, and living at RC.
Let’s put it another way: the hockey stick is the Rasputin of scientific dogmas.
Armand, thanks for that good link. It demonstrates the minimal nature of the issue for most purposes. At the time of publishing (1989), they said:
and
I guarantee the tree locations were not determined within a fraction of a mm :-)… it would be astonishing if we got within a meter or two! GPS isn’t that good.
RE: #124 – in terms of granola-starbuckedness, the AGW crowd have got nothing on CAers! 😆
Maybe Peets need to open up along the Front Range … (NorCal inside joke …)
RE 144. On the contrary. The tree rings show no warming since 1980 so they are excellent proxies.!!!
( just kidding, judo logic)
No one piece of data confirms or disconfirms a theory.
The team plays Sceptic:
It was the wrong tree, it was collected wrongly, it wasnt transported properly with a verifibale
chain of custody. That lab has made mistakes in the past, the trees are responding differently now.
It’s no longer sensitive to the climate because of XYZ, all the other trees series show something different
so there is a consensus of treemometers, the lab was paid off, what about the ice in the artic, see it
melting, there is so much other evidence that this one bit doesnt matter. We get to choose either this
bit is right and everything else is wrong or this bit is wrong and everything else is right. Occams razor,
it’s simpler to belive this piece of data is screewed up. What about the ice? Remember Katrina. Who you
gonna believe AlGore or your lying eyes. The precuationary principle says we should take the safe route
and believe in AGW so this bit dosnt matter. The MWP was real but we’ve moved beyond that since Global
warming models prove the CURRENT warming is human caused. The MWP was a freak…”
All sorts of ways to “avoid” the issue. Some logical, some bogus, some practical, some merely rhetorical.
RE: #136 – What you have written is especially true in the Western part of North America (and other places with either ongoing aridity, cyclical aridity, or, an innately wet/dry climate). Places that rely heavily on snow pack for summer moisture are of particular note. Anyone who is experienced in mountain related activities here out West knows that the main things influencing the amount of snow pack are absolute amount of frozen precip and its timing. Temperature is a secondary factor – the places that get snow pack to begin with experience substantial time below freezing every year, no matter how “warm” so called “global temperatures” may or may not be. What “global” (and local) mean temperature would influence would be the snow line, but in the area of the snow line, its a given that snow pack is highly unreliable and variable. The places where the most favorite high elevation “proxy trees” are found are all well above snow line, so even during a “recorrrrrrrrd warrrrrrrm” year, the amount of snow pack is purely a function of the absolute amount of precip and how late the precip was in the snow season (e.g. later means less sublimation).
153, you missed one: it’s not in the “sweet spot” (Mann’s description of the Sierras, saying that the location is uniquely representitive of the world’s climate).
154, one other complicating factor is that a “pineapple express” in the spring can wipe out a lot of snow pack in a short time. Ironically, rain can cause drought.
Sorry for the double post a ways back on the question of ring widths vs areas – I got the Error message which said my posts weren’t making it through at all.
Still not exactly on topic, to me it’s amazing that ring widths ever increase, given that the tree must construct more wood as circumference increases just to stay even with the previous year’s ring width. Certainly, something well beyond local temperature must explain it.
More on topic, I continue to be very thankful for and impressed with your efforts, Steve. Maybe science is not dead after all.
>> Mark, its alive an well, and living at RC.
There is reality on one hand and people’s perception of reality (and what someone is willing to admit) on the other.
Gunnar, maybe this should be continued on unthreaded, but the ultimate point is that the controversy exists in two spheres; the scientific and the political, and in the end, I’m afraid, what happens in the political sphere is driving what happens in the scientific sphere, rather than the other way around. So the hockey stick isn’t dead until it’s discredited in the political sphere. Only then will it be discredited in the scientific sphere. And it won’t be discredited in the political sphere until it’s so thoroughly trashed on its merits in a way that the average person can understand.
Right now, the criticism of the hockey stick is a lot of esoteric statistical voodoo in the minds of most people, so they look at Mann’s wallpaper, and Steve’s, and Steve’s connection to industry (gasp!), and conclude that Mann has to be right. This is why it’s such an uphill battle, and falsification, while it may actually be technically correct (depending on the specific claim) is irrelevant in the big picture.
Judy #145
Book is available on Amazon $12.21
and I have just recommended as a substitute for the Al Gore video to the Premier Ministre of the GB. He lost his case in the courts of GB this week. Al’s film was legally determined to have several inaccuracies.
#103 — Ken, let’s call it dendroclimatology, rather than dendrochronology. Dendrochronology is very well established. It’s been used to calibrate C-14 back 50,000 years, and workers in that particular field make no outlandish claims. Neither, once upon a time, did those in dendroclimatology. Really, the scientific nonsense is restricted to what should best be called dendrothermometry. That particular enterprise is rife with false precision, hand-waving assessments, and as Steve has shown, full of data-snooping, cherry-picking, and highly suspect ends-justified data manipulations. Not to mention a thorough misuse of PCA.
To add my 2 cents here and other cents in PP above, I, too, think that Steve’s and Pete’s coring expedition is a magnificent end-around. They may never have thought you’d actually go out and take some cores yourself. In one swoop you’ve suddenly outflanked (out-foxed) the entire field. It casts such a glaring light on the smug and wilfull incompetence of the dendrothermo crowd.
jcp re#127, an interesting observation- “One example I learned from my own exersize is that there is a survivor bias, so bad conditions which kill competing trees could cause wider growth for a period of years afterward. Is this accounted for? how?”
The “how” is quite simple, Plants compete with each other for available resources (light, water, nutients). Thin out a stand of trees (thinning occurs naturally too as the weaker ones get outcompeted) and the remaining ones will grow quicker until they reach a size at which they start to compete with themselves again.
Something else for the dendros to think about….
PS Steve, when you have all your data could you try a Mannian PCA on it and see what tumbles out?
Pat, 163, I’m not trying to pee in the punchbowl, but while I agree that it took a certain amount of imagination and chutzpah to just jump in a 4×4 and go do this (after having coffee at Starbucks, just to tweak their noses), in the case where the most perfectly and painstakingly produced and published results show a tremendous divergence, I predict that the Hockey Team will continue to obfuscate, and pretend that this means nothing. I’m not saying that it’s a futile exercise, I’m just saying that you shouldn’t expect the team to surrender. They’re going to go Rasputin on us, and refuse to die, no matter how many times they get killed.
Again, I’m not trying to discourage this work; I’m delighted and entertained. Just don’t expect this to be the final blow.
ref 165, The team may have more problems if the results are used to address Wegman’s criticism of Bristlecone pine proxies. Unfortunately, CO2 fertilization is only a minor influence BCP growth. Near ideal water availability and sunlight are the main factors.
While I would not advocate tree rings as a good indicator of temperature, the sub-arctic trees have environmental conditions that are more indicative of temperature. Not absolute temperature, but extended growing periods that could be related to generally warmer temperature.
The Larch trees versus BCP could make a good paper.
#135 Looks like a language problem. If the results invalidate Mann and/or dendrochronology, then it makes sense to do the analysis suggested, so the answer to my question should be “yes”. If we have the wrong or a partial set of BCP as Steve noted then it may not make sense.
RE: #157 – At the elevations where BCPs grow, a Pineapple Express would actually mean lots of snow. It would wipe out snow down between 6 and 7, maybe if your luck up to 8 thousand feet. An illustrative example. After the massive El Nino driven rains of 1982 – 1984, I had to postpone late April field work near Crowley Lake to nearly Memorial Day, due to snow depth. The area in question is at about 8 – 8500 feet. Oh, and it is about 10 miles from the White Mountain BCPs, which are at above 10K feet.
Larry, no need to switch to unthreaded, since I agree with your 160, with the clarification that both the political and scientific spheres you refer to are “perceptions of reality”, which of course, are quite important. But there is also objective reality.
169, The problem is, if the perceptions of reality aren’t advised by the objective reality, we will all be facing some very undesirable objective reality soon. The wheels are in motion.
#167, I think we do have a communication problem. I’ll try to express my view as clearly as I can:
if( tree ring matches recent temperature )
tree rings are good proxy
Mann result should be updated
answer to #100 is yes
else
tree rings are NOT good proxy
it’s a reconstruction of “growing conditions”
Mann premise is invalid (reconstruction of temp)
Therefore, Mann result should Not be updated
answer to #100 is no
#170, I agree.
Gunnar,
“The Emperor’s New Clothes” is a fine story about consensus reality. It is hard to break. One kid saying the Emperor is Naked is not enough. In fact I don’t expect this reality to break down until we have had 5 or 10 more years of cooling if then.
173, it’s going to be a cumulative effect. I don’t mean to be too much of a downer, either. What Steve and company are doing is akin to Toto pulling the curtain back and exposing the man working the controls. While that might not in itself be sufficient, it is important. Let’s take the discussion on what’s likely to happen over to unthreaded, though. Ok? To do justice to the question would simply be too far off topic.
I don’t think anyone’s made the point I’m about to make, so I may as well-
Regarding the “Starbucks Hypothesis” I think it’s worth noting that what Steve’s trip may have tested is the difference between free enterprise/individual action vs. institutional procedure. It’s easy under your own steam to jump in a car with some friends and just go there, because you’re your own master. Professional scientists are working in a big institutional setting and I’d imagine a field trip involves signifcant levels of bureaucracy, with risk assessments and elfin safety and procurement of supplies and transport and so on. Anyone who’s been involved in either the public sector or a corporate setting may get what I mean. That kind of institutional drag can turn a minor procedure into a major one. Not least, just having to justify why you’re doing whatever you’re doing to managers and other departments and so on.
I’m not saying Mann’s “excuse” is entirely valid and, hey, I’m a skeptic (darn I wish Exxon would send me some money) but I think it’s worth mentioning that to some degree Starbucks Hypothesis is comparing apples and oranges; or at least dainty pippins with giant stodgy cooking apples genetically engineered by a committee. The drag placed on even simple activities by institutionalisation can be enormous, far beyond what one would expect.
Re: #163
Darn, just when I got the spelling of dendrochronolgy down you change the rules. Dendroclimatology it is and shall be with options to use the references dendrothermometry and the work of dendros. Whatever we called it, my interest was piqued by Erik’s earlier reference to the need of showing competence through a certification process, albeit less formal, but similar to that process use to certify medical doctors. I was wondering whether that informal certification (or qualification to publish) would require any competence in statistics and particularly the part about using out-of-sample testing to determine the effects of potential overfitting of models.
I think that ring width is mostly determined by early wood cells. Formation of early wood cells is mostly controlled by spring and early summer temperatures. Lack of available soil moisture for growth at summer can cause the transformation of early wood cells to late wood cells earlier and this would hinder ring width formation. This is really site specific response. For example in dry Arizona ring widths are mostly determined by precipitation because the available soil moisture is the most limiting factor in growth. I assume that you can only reconstruct the strongest limiting factor of growth from tree rings, reliably, and this changes between sites. Even the exposure of the site can cause changes in limiting factor (north-facing temperature and south-facing precipitation). This would influence the responses of ring width to temperature and precipitation.
Temperature – boreal and alpine forests
Precipitation – arid regions and some permafrost sites
Temperate forests are not usually limited by any clear factor, thus dendroclimatology is quite useless in there.
Still, as a generalization, ring widths are usually responding to temperature and maximum density is responding to precipitation.
#176 — Sorry if I seemed a pedant, Ken. 🙂 I just didn’t want to see an honorable profession — dendrochronolgy — dragged through the mannian mud. I didn’t see Erik’s earlier comment, but I’d not like to see a scientist or pubs-submitter certification process. Such processes don’t demonstrate an understanding of science methodology, but only a test-taking competence. They can also be used to exclude the unwanted many. Proper science is strictly democratic. Anyone can participate, and the qualification is only the objective strength of the argument.
#175 — Ian I’ve gone on a few field trips. The way they usually work is that you pack up all your equipment and head on out. No bureaucracy. If undergrads were involved, there might be come sort of safety waiver. It’s true that safety is an ever-larger issue. Lawyers have their fingers in every single pie these days, which is why bureaucrats get so much leverage. But they’d not have any business if people were not so ready to sue for every grievance, real or imagined.
In fact I dont expect this reality to break down until we have had 5 or 10 more years of cooling if then.
NASA panel on solar cycle 24 was split, 50% high and 50% low, but it appears to be very tardy in arrival which favors the low predictions, Svaalgard on NASA panel has best track record and predicts lowest cycle in 100 years, almost all astrophysicists predict cycle 25 will be a Dalton or Maunder type minimum. CO2 forcing rubber meets solar road. Not only that, solar magnetics doubled during the 20th century, but in the last few years the Sun’s engine has slowed to the lowest observed levels in recent history. If solar magnetics influence cloud formation and planetary albedo as postulated by Svensmark etc then AGW is headed for ridicule.
#175. I think that it’s too simple to blame overheads for the lack of updates. At the NAS panel, Richard Alley was asked about this sort of issue and observed that it would be very hard to get a PhD out of updating an ice core and so it’s hard to either ask or get grad students to do such chores. Rob Wilson’s explanation for the lack of updates is that the funding agencies won’t support it, although I’m not sure how hard any of them have tried. Their occupational incentive is to do new sites rather than re-visit old sites and I suspect that that’s more of an issue.
ref 179 Glad you said that, I was afraid of getting snipped since solar doesn’t count anymore.
ref 180, no doubt, but a comparison of BCP and larch trees for valid historical temperature reconstruction could be a good thesis. One might have to delve into alternate growth factors though.
True, but it seems it wouldn’t be too much of a task to tell the grad student “you want to analyze ice core data, you go update the cores!”
Maybe it’s just me, but I thought grad students were the last bastion of slave labor. My advisor has specifically made it clear I’m working for his glory, not mine! (well, not really, but he’s made it clear I MUST be published with his name attached… I’m his last student).
Mark
Steve McIntyre,
We can help with your graph on your article above. If each one of us takes the sample of one bristle cone at our locations and send you the measurements of the rings. I think you’ll have samples from the whole world.
Not really. I worked in research at the University of Alabama in Huntsville for almost ten years and field trips are done all the time for the most flimsy reasons. Heck our ASCE concrete canoe team spent about $40 grand per year on the boat and the trips to regionals and nationals. I used to fly to conferences all the time, paid for by NASA grants or overhead.
Re # 175 Ian: Your explanation would have a small amount of credibility if the concerned Hockey Team members could prove they actually applied to go on a field trip. However, I doubt that happened.
**Professional scientists are working in a big institutional setting and Id imagine a field trip involves signifcant levels of bureaucracy, with risk assessments and elfin safety and procurement of supplies and transport and so on. Anyone whos been involved in either the public sector or a corporate setting may get what I mean. That kind of institutional drag can turn a minor procedure into a major one. Not least, just having to justify why youre doing whatever youre doing to managers and other departments and so on.**
Re #175 — I agree that this is an excuse some might make. Doesn’t make it valid.
In the computer industry, some regions of the world have a tendency to act as if Very Specialized Knowledge is needed to be effective in creating high tech innovations, and It Is All Very Complicated.
Where I come from, even grade school students can be innovative with computers. (As a teen, I hacked together an app that was appreciated by R&D scientists at the lab where my dad worked. I was “paid” by way of a letter of recommendation from the lab head, and a prepaid professional course (woo hoo! A week out of school! :-)). They didn’t care that I was only 16 at the time…)
The same thing goes for any area of science. A fourteen (?) year old has published an article in JAMA, etc.
In any case, the CA tree ring team included a number of professionals. They just didn’t happen to have “Climate” in their job titles. And yes, they needed supplies, permits, insurance, transport–a jeep with heated leather seats to fulfill the Starbucks Hypothesis in style 🙂 .
#187. So as yet the hypothesis has not been proven true as you are not ‘climate scientists’. It remains for a true climate scientist to actually prove the Starbucks Hypothesis.
Excellent work SteveMc and crew. I’ve hit the Tip Jar to help with expenses.
Full Disclosure: My work is funded entirely by the taxpayers of the United States, and I thank all of you.
Great work Steve.
Ive kicked the tin 20.
Always stick to the truth, what ever it maybe and where ever it may lead us.
My hat’s off to you again for this excellent attempt to gather more real world data and compare it to the reconstructions used by others. And once again, I have to make note of the difference between Steve’s effort here and many of the “consensus” scientists, the sheer openness displayed by Steve’s team. All the data, descriptions of what was done, etc. freely published, regardless of whether the final result is the “right” answer, the important thing is that it an accurate answer, not if it supports the cause or not.
Kudos again.
This project, and some possible ramifications, seem indescribably delightful.
Re:178 If memory serves it is not so clear. I think Steve noted 2 or 3 years ago that one set of Gaspe Cedars was rejected because they showed no warming signal. They were on the north side of the the hills, and in the shade all day. In such a case the trees on the south side showing a signal were probably reflecting insolation rather than warming. There is also the issue of the inverted V response. Dendroclimatology needs to consider all factors rather than jumping to conclusions about a link between ring width and temperature.
re 151:
Indeed the difference between NAD83 and WGS84 is neglectable on your scale of observation (bad example), I must confess I am more familiar with African and European datums where these differences do matter.
Anyway, do allways report the used geodetic datum with your observations, its good geodetic practise and its an essential part of your location data.
RE: #178 and 193 – To make it simple, assume that the main, annually reliable supply of moisture is from snow pack and that anything in addition is a complete crap shoot based on whether or not a particular cell from local convective development or monsoon moisture passes overhead. You’ll get maybe a half dozen such events during the annual dry season (May through October) if you are lucky – some years, there are none. With the exception of places like the central – northern Cascades and the Coast Ranges, plus a few microclimates in the Sierra Nevada, this is the story of the US West above 8K feet.
http://www.connix.com/~harry/treeline.htm #195 This has some interesting information about causes of mortality in high altitude species.
I don’t want to be a stick-in-the-mud, but do be aware that journals often have very restrictive policies about publishing information that has been previously published.
I would hope to see your efforts vindicated in a peer-reviewed journal at some stage !
per
Hans #194 — thanks again for highlighting the need to list datums in the data dictionary. An updated spreadsheet file is on its way into the site 😉
per #197 — This is all raw data. No analysis, no conclusions. I’m confident journals will publish new findings based on already-public data.
#197. there seem to be very different traditions in climate science and economics. In econometrics, as Sinan will tell you, working papers will often be in circulation for a while and this is viewed as a way of enhancing their merit.
In dendrochronology the biggest disadvantage is that you can only reconstruct the most limiting factor reliably and because every site has their own site-specific growing conditions, all the generalizations regarding limiting factors are at the best inaccurate or compromised. Influence of exposure of the slope has almost totally been overlooked in dendrochronology because most of the researchers have faith that the standardization procedures remove most of the tree-specific and site-specific responses after which “common” or area-specific climate forcing is visible in tree rings. I strongly disagree with this. Even 500m difference between trees can cause significant changes in limiting factors. Of course, their “high” sampling standards can diminish the problem.
Because of this neglect of site-specific growing conditions, dendrochronologists have never really paid attention to inform the exact sampling sites. They seem to believe that all the samples can be averaged or rounded to reveal common climate forcing in the specific region.
#200. You mention what you describe as the “biggest disadvantage” of dendro. But here’s what Esper, one of the coauthors of Juckes et al, describes as an “advantage unique to dendroclimatology” in Esper et al 2003 – a statement which the referees didn’t blink an eye at apparently:
Are Graybill’s “missing invoices” a result of him applying the dendroclimatology method described here by Esper? Seems worthwhile finding out.
Here’s another gem from Jacoby:
This was his excuse for archiving only 10 of 36 datasets collected in the late 1980s. Stephen Schneider accepted this absurd excuse. Check the Jacoby category link in the left frame – scroll back to the old posts for some treats.
Did I read that right?…. More is always better….. unless you have a preconceived idea, in which case, use the proxies that best fit your preconceived idea and exclude any that don’t.
You read that right. And you have the context.
I feel sick Bender….
#199
This strikes me a eminently sensible I wish more branches of science would operate like this.
I’m still a bit baffled by the method used to measure tree rings. Steve’s measurement data from the lab shows measurements like 0.401 mm. Wow. 0.001 mm accuracy for the width of a tree ring? Are the boundaries of the rings really that distinct? There’s a couple of problems here. First, the average machinists would have trouble measuring a precisely milled steel cylinder to +/-0.001 mm. I am generally taken to believe that the boundary of a tree ring is bit more, well, fuzzy than the rather well defined boundary between a steel cylinder and air. Second, is the width of a tree ring precisely the same no matter where its measured along the circumference of the ring. It would be truly surprising and startling to discover that a tree rings width is uniform to less than 0.001 mm all the way around. So these data imply a precision that I simply can’t believe. What is the real world measurement error of a tree ring and what is the circumferential variability? And how would this measurement error effect Mann’s reconstruction.
This goes to the issue of unintended bias. Lets assume that the people doing the measuring a well meaning, but pre-conditioned to believe that the tree rings are an actual record of global warming.
MPaul #203,
Good questions! OK, I’ve converted Steve’s screen shots of the tree ring analysis in progress, and started a new section of the gallery online. The screen shot below may be helpful to you. We’ll have better answers to your questions once all the measurements are complete.
Some observations from the screen shot (click on it and click on the magnifying glass to view at full size…)
* For reference, the core width is approximately 5mm (0.2 inches).
* As you can see, the measurements are done by way of high resolution digital (macro) photos.
* (Big assumption) if the screen shots are viewing the sample photo at 100%, I count on the order of 20-22 pixels
per ring-width. If so, a 0.4mm ring is measured to an accuracy of about 5%, not 0.2% 🙂
* On the other hand, one can get a pretty good idea of the total width of a set of rings. If ten rings are 4.0mm, in 200 pixels, then you know at the total to +/- 1% or so.
* This photo gives a good example of some potential uncertainty sources. Obviously, the sample was not taken perfectly radially. Even within the photo, you see variations.
I too am curious how the data measurements are reported. What is considered to be the accuracy and precision of the data? Is it rounded before being archived? These questions are independent of how multiple cores are analyzed as a set.
#200,
We all (especially Leslie H) have been curious about this as well. That’s one reason Leslie was careful to record so much site and tree-specific detail in the data provenance file.
In this data set, if all cores turn out to be usable (THAT would be amazing), you will find samples from just about every exposure other than West. Many of the trees were on gentle slopes, but even so, the ground on the north side is always going to be colder than on the south. Anyone who lives here knows that the north face of Pikes Peak often has snow until June or even July.
It would be fun to see if there are any correlations between exposure, altitude, soil conditions or ??? and growth rates, etc.
Dendrochronology was never meant to become a method to form climate proxies. Tree rings are bad climate proxies because of high “uncertainty” to determine what climatic or physiological factors influence the growth in that certain area of measured wood cells. Dendrochronology is a good method in timing of past historical events, but as a base to determine climatic factors it is like looking through unfocused camera. You can see some patterns but the picture is never clear. Of course you can choose the best “pictures” and write a good story, but in those cases you are leading your results and story towards the predetermined goal.
The boundary of the wood cells are clear, but even here the methods used to measure the ring width can have major influence on the results. X-ray photos where you can clearly see every wood cell is the best method but to obtain good quality x-ray photos from the cores is at most times overwhelming task.
Every extracted core only represents the few millimetre area of the tree’s circumference. At best, the tree ring samples are estimates of radial growth. In high latitude or altitude tree boundaries the growing conditions can be so harsh that trees do not form even a single wood cell in a growing season (in Siberia 60+ years of radial growth can be found in 1mm of wood). I can assume that in case of bristecones the trees do not form constant amount of wood cells around circumference (twisted forms). Thus, the quality of extracted core sample is in most cases base on luck, even thought experienced eye can try to locate as good extraction point as possible.
As a summary. To use extracted cores and measured ring widths to form climate proxies possess so much uncertainties that even in best intentions the results can only show the way where to “look at”. But to focus on that “look at”, you should use other research methods.
Woops, typo correction.
(in Siberia 60+ years of radial growth can be found in 10mm of wood)
#203
With travelling microscopes measuring with that precision should not be a problem. Since the ring sizes relative to each other in the one tree is what matters it does not really matter how the beginning and end of each ring is determined, as long as the method is consistent.
That’s why such proxies must be calibrated against real world measurements and from what I have seen so far the tree for which the data is charted above is no proxy for GISS temp.
I found the brochure on the WinDendro software quite illuminating. They use a normal scanner to bring in the images. I think there’s still some very good items to be understood about uncertainty, CI, etc.
If I’m calculating correctly, a 2400 dpi scanner, at best, resolves to .01 mm… a few percent of a 0.4mm ring. Not too shabby!
Out of all the uncertainties in this, I think that the uncertainties in ring width measurement are very far down the list of issues. Archived information with core sequences ending in 999 are measured to one digit less than cores ending in -999 (The more modern measurements). This was discussed in a post last year.
I would be very interested to see the variation that occurs between multiple cores within a single tree. (i.e. repeat sample error)
I started to think about the usefulness of tree ring proxies in climate reconstructions and one thing started to bother me. As was mentioned earlier, early summer temperatures are mostly the limiting factor in ring width formation (see graph for example). In the graph, current year June temperatures mostly influence the formation of ring width for the study period 1936-1996.
Now, if we use the ring width data to reconstruct the past temperatures, aren’t the reconstructed temperatures mostly June temperatures, not annual temperatures, because other months do not have significant influence on ring width formation. If this is the case, then we could easily say that the whole concept of tree ring climate proxies is useless.
Same of course applies to precipitation.
Ah, I have problems to get the graph shown.
#re201 “Before venturing into the subject of sample depth and chronology quality, we state from the beginning, more is always better. However as we mentioned earlier on the subject of biological growth populations, this does not mean that one could not improve a chronology by reducing the number of series used if the purpose of removing samples is to enhance a desired signal. The ability to pick and choose which samples to use is an advantage unique to dendroclimatology.”
This says it all to me- and should to anyone with half a brain. Choose the data that supports your hypothesis and bin the rest. Certainly is an advantage “unique to dendroclimatology”. I would fail any student of mine who presented work of this nature. The very fact that journals- JOURNALS!!!!- accept such rubbish defies belief.
Mark T,
I know of several people who routinely cite the hockey stick. One of them even claims that the NAS report was a complete victory for Mann and the hockey stick.
Hans: Thanks!
Wow, my graph is small. Sorry about that!
ooops

“This says it all to me- and should to anyone with half a brain. Choose the data that supports your hypothesis and bin the rest. Certainly is an advantage unique to dendroclimatology. I would fail any student of mine who presented work of this nature. The very fact that journals- JOURNALS!!!!- accept such rubbish defies belief.”
I don’t think you get it. If a specific tree does not calibrate with the temp record, then why would you keep it? It is not a temperature proxy. They are doing a study of trees that match the calibration period, so if they decide a tree doesn’t match the calibration period, it is of no use in attempting to reconstruct past temperatures.
You can argue about statistical methods and how samples are determined to fit the calibration period, but there’s nothing wrong with searching out a verifiable temp signal and ignoring trees that might be affected more by other factors.
I have to agree with 207; this sample does not appear to reflect temps for the calibration period.
Re#220, you have briefly summarized exactly why these bristlecones should not be used in temperature reconstructions – a point made by many but ignored by MBH98 and supporters. And as we all know, MBH98 doesn’t have a leg to stand-on without the bristlecones.
We’ve got a few more decades of surface-based temperature records. If any of the climatologists would listen to the neverending cry of, “Bring the Proxies Up-to-Date,” we would be able to see just how well the proxies do represent temperature. Yet as repeatedly noted on this site, nobody seems willing to do such a thing (although some have done such a thing and then not reported results).
It will be interested to see how all the tree samples pan-out. I agree that, “this sample does not appear to reflect temps for the calibration period.” But what if none of them do? What does that say about the bristlecone proxies so important to MBH and so many other reconstructions?
Boris,
Boris says:
Why not just sit at your computer and generate random walks, pick the ones that fit whatever your theory is and save all the trouble of observing nature?
No scratched jeep, no fuss, no muss.
Every verifiable temperature signal is there inside your computer, waiting discovery – what are you waiting for, you can personally revolutionize climate science!
Cliff
>> The very fact that journals- JOURNALS!!!!- accept such rubbish defies belief.
Why do you expect journals to be primarily interested in truth, when they are required to be motivated to sell magazines, ie filling space. What am I missing? I used to know an editor of a scientific journal. She was an accomplished journalism major. The business of putting together a magazine is done by professionals, professional writers, not scientists.
>> sample does not appear to reflect temps for the calibration period. But what if none of them do?
Right, if you sample 5 trees and only one matches the calibration period, isn’t it more likely that it’s chance or a temporary situation? It would seem very likely that even the one that matches in the calibration period would not match for any longer time period, let alone thousands of years. To be more specific, the conditions that caused the other trees to not match during the calibration period are likely to have affected the matched tree in past times. Thus, tree rings are not a good temp proxy, but are a good measurement of “tree growing conditions”.
One point that I have not seen mentioned is the idea of “limiting factor” not being that universal. Certainly, there are situations where there is a limiting factor, and increasing the others doesn’t affect the output. However, there are also many situations where the output is the result of numerous factors, and none are specifically “limiting”. IOW, changing any of the major factors affects the output.
Boris said:
Boris, this is absolutely repugnant. All results need to be reported. No expurgated results. You have to report results that are adverse to your hypothesis as well as results that support it.
The process that you recommend turns climate scientists into practitioners who use methods illegal in mining promotions. In mineral exploration, you’re looking for an ore body. But you have to report bad drill holes as well as good drill holes. If you can create an ore body model, then fine – but ALL the data must be used somehow even if it’s defining the limits of the ore body. Withholding data is illegal for mining promoters and no one has ever given me any reason why climate scientists should use standards illegal for mining promoters, and I’m disappointed that you have become an advocate for such such practices.
Boris,
Don Keiller says:
Boris, on reflection, I thought I better check:
In 1967, I was med-evacuated to a hospital at the 9th division base camp at Ben Cat, Viet Nam, to get a shoulder wound patched up. While I was there, I met a fellow draftee that had survived having half his brain shot away and was making great progress learning to take care of himself again.
If that fellow was you, I would, and I’m sure that Don Keiller would, like to apologize for making fun of your disability. If that was not you, I think you have the makings for a really good law suit against your parents.
Cliff
Already in 1954 Darrell Huff wrote “How to Lie with Statistics” containing following chapters:
1. The Sample with the Built-in Bias
2. The Well-Chosen Average
3. The Little Figures That Are Not There
4. Much Ado about Practically Nothing
5. The Gee-Whiz Graph
6. The One-Dimensional Picture
7. The Semi-attached Figure
8. Post Hoc Rides Again
9. How to Statisticulate
10. How to Talk Back to a Statistic
cum hoc ergo propter hoc
Boris #re220 OK let me put it another way- would you defend a pharmaceuticals firm who set up a drugs trial and then selected just those results that suggested that the drug in question was of any use? Thus “We took 100 patients with condition x, 16 of these patients got better, the rest showed no change, or got worse. So what we did was to select those 16 patients and present these patients and these alone as evidence that the drug was effective”.
Joking aside, if tree ring proxies are going to have any use in climatic reconstruction- for temperature, water availability or whatever, what first needs to be done is to set up meteorological stations (properly) exactly where these these trees grow and monitor conditions for at least 25 years. Then see is the averaged response (not just the cherry-picked few actually correlates with local (not somewhere 1000s of miles aways, or “global”) conditions. Then and only then can you say that for this short period- and this period alone- was tree ring growth acting as a proxy for this environmental condition or that. Even high school students know (or should) that it is a very risky procedure (and quite often wrong) to extrapolate results beyond the calibrated range.
Maybe it is about time that Mann, Juckes and company and those who believe the stuff they say about temperature proxies should go back to school to learn some basic science.
I’m stunned by that rationale. Could you imagine what results they’d come up with using that approach if they were studying UFOs?
Boris has stated the definition of ‘cherry picking’. Very precise cherry picking at that.
I think that we all know what cherry picking is, what Boris (et al) did was attempt to justify it.
I think Boris had come up with a really good mechanism here. With the Boris method, we don’t need to restrict ourselves to temperature or moisture: by choosing the right set of trees we can use tree ring widths as a proxy for anything. All we need to do is find some trees that match recent stock market movements and we’ll be rich beyond our wildest dreams!
Steve McIntyre says:
Steve, I’m completely out of my element when it comes to tree rings, but I’m often amused by the difference in the sensory systems of scientists and engineers. A scientist sees a number like 0.401 mm and sees beauty and hears harp music. An engineer, upon seeing such a number, smells bull excreta.
Boris,
If Bristlecone’s are a temperature proxy, then the vase majority of trees should follow temperature trends. The occassional oddball won’t, but most will.
What you are claiming is that it’s OK to only keep the data supports your theory, the rest can be discarded.
Try running that theory past your lab instructor tommorrow, see how far you get.
When I did lab science, my profs required me to keep ALL of my data. If I had ten runs that matched what I expected to see, and one that didn’t. I could not just throw out the one that didn’t. If I could explain and demonstrate why the one was bad, I was allowed to not include that run in my calculations, but I still had to document the bad run and my explanations. So that if anyone wanted to challenge my decision to toss the one run, they could.
“MPaul says:
October 15th, 2007 at 9:43 am
Steve, Im completely out of my element when it comes to tree rings, but Im often amused by the difference in the sensory systems of scientists and engineers. A scientist sees a number like 0.401 mm and sees beauty and hears harp music. An engineer, upon seeing such a number, smells bull excreta.”
And to think, all this data is being used to support a global temp increase of .6 degree.
205:
I don’t think that this is true. Tree ring studies are very valuable in chronicling periods of drought, and they have been used successfully for this type of climate study for many years. Trees (all plants) in areas with moisture deficits are extremely sensitive to moisture levels in the soil. However, I don’t think they work well for studying temperature, because of the confounding effects of moisture, the fact that growth DECLINES at temperatures above about 25 degrees C, and for many other reasons.
Regarding the accuracy of the tree ring width processor:
I’m not saying this is how it works (!), but it looks like the tree ring is estimated using a local line fit, not sure how (possibly a Hough transform of the local image, followed by an interpolation if the point is sharp enough?)
It is entirely possible this could be achieved with sub-pixel accuracy, since it is a measurement over a number of pixels, on the assumption that the local portion of the line under test is sufficiently close to a straight line.
That said, 1/25th of a pixel accuracy sounds like a stretch; but then for the reasons noted by MrPete above, retaining the significant figures could be useful if an integration step along the rings was subsequently performed (plus it is usually best to round at the end of the processing chain, rather than incrementally, and the ring measurement is not necessarily the end of the processing chain!)
# 232 MPaul,
I really don’t see what you are complaining about. I’m also an engineer and in the early 1980s I spent a year evaluating floppy disk heads which had 40u In. gaps – I had no problem measuring those gaps to the nearest 0.5u In., using a good microscope with an optical comparator. I didn’t see beauty and hear harps, but given reasonable equipment, measuring to 0.001mm (39u In.) is not a big deal.
Cliff
I imagine it’s much more difficult to go get tree ring samples wearing full hockey uniforms (stick, gloves, and skates includd, of course!).
Steve Mc, here is your next latte driven coring adventure:
http://www.upi.com/NewsTrack/Top_News/2007/10/15/europe_helps_hungary_save_ancient_trees/8342/
BUDAPEST, Hungary, Oct. 15 (UPI) — European scientists want to help Hungary preserve 16 cypress trees, estimated to be 8 million years old, Hungarian media said Monday.
The trees, uncovered in a water-soaked lignite mine in Bukkabrany in northeastern Hungary in August, are unique because they have not turned into fossils and thus could lead to clues to plant life in prehistoric times, the Hungarian news agency MTI reported.
A group of Danish researchers, experienced in restoring old Viking sailing boats they found underwater, offered their assistance in conserving the Hungarian cypress trees, the Eszak Magyarorszag newspaper said.
Experts from Italy, Norway and Sweden said they are ready to provide whatever help they can.
Officials from Finland and its ambassador in Budapest inspected the trees during the weekend.
A Finnish firm is to provide steel tanks to store the four trees that will be dipped in a special glucose solution to strengthen the trees barks. The process of soaking is to last up to four years, the newspaper said.
for all ye people curiuos about recorded temperature history of the Colorado Springs Region, here is a GISS graph relative to 1989.
re. 220 What you suggest is not the best practice IMO.
It’s in fact recognized as a bad practice. Check wiki on the “file drawer problem”
best.
I’m surprised you still don’t get it, Steve. The “expirgated results” are trees that do not match the calibration period. They are not results at all. The hypothesis of past temperature reconstruction is not that all trees are valid temperature proxies; it is that some trees are valid temperature proxies. Why should they include trees that are not temperature proxies in temperature reconstructions. That’s absurd.
Please. Do you think there could be a difference between mining and finding proxies that match the calibration period?
I’m amazed you guys can’t grasp the concept.
Boris, why don’t you answer Rafa.
#241 Hans Erren:
Thanks for the graph. Do you think you could tighten the vertical scale and add a trailing 5-year trend? It’s hard to discern a trend over the yearly variation.
Re: #243
Boris, I understand what it is that makes you want to differentiate the reasoning being applied here, but I think you are continuing to miss the bigger issue, i. e. out-of-sample testing. One can fit a model to the calibration temperatures if one is allowed sufficient latitude and is unfettered in cherry picking and overfitting and without an a prior rationale. Unfortunately, that type of modeling often has problems when tested out-of-sample (because it was overfit) and that is what Steve M has in mind in doing this work and what it is that the dendroclimatologists get criticize for not doing.
It is a rather simple concept that keeps many investors from using schemes that were overfit using past market performances without out-of-sample results. And to be wary does not require a sophisticated statistical analysis.
re #243:
Boris, would you view the results differently based on these descriptions?
1) All selected trees show good correlation in the calibration period.
2) Of 200 trees, 20 show good correlation in the calibration period.
Each can be a description of the same starting data set, but the first is highly misleading, don’t you think?
MPaul says:
October 15th, 2007 at 9:43 am
I’m fed up of reading stuff like this on here. You are way off base if you think scientists are blissfully unaware of concepts like determining the number of significant figures within the data set.
Boris says:
October 15th, 2007 at 4:35 pm
I just want to make sure I understand what you are saying here, Boris. There is clearly a historical temperature record available that only goes back to a certain point in time when measurements started to be made. Trees are being selected which show a good match between growth rates and those historical temperature records and are then used as temperature proxies for the preceding centuries for which there is currently no data available. Trees with growth rates that can be shown to be primarily associated with other factors like precipitation over the calibration period in which there is recorded climate data are being ignored in temperature reconstruction terms. If that is what you are saying then I agree that comparing it directly to mining sample cores is a strange analogy.
Boris,
What you are claiming is that one tree can be a temperature proxy, but the one next to it isn’t. How do we know, because for a couple of years out of hundreds and hundreds, the tree rings match the temperature record. The question that you fail to answer is, why is the one tree a good proxy, and all of the others aren’t.
Until you can come up with a valid answer for accepting one and refusing the others, then you have nothing. And just declaring that the one is good because it gives you the answer that you were looking for is not a valid scientific argument.
More specifically, if only a couple of trees manage to follow the temperature record, what is your evidence that the tree in question is a temperature proxy over it’s entire life. We already know that most of the trees aren’t good temperature proxies. What is your argument that the couple of square meters on which this tree is sitting, has managed to have exactly the right conditions to make that tree a temperature proxy for a period of hundreds of years?
If you can’t come up with a solid argument for why this is the case, then you are merely taking the data that matches your theory and discarding all of the data that doesn’t. Which is the dictionary definition of cherry picking.
I guess we can’t really start calling this all “McIntyre et al. 2007” until it’s been peer reviewed, right? 😀
As far as proxies, if it can be shown that the trees are excluded because they have specific issues that make them not good proxies, that’s one thing. Simply excluding them because the data is inconveniet is another. The question in that case becomes “Why were they excluded?” Just dropping them and not expaining it is not acceptable, and I think that’s Steve’s point in comparing it to mining results. Obviously, if you decide to drill a hole on the beach looking for a vein of silver 50 feet down, you wouldn’t report it. Effectivly, grabbing samples from trees, and then finding out you have the incorrect tree is somewhat like that. So the question is, what’s being excluded and why? If you can’t answer that, then there might be an issue.
Come on.
Didn’t Nifong get into trouble for discarding all of the data that didn’t support the theory he was trying to prove?
Well, maybe it’s not obvious, you might have to justify why exactly you are drilling for silver on a beach, but I hope you get the idea. Not one of my best analogies I suppose.
Oh, by the way, Steve, who gets to own the copyright on this tree ring data?
Boris, allow me the luxury of enlightening you with an analogy.
I have 1000 coins. I want to find the coin that best predicts the weather. Heads means tomorrow will be warmer than today, tails means cooler.
Every day I toss my 1000 coins and write down their predictions. In a month’s time I go back and look at the results, and sure enough some coins turn out to be better weather predictors than others. I pick the best coin of all. I toss it and it comes up heads.
Do you think there’s a better than 50/50 chance that tomorrow will be warmer than today?
252 Actually, it wasn’t throwing it away, it was failing to reveal it. Which is also going on here. That’s a good way to look at it; hiding exculpatory evidence. As in “censored”.
254, Shhhhh!
An invalid analogy, Jonathon Baxter, given that under the right circumstances tree growth is known to be related to temperature, while coin flips are obviously purely random. The technique of dendroclimatology can be a valid one. The ethical problem it seems to me is not that data, which do not show a correlation with temperature in the decades and in some instances maybe even centuries long calibration period, are discarded. That is a core part of the whole procedure in collecting valid data sets. The ethical problem is when valid temperature proxies in terms of the calibration period are discarded because they do not exhibit the desired hockey stick profile. That is when a direct analogy with illegally discarded mining cores would actually be valid in my opinion.
John M, how do you distinguish trees whose growth correlates with temperature from those that just got lucky and happened to match the temperature record?
258, the problem isn’t whether or not temperature affects growth, but how many other things affect it more. Under most circumstances, there will be unaccountable noise drowning out any temperature signal. In effect, it’s a random number generator, or a coin toss. You have to prove that this isn’t the case. And if you haven’t, you have to assume that it is. And if it is, the coin toss analogy is a perfect analogy, and it’s just as illegitimated to toss out inconvenient truths as it is to toss out coins tosses that didn’t predict last month’s weather.
JB’s analogy has to be presumed valid until proven otherwise. Have at it. And when I say “proof”, I mean “proof”.
There’s also a problem with correlated inputs as well as non-linearities. CO2 is plant food and let’s not forget that CO2 is correlated with temperature not only by hypothesis but fact as well.
Mark
RE 255. some folks believe in treemometers.
If the trees calibrate well they are treemometers. AND ALWAYS HAVE BEEN.
If the trees dont calibrate well, they are not treemometers and NEVER HAVE BEEN.
( note the untestablity of these beliefs)
The fun question will be this: What happened to tree-mometers after 1980?
The trees ( previously sampled ) will fall into 1 of 4 classes.
1. Calibrated well in 1880-1980, calibrates well in 1980-2007
2. Calibrated well in 1880-1980, Doesnt calibrate well in 1980-2007.
3. Didnt calibrate in 1880-1980, calibrates well in 1980-2007
4. Didnt calibrate in 1880-1980, doesnt calibrate well in 1980-2007
Boris should explain what his position will be in each of these cases.
Thats the logic of the matter. You have a records of prior calibration.
You have records of new calibration. before the testing is done, boris,
what would you say if #2 happened? or #3.
It’s simple. Explain your logic in each of these 4 cases.
e4.c5.
Simple.
Cue Boris:
If a short calibration period of say 10 years were involved you would have a point. If calibration is over several decades and even into centuries then that ceases to be a concern statistically. You might be interested to know that when this is done the result reported is often not hockey stick.
http://www.eman-rese.ca/eman/reports/publications/Forest/part9.html
Larson and Kelly (1995) have discovered that the growth of cliff-face white cedar from the Niagara Escarpment is extremely temperature-dependant and can be used as a proxy mean summer temperature record for southern Ontario. A 2,791 year paleoclimate record has been established. This record indicates a general warming trend has occurred since about 1960 with the last decade being particularly warm. This followed a period of slightly cooler than normal temperatures of about the same duration. While unique to this century, and therefore reflected in the recorded climate record, this fluctuation easily falls within the observed prehistoric limits. A much more dramatic fluctuation occurred between about 1550 and 1600 and equably abrupt fluctuations occurred at the beginning of the chronology, about 600 BP. Therefore the recent trend towards warmer temperatures must be both longer and warmer before it is unique for Ontario.
236 jae:
Yes you are correct. What I meant in my text (not the clearest explanation) is that dendrochronology is a good way to locate major events that influence the growth of trees in the past. It can be anything from periodical pest attacks to volcanic activity, and draught.
My point is that the radial growth of trees is determined only by the short period of the year. In most cases temperatures from Jan-Apr and Aug-Dec do not have any influence on tree growth. In boreal forests the period that determine the growth can be only 2-4 weeks, as is the case in alpine forests. If the tree react only to this short period, how is it possible to reconstruct past annual temperatures. Does for example June temperatures and annual temperatures correlate? If they do, then it might be possible to use tree rings, if not then the results are only a statical oddity.
e4. c5.
Sicilian defense. An appropriate choice.
262, Actually, there’s another possibility (as alluded to by Jonathan Baxter). Trees work out to be treemometers during the calibration period just by chance, but weren’t treemometers prior. If that’s the case, they won’t be treemometers after the calibration period, either. Which is the whole point of this exercise. If you were dumb enough to think they were treemometers because they acted like treemometers during the calibration period, then you should have complete faith and confidence that they’ll act like treemometers after the calibration period. Non? What’s to object to?
Boris,
Perhaps I can help. You are making an assertion that tree ring properties can be measured that correlate to temperature. Now you take some cores from a group of trees and some match the instrumental and some don’t. Now you assert that you can use the ones that correlate to temperature for some research and discard the ones that don’t correlate, simply by asserting that the ones that correlate are sensitive to temperature and the ones that don’t correlate are not sensitive to temperature. Now my scientific training would set off a flag that I need some proof other than the correlation or non-correlation in order to prove my assertions about sensitivity or non-sensitvity to temperature. If you cannot understand the problem that your assertions based only on correlation or lack of correlation cause to the rest of us than I think you need to take a formal course in logic and the scientific method.
Even geology students who eventually go on to do exploratory mining cores tend to accept David Hume’s theory of the uniformity of nature, Larry.
John M, I don’t know how you calibrate over centuries. We didn’t have thermometers back then. And to use SM’s terminology, unless you have a mechanism explaining why a particular tree is a good treemometer today, how do you know it was a good treemometer 500 years ago? Conditions could have been very different. You have to rule out all confounding variables.
Whether a treemometer is a statistical fluke or not depends on how many you look at, how long the sampling period is, and how much correlation you want. If you throw away 1000 trees for each one you keep, that’s a problem.
#266: That’s exactly why this exercise is so interesting. If the treemometers are largely the result of sampling bias, we should see a sharp drop in their 1980-present temperature correlation compared with their 1880-1980 performance. Conversely, if the correlations hold up then it is quite unlikely they are just flukes (although the caveat still holds that it is not clear how far back you can extrapolate unless you have some way of determining what makes a treemometer).
Gabriel Fahrenheit invented the mercury thermometer as far back as 1724, Jonathon.
249,
I think you’ve said it better than I have.
246,
The key then would be the calibration process. Could be they have no a priori criteria, but after reading many of Rob Wilson’s posts here I seriously doubt that.
If you’re doing a cross-validation, what are you validating–the calibration or the reconstruction? If it’s the calibration, you need to follow the criteria set forth in the literature (Wilson says it’s there. I don’t know, haven’t read it). If it’s the reconstruction, then you still need to follow the criteria because you need to select proxies the same way the original study did. Selecting random trees doesn’t tell anything about either the reconstruction or the calibration.
242 (This one’s a request from Larry in San Ber’dino):
The “file drawer problem” doesn’t apply here as long as the dendroclimatologists have set logical criteria for determining if proxies calibrate to the temperature record and they follow those criteria consistently.
RE 268. Humes uniformatity of nature has nothing to do with Treemometers. A treemometer is “selected” because
it currently appears to be in a stressed region.. a region ( treeline for example) where
its reponse to the enviroment is expected to be modulated by a climate variables ( like temp) rather
than other variables like soil and precip, and shading, and lots of stuff.
During the past 100 years or so the treemometer may be a good proxy. That is, we could test whether it
calibrates to the instrument record or not. Beyond the past of 1880 is unknown. This is not like carbon
14 dating. This is based on the assumption that for 100s of years the tree was situated in such a configuration
that it recorded temp signals. ALL THE WHILE a tree of the same species 10 feet away did not record this
signal.
SETI should hire these kick ass pines! I should fly one in my jet aircraft.
Simply. Tree ring proxy studies are Untestable and not justified by a uniformitity of nature supposition.
They rely on a uniformity of this “mountain meadow” didnt change.
How about the uniformity of conditions on cliff faces on the Niagara Escarpment in the work that I quoted above, steven? Worth noting that the results obtained in that context do not fit Mann’s hockey stick.
Ok John M. I am just going on temp records which are only ever quoted back to 1880.
There’s probably no need to argue about this. John M, Boris, and their supporters just need to answer a straightforward question: what will you conclude if many of the existing treemometers show substantially reduced temperature correlation in the more recent cores?
re 265. Najdorf if they gave it to me. The themes were always clear to me.
on d4 I tried the dutch for a year, but could never quite grasp the stratigic dimension.
At one point I think I played for 3 years online without ever playing white. By choice.
Back to the problem of rigidly polarized debate again with #275 I see. I don’t believe Mann’s hockey stick analysis and I suspect Steve McIntyre’s results are going to be very awkward for people that do. Read my responses #258 and #263 again and you may be able to understand where I am coming from.
Actually, I was trying to depolarize. The point of my question is that we don’t need to argue about how treemometers are determined. Maybe the methods are valid, maybe not. But I can’t imagine anyone arguing the methods are valid if the treemometers don’t work after the calibration period.
Well, you’d have to conclude that those particular proxies:
a) might not be good temp proxies at all
b) might have ceased to be temp proxies for some unknown reason.
c) might not be able to register warmth warmer than the current temps.
Unless you could find the reason for b and show it could not have affected the proxy in the past (some local source of pollution for example) then you would need to lower you confidence in that proxy, if not toss it altogether. I found this old Wilson post on the divergence problem:
CAn other people access the U of Arizona tree ring lab website at http://www.ltrr.arizona.edu? I’ve been blocked from Team websites before (Mann, Rutherford). I guess it wouldn’t be be impossible that Hughes has blocked from this website, but perhaps it is down for some reason.
#280 Steve…I was able to see the page.
#281. I guess that realclimate or Mann or Hansen sent them my IP address. It’s impossible to over-estimate the pettiness of the Team. What jerks. Remember when Mann tracked down the IP address of the employer of a guy who wrote a critical comment. I wonder who does this over there – I wonder if Mann or SChmidt do this themselves or whether there are people at Environmental Media Services who do it for them or whether they turn the data over to computer guys to do it for them.
RE 274. I dont know. is that fair?
RE 282.try the anonymizer. http://www.anonymizer.com/
there are other tools as well.
#284. Yeah, I got on after using anonymizer. I wonder how they got my IP address.
re 275. My Sense, as a practicing pragmatic, is that if SteveMC results indicate something
amiss with the BCPs, people will ALWAYS be able to construct epicycles of denial and obsfucation.
Note how Boris ignores the Four Lines I present to him. Four simple lines of chess.
Expect this. If the St.Mac treemometers upset the conventional wisdom about about the MWP. Then
the MWP won’t matter anymore, and will never have mattered. And they will point to the melting ice
and the migrating butterflies, and Katrina, and….
AJ Ayers once asked theists an interesting question. What would have to happen for you to give up
your belief in God?
While not a logical positivist I think the question has some merit, no matter what the subject
of the question.
#279. Current treemometers are the result of some supposedly kosher procedure. If we find them to be invalid, won’t that call into question whatever method the dendroclimatologists are using to determine the treemometers?
Not necessarily. The flaw in procedure may be unique to one particular study with bristlecone pines.
I can get to the site. (Not that posting here gets me an error about how I have been spamming, and the “fix it yourself” times out… http://www.ioerror.us/bb2-support-key?key=4670-cdef-dfd9-b1ad or anything) But at least I can connect! 🙂
How does one find out an IP? It’s pretty easy, should you know what you’re looking for, to find out just about anything online, including what IP address somebody has. On Deltoid, I remember a post about… Okay, it’s http://scienceblogs.com/deltoid/2007/10/watch_monckton_squirm.php
“On June 6, someone with IP address 81.77.248.148 added this passage to Christopher Monckton’s wikipedia page (emphasis mine):”
(The problem is that the DSL provider (Energis UK) seems to have the entire 81.76.0.0 to 81.77.255.255 network of about 130 K addresses. Depending on how they have it set up, the lowest number of people on that link is 126, which would be 81.77.248.0 to 81.77.248.127 (or 128 to 255) I’m not aware of the frequency of getting a new IP from Energis on your DSL, but it could be every time you sign up.) While I’d imagine that the odds of somebody in the same 126+ users getting an IP similar to Viscount Monckton of Brenchley’s one, the issue is hardly clear-cut. I don’t know if this is the same kind of thing as the supposed case of John Lott using a sock-puppet, I’m not going to pre-suppose anyone’s “Secret Agenda” on anything. Heck, maybe somebody in the neighborhood decided to go down to the local Internet cafe and doing a little wiki editing.
On the other hand, it is also possible to spoof somebody’s IP address. Not that I distrust anyone at the University of South Wales one way or the other, or would ever attribute ulterior motives to anyone in the lack of any type of proof. Perhaps we can just chalk it up to a generic misunderstanding about the principal components and how much a proxy meets expections (or gets thrown out as not being robust).
But I can say one thing. By these things you shall know them. Or actions speak louder than words. Or what’s good for the goose is what’s good for the gander. Or a bird in the hand is worth two in the tree. Or if you work for me and don’t give me the answers I’m asking, you will be in trouble, assuming I don’t fire you because you’re more work than you’re worth.
Or what Tom Cruise said in Risky Business. Sometimes you just gotta say “But hey, it’s climate science.”
#244, Dear Larry, the curious thing is I learned about the “file drawer problem” through
a NASA guy. He severely critizes some researchers attitude, when statistical significance
is the key for publishing the results. He states that
“Statistical combination can be trusted only if it
is known with certainty that all studies that have been carried out are included.
Such certainty is virtually impossible to achieve in literature surveys”
I think this is one of the problems more often mentioned within climate science skeptics. The other one is
“where is a refereed paper fully explaining the physics supporting the tuning of this computer model?”
The paper I talked about is
Click to access 14.1_scargle.pdf
It is several years old
best
Re Boris’ argument, it doesn’t seem to have been pointed out that the favoured BCP ring widths don’t correlate with local temperatures, they correlate with global temperatures in the calibration period.
Somehow the BCPs ignore their local environment, and teleconnect to the global environment.
JohnM,
How long is long enough? For most of these places, we have very little data on what the temperatures are, now, or in the past. The best we can do is find a spot, sometimes hundreds of miles away, with temperature records of varying length and varying quality, and infer from there.
JohnM,
Uniformity of nature does not imply that climate conditions never change. It only states that processes don’t. You are assuming that because a particular tree appears to be temperature limited over the last couple of years, that the particular spot of ground that you are standing on has always been temperature limited.
That is an assumption that cannot be defended.
#280/#284/#285: Steve, consider using Tor:
http://tor.eff.org/
http://vidalia-project.net/
I answered the important one, but here goes:
Seems like its a very good proxy.
See #279
I don’t know if the 1980-2007 is long enough for calibration. Assuming it is, you would have no confidence that that proxy could register temps cooler than 1980-2007.
Not a proxy. Who cares?
re 280
I have faced similar obstacles with blocked sites in my job and Google cache comes in very handy for this. Even if pages are deleted, the Google cache is still there.
MarkW says:
October 16th, 2007 at 5:19 am
The processes that affect the cliff face remain the same and the calibration period would have been much longer than a couple of years given that the Niagara Escarpment is close to Toronto and accurate temperature measurements have been made there for well over a century.
JohnM,
The physical processes never change. However climate does, constantly. Close to Toronto is not good enough. If you don’t have a probe inside the grove in question, then you really don’t know what the temperature in the grove was. If you don’t know what the temperature in the grove was, there is no way you can claim that the trees in that grove are good temperature proxies.
You are claiming that the trees in question are temperature limited. How do you know? How do you know that the precise combination of environmental conditions that may or may not make the trees temperature limited today, have always been present?
You are the one making the claim, defend it.
Given the work done by Anthony Watt’s, I’d also like to see you defend the claim that the temperature records maintained in Toronto are accurate for the last century.
#298. I’ve spent quite a bit of time reading about cedars – because the Gaspe proxy used cedars ; and spent a day with Larson and Kelly in 2004. A couple of point stick in my mind: they said that cedars like cool, moist summers and these are what cause the most growth/thickest ring widths. They are a classic upside-down U temperature response. They also said that growth spurts for individual trees in harsh cliff environments were primarily related to them finding a pocket of nutrients.
#299. please discuss temperature record
It may not be good enough for you Mark W. but I suspect most people with a university education would see a 100+ year calibration period as being a solid enough basis for using the trees in question as a proxy given the fact that the physical processes affecting the cliff face have not changed over the centuries based on Hume’s uniformity of nature principle. Steve McIntyre has been quite complimentary about the people who did this research in the past as far as I remember. Given they are based at Guelph university and the dendro lab mentioned in the blog entry is at Guelph well I’m sure most people can figure out the rest. 🙂
RE 295 and 279:
#2.a) might not be good temp proxies at all
b) might have ceased to be temp proxies for some unknown reason.
c) might not be able to register warmth warmer than the current temps.
You need to add
d>) temperature record post 1980 might be wrong.
It’s simple logic. If treemometers have been good proxies and they appear to lose track
against the “instrument” record, perhaps the instrument record is flawed.
on #3. 1980-2007 being too short a record? yes, the probablity of a random correlation
is higher.
Very good boris we agree. The only issue that remains is the proper ducmentation of
all trees sampled and why some are selected and other’s deselected.. And what this does to one’s confidence
deselection
Physical processes don’t govern tree growth. Unless you mean do trees still convert sunlight and CO2 into carbohydrates and sugar.
What governs tree growth is the sum total of the climate during the growing season. Which isn’t even the entirety of the year, just a small portion of it.
As to not being good enough. Please be good enough to actually read what I wrote, not your cartoonish attempts to redirect what I wrote.
I stated that even if we accurately knew what the temperature in Toronto was, that was not evidence of what the temperature in the tree grove was.
I notice that for at least the third time, you are evading the central question.
Steve, someone who knows more about this than I (Anthony?) could fill in the details, but it should be possible for you to use a proxy server to get around IP blocking. Then if and when they block the proxy server, you move on to another one.
I believe one important factor is that a tree, like any other being, constantly tries to gain an advantage over the plants surrounding it – a never ending struggle for light, moisture and nutrients. Especially in mountainous environments, any tree should potentially be in a better position the older it becomes and the higher it gets due to up to hours of additional sunlight every day (less shade from slopes and other trees) and additional moisture and nutrients from other trees that have lost the battle. Since paleoclimatology naturally looks at the “winners”, a certain bias towards rising growthrates should be detectable – even if all environmental influences where stable.
#257, I heard it :). Answer: The person who wrote it down. I would recommend that they place it into the public domain. Of course, then anyone can publish the paper and get the credit.
#259 >> The ethical problem is when … do not exhibit the desired hockey stick profile
That’s only true if one assumes that tree rings are a valid temp proxy. Please see #223, 172, 129, 65 and this one on the other thread: http://www.climateaudit.org/?p=2189#comment-148523
#263 >> Larson and Kelly (1995) have discovered that the growth of cliff-face white cedar from the Niagara Escarpment is extremely temperature-dependant
I assume that they determined this by matching recent temps. However, all other factors that affect tree growth could have been reasonably constant during this time period.
#266>> theres another possibility (as alluded to by Jonathan Baxter) … just by chance
I said that in #223
#267 >> I need some proof other than the correlation or non-correlation in order to prove my assertions about sensitivity or non-sensitvity to temperature
Right. It’s now starting to seem like the approach stated by Boris is a microcosm of the whole AGW assertion. Does one conclude scientific relationship based on correlation alone (wet sidewalks cause rain), or does one establish a scientific relationship and use logic/SM to seek the truth, using correlations only to provide hints as to where to look.
#291 >> Somehow the BCPs ignore their local environment, and teleconnect to the global environment.
What if they are really correlating to local C02, which is not affected by local conditions, but global temperatures (ocean absorbing/outgassing)?
Boris, #re 243 “The hypothesis of past temperature reconstruction is not that all trees are valid temperature proxies; it is that some trees are valid temperature proxies. Why should they include trees that are not temperature proxies in temperature reconstructions. Thats absurd.”
No, what is absurd is that the hypothesis that you state has not been tested experimentally.
I’ll give you the same starter as I do my project students “First state your null hypothesis”
In this case “there are no trees that are valid temperature proxies”. Then you go about designing an experiment to falsify this hypothesis. As far as I know no-one has attempted this.
#248,
John M.,
No need to be fed up. My questions are simple ones. I’d like to know exactly how one measures the width of a tree ring to a resolution that is ~1/100 the size of a plant cell. And I’d like to know under what theory can one assert that the width of the ring is uniform to within 1/100 the size of a single cell around the entire circumference.
In fact lets generalize, maybe someone could describe for me a process for depositing a thin film of 0.1mm particles onto a substrate so as to achieve a surface uniformity of +/-0.001mm across the entire surface.
307, What Boris and John M seem to be arguing is that one tree that shows temperature sensitivity falsifies the null hypothesis. They don’t seem to understand that there are possible explainations other than actual temperature sensitivity.
Larry; As part of my other post said “They simply refuse to acknowledge that there are several valid yet independent approaches to solving the problem.”
MarkW;
“If you dont have a probe inside the grove in question, then you really dont know what the temperature in the grove was.” I contend that there is no such thing as “the temperature of x” when you’re talking about a large area outside. There’s only the temperature of the air around the sensor. 10 feet North, 20 feet South, 15 feet up. All you’re getting is an average of the general vicinity at the time of measurement.
In the case of trees, not only do you have something that is alive and therefore variable in the first place (air composition, amount and timing of sunlight, amount and timing of water, type of tree and acceptable temperature range etc) but it also has height and so has different temperatures affecting it depending on how high the tree is itself, not just the environment. How does it react at 1 foot where it’s wider versus 30 feet where it’s more narrow?
310, Sam, that’s true, but assuming a foundational postulate like that that’s simply wrong isn’t an alternative valid explanation, it’s an invalid explanation. You simply can’t assume that if a minority of samples shows a correlation, that the correlation has anything to do with causation. It’s the monkeys at the typewriters problem.
Here’s a good example of why we can’t just assume that correlation means causation:
Is that just the random flickering of the flames, or John Paul II?
Larry, I agree with you, except I would say that even if a majority of samples, no samples or all samples shows some correlation, it may or may not have anything to do with causation. I like the idea of what Don said; First state the null hypothesis and try and falsify it. I wasn’t making any other statement than to agree that temperature sensitivity isn’t the only possible explanation (or in fact, even an explanation that’s valid at all).
Now, thinking about it, what does a sample of each of these trees 5 feet off the ground tell us?
A tree of type X is on a mountain at 11,000 feet surrounded by other trees of type X and Y and Z. There are 10 trees within 10 feet of the tree. The tree is 40 feet high. At the base an inch off the ground, it has a diameter of 4 feet, tapering to a diameter of 1/24th of a foot an inch from the top. The soil is fairly rocky and the location is sloped. It rains 1/2 the year. It’s very sunny 1/2 the year. Most of the top half of the tree gets a lot of wind. It’s fairly humid in the location. The winters get down to freezing and the summers get up to 100.
Another tree of type X is on a mountain at 2,000 feet and has no other trees within 20 feet. It’s 20 feet high. At the base an inch up, 2 feet diameter, 1/12 a foot an inch from the top. The soil is more sandy and flat. It rains 1/10 the year. It’s very sunny 3/4 the year. There is little wind, and it’s pretty dry in the location. Winters don’t go under 20 and summers get to 80.
Hey Boris, that picture looks like JPII, so we can throw the other video frames that don’t away, right?
RE: #264 – Is the environment where BCPs grow an alpine forest? I don’t think so. It is a highly unique biome, virtually unknown outside of the Americas plus a few odd places in Australasia.
Without a paramaterized physical model of tree growth, I can’t see using treemometers as anything
other than an whimsical illustration of the difference between causation and correlation.
Perhaps somewhere there is an ancient sacred Bristlecone pine that teleconnects with the climate
of the whole planet. And we can dance around this oracle of sorts and trust that it is as accurate
as the digital thermometers of today.
Think about this. In the US every day, NOAA collect data from over 1000 stations, using a combination
of instruments. Most of which are good to within .1C. The data from these sensors is then rounded UP
or DOWN to the nearest degree. Over the past century we have seen a increase of .6C to .8C.
SO, with a network of 1000s of stations utilizing sensors that are good to .1C we have a warming of
about .6C.
Now calibrate wood growth to THAT. One of two things is TRUE.
1. Wood growth measures temp with less noise than Liquid in glass or digital sensors OR.
2. Wood growth fits actual temperatures like a burlap bag fits paris hilton.
If #1 is true then NOAA should use trees to measure annual temps. treemometers ROCK.
If treemometers are less reliable then what is the point of trying to reconstruct the past
with them AND compare the results to modern instruments?
The point is supposed to be that you calibrate your treemometer against your thermometer, because the treemometer goes back further. But that does kinda blow Mann’s assertion that treemometers are good to +/- 0.1C out of the water, doesn’t it (yes, he did say that).
Hey cool! I didn’t know flames could be used as papal proxies. #312 proves it, according to the newly founded “Boris” method 🙂 Perhaps we should use Pontifical Component Analysis to derive a canonical reconstruction with that fire?
Re #308:
We’re not talking about surface smoothness here, but average surface height over an area – if the area is large enough, then yes, it would be possible to define the average surface height to an accuracy of 0.001mm. E.g. if your surface consists of 100 0.1mm particles (10×10, 1mmx1mm) and you take one particle away, your average height over that area has dropped by 0.001mm.
I suspect this is standard dendrochronology stuff, and dendrochronology is pretty well understood and proven. It is the relationship to temperature that is suspect.
Just for your info putting words in somebody’s mouth and then answering that rather than what they actually wrote like you just did above is a very old debating trick and it is usually a sign that somebody is losing a debate when that approach is adopted. Do you really seriously think that these studies are based on one tree? Read the blog entry again. 🙂
…..our project collected 64 cores from 45 different trees at 5 different locations on Mount Almagre. 17 Graybill trees were identified, of which 9 were re-sampled. All the cores are currently at a dendrochronological laboratory,….
The trick is to find an environment like the cliff face of the Niagara Escarpment in which tree growth is strongly temperature dependent and to study multiple trees within that environment. It isn’t about finding a single tree and declaring that to be a “treeometer”.
Steve: IF the Niagara escarpment is “strongly temperature dependent” – which is not the case – then there is no HS. Please do not accept someone’s assertion of temperature dependence as proof.
I don’t believe in the HS for reasons I have outlined previously. Is everything so rigidly polarized into friend or foe on here that you have you failed to grasp that from what I have written above?
Steve merely pointed out that the Niagara Escarpment is not strongly temperature dependent… no need to get ruffled feathers by treating his response in the same manner you accused him of in the first place.
Mark
I’m sorry guys but this whole discussion sounds like two parties reading from diferent languages and cultures and not understanding a word being said.
I was a physicist, uni educated as someone said, and I do understand a little bit about physics and stat/probs but more than any of that, I know about rigor of measurement, experimental practice, data management etc. even to making statements for which you have no rigorous proof. So when taking measurements of any parameter the result applies only to the EXACT place, time, method, instruments, calibration techniques, etc used. Reproducibilty comes from knowing exactly the conditions under which the measurement(s) were taken.
I shake uncontrollable when I see climatologist/meteorologists quoting temperatures to 1/1000 of a degree. No-one, IN MY OPINION, has the right to measure a parameter to 1/10 of a degree and quote an average to 1/1000, sheshh, especially when the environment in which you are taking the measurements changes, virtually, by the second. My old uni lecturer will be turning in his grave.
The stand-alone Stevenson has a reasonable chance of being fairly accurate and usuable ONLY if it is always maintained to a RIGOROUS standard.
Boy did I loose it there
322, you just said what I was thinking. It wasn’t that long ago when high-end electronic temperature logging systems would be performing EXTREMELY well if they could read to within 0.1C, and maintain that calibration for any extended period of time. It’s still far from guaranteed that they can do that without significant drift. And we’re expected to believe that treemometers can do that well without periodic calibrations?
Put another way, any instrument lab who tried to get away with calibrating their temperature instruments the way the dendorthermometrists do would be laughed out of business.
RE 322.
You should be informed that the Law of Large numbers will increase the accuracy
of the global temperature to near perfection.
I think we should find the Sacred Bristlecone Pine. The one that calibrates the best.
And then sample it a thousand times and increase our accuracy thereby.
If you stand on the same scale long enough or enough times eventually the scale will become
omnscient and know everything without error.
Ok so I lost it; so we should not forget that you do not need super accuracy to get a trend but you do need consistency and if that trend is miniscule, the consistency needs to be finely tuned 🙂 he he
Like it Steven
Hmm…Maybe Bela Liptak needs to add the treemometer to the “instrument engineer’s handbook”. I didn’t see it in there between the bimetal and the thermocouple.
Stephen Richards (#322) says,
I don’t think anyone is really quoting temperatures to 1/1000 of a degree, but in principle, if you had 10,000 stations independently measuring a parameter to 1/10 degree, the measurement error on the average really would be reduced to 1/1000 degree. Of course, if many of the stations were sitting on pavement or over A/C compressors, they wouldn’t really be measuring the desired parameter to 1/10 degree in the first place. Or if, as Steve Mosher quips in #324, the same “treemometer” was cored 10,000 times, the errors would not be independent and would not average out.
Ironically, even though the post-1980s MMTS temperature sensor measures daily high and low to 0.1 deg. F, NOAA instructions to observers tell them to round the answers to the nearest degree (rounding .5 always up), thereby gratuitiously discarding available precision.
Hu to see temperatures averag to 1/1000 go here
http://www.cru.uea.ac.uk/cru/data/temperature/hadsst2gl.txt
I know they are anomalies but to 1:1000 never the less.
Let me just confirm what you are saying. If I want to measure a parameter to 1:1000000th of a unit all I need is 10,000,000 measuring devices measuring to an integer? Is that right?
327, 328, the theory behind that is that you have a perfectly accurate base signal with white noise superimposed. Real instruments don’t work that way. You can’t even assume that about a box of 1000 mercury thermometers. If that were the case, you could manufacture the thermometers without any quality control whatsoever, and average the readings of 1,000,000 to get an accurate number. In the real world, the accuracy of the instrument does matter.
Hu, you say:
Absolutely not. While this is true in principle for a large number of repeated measurements of a single unvarying parameter measured at a single place by a single instrument, it is absolutely not true for a large number of unrepeated measurements of a single varying parameter measured at multiple places by multiple instruments.
w.
re 330. thank you willis.
RE 325. Just listen to willis.
That’s called oversampling, and you can, indeed, get more significant digits out of an A/D converter that way. Try to do that with 16 different A/D converters on 64 thermistors, and you get gobbledygook.
An excellent start Willis. The Law of Large Numbers refers to refinement of the mean value of the estimates. And it works only under the conditions Willis stated. One example usually used to illustrate the LNN is the case of tossing a fair coin; a case with a known expected value.
What the LNN does not and cannot do is assure improvement in the value of the estimates relative to the true value of the property being measured. The estimates of the true value are controlled by the experimental setup (micro climate), the accuracy of the instrumentation( MIN/MAX vs. MMTS vs. others), recording of the data (human errors), processing of the data following its recording (rounding, coding errors), among many other issues. All these are unrelated to and in no way can be improved by the LNN. Tamino got this LNN thing off to a very bad start, IMHO.
All corrections appreciated.
RE 334. I almost had this LLN argument with JohnV. I say almost had this argument because he was
coherent and I ran around with my pants around my ankles. But Willis put my thoughts down
perfectly. I should let him speak for me more often.
Mark T says:
October 16th, 2007 at 8:34 pm
Steve appears to me to be playing a game with semantics on that, Mark T. 🙂 Here’s an old entry in which he mentions the research in question:-
http://www.climateaudit.org/?p=397
Upside-Down Quadratic Proxy Response
By Steve McIntyre
David Stockwell has suggested a discussion of nonlinear responses of tree growth to temperature. Ive summarized here some observations which Ive seen about bristlecones, limber pine, cedars and spruce – all showing an upside-down U-shaped response to temperature. The implications of this type of relationship for the multiproxy project of attempting to reconstruct past temperatures by assuming linear relationships between ring widths and temperature are obvious.
Also, if you check this thread you will find I was actually responding to Larry and not Steve. Posing a question seeking clarification of something is not the debating trick I described.
Star brightness is not air temperature.
Stephen R. wrote (#328),
No — the precision of the average increases with the inverse square of the number of observations, assuming the observation errors are all uncorrelated. Thus if each measuring device has a measurement error of one unit and these errors are all uncorrelated, it would take 10^12 = (10^6)^2 devices to get the error in the average down to 10^-6.
Of course, if they are all measuring the same number, say 60.4 deg. F, and all rounding to the nearest integer, they will all be off by -.4 deg, and so not uncorrelated. But if they are all measuring their own local temperature (which varies by several degrees across stations and is not exactly the same for any two), and what is desired is the average of the true temperatures across all stations, the average of the measurements at 10,000 stations will be accurate to about .01 degree.
(In fact, since the standard error of a Uniform(-.5,.5) random variable is sqrt(1/12) = 0.29, the average will essentially Gaussian with a standard error of .29/100 = .0029.)
Of course, all this assumes that rounding is the only source of error — if all the thermometers from this batch measure high by 0.37 degrees, that cannot be corrected by multiple measurements.
While admittedly .001 degree is probably a meaningless level of precision for the numbers you cite, it is generally better to carry too much precision than too little. Back in the Middle Ages (i.e. 20th century), when temperature data had to be recorded on 80-column punched cards, there perhaps wasn’t enough room to carry tenths of a degree, even if the equipment was up to this. But with today’s memory devices, there is no point in rounding archived data if you don’t have to.
Willis @ #330 writes re my #327,
Yes and No. As I indicate in #338, if they are all measuring the same value subject to the same rounding error, then the LLN wouldn’t help. But if they were all measuring different values subject to locally unique rounding errors, and what was desired was an estimate of the average of the true values, the rounding errors would offset a la LLN.
So, my question is, were some or all of these bad samples?
Come on, you can estimate a bunch of stars and LLN will work out, how much do stars change? How do you do that with a continually variable temperature that works in cycles, with instruments of unknown calibration, that are rounded? Everything could be off +/- .5 I would think. Am I just not understanding why this is meaningful (even if the number itself has any meaning down to tenths of a degree over 120 years) to .1 degree accuracy? Why does the LLN even apply in this case, the average of tmin and tmax with TOBS?
Maybe I’m just stupid.
It seems to me everyone needs to understand the difference between the Law of Large Numbers and the Central Limit Theorem.
Wikipedia’s treatments of both are good:
http://en.wikipedia.org/wiki/Law_of_large_numbers
In a nutshell, the LLN states the average of a sequence of observations eventually converges to the population average. So, toss a fair coin 1000 times and the proportion of tails will be close to 0.5.
If the temperature at a specific location is stable (i.e. constant expected value, finite and constant variance, independent random errors) and you observe the temperature at that location on July 27th every year for a hundred years, the average temperature will be close to the true average temperature for July 27th at that location.
http://en.wikipedia.org/wiki/Central_limit_theorem
The Central Limit Theorem is a statement about the distribution of sample averages. It states that the probability of obtaining sample averages that are far away from the true population average decreases as the sample size increases.
To be able to apply the CLT in the sense of 338 above, one needs to have independent signal sources.
In any case, in these discussions about climate, I can never figure out what is supposed to be the population and what is supposed to be a sample and what distribution are temperature measurements supposed to be coming from.
All temperature data we (humans) possess is historical, not the outcome of a standard randomized sampling scheme. Humans have chosen where and how to measure temperature throughout history due to reasons beyond our control. For example, people like to live in temperate climates. People live where they can travel to (and from). And, people like to know the temperature where they live rather than where they don’t.
Given this, I have great difficulty accepting that statistical methods based on iid assumptions can be applied to the analysis of historical temperatures.
Now, if HADSST data are the result of a bunch of averaging and the figures will be used as inputs in further analysis, I see no problem storing a few extra digits to increase the accuracy of those intermediate calculations.
Sinan
please correct me if i am wrong, but storing extra digits does not improve accuracy.
truncating significant digits and reduce accuracy.
and = can
Re: 343
If the numbers are intermediate results to be used in other calculations, throwing out digits is not good.
Sinan
Sinan Unur writes in #342,
I have no real argument with Sinan, but in fact it is the LLN that states that the plim of the sample average is the population mean when drawing iid from any finite-mean distribution.
The classical CLT goes one step further and specifies that the distribution of the sample mean, after multiplying by sqrt(n), is in fact Gaussian when drawing iid from any finite-variance distribution.
Thus it not only says that the probability of a large deviation from the population mean becomes small, it actually tells you what that probability is. Since rounding error is bounded (and ordinarily uniformly distributed) it has finite variance, and therefore is in the Gaussian domain of attraction.
Other noise, like lightning strikes, may have an infinite-variance power-tail distribution, and therefore by the Generalized CLT, lie in the domain of attraction of the Levy-Stable distributions. See John Nolan’s article at
http://en.wikipedia.org/wiki/Stable_distributions.
But as Sinan notes, the errors we are working with are often not independent. If, for example, someone were to systematically sample strip-bark BCPs instead of whole-bark, they might average out to a spurious Hockey-Stick.
Nice work Steve, I can’t afford to add to the tip jar, but I promise to ride my bike to work 10 times in the next year. Consider this a donation of carbon credits to cover your fossile fuel usage. Because these are informal credits, you don’t need to declare them as income. Enjoy the indulgence!
Hu, thank you for your clear explanation.
w
#342/#347 (Sinan/Hu): The classical iid-assumption is by no means necassary for CLT. See here for a nice recent paper on topic: http://arxiv.org/abs/math/0509682
I fail to see a large distinction between a) converging to a population average and b) the chances of being far away from the average getting lower.
Re: 350
Thank you Jean S. I have printed the paper and I am going to read it this weekend. My functional analysis and measure theory are a little rusty.
Re: 351
(a) is a statement about the average of a single sequence of observations as the sequence gets longer.
(b), as was originally stated, is a statement about the distribution of averages of all possible samples of a given size taken from a population.
CLT, in its simplest form, tells us that averages of all possible samples of a given finite size from a population with any distribution will be normal, centered at the population mean, having standard deviation equal to the population standard deviation divided by the square root of the sample size.
The CLT is useful because it allows one to calculate the conditional probability that a sample average might have been generated from a population with a hypothesized mean (i.e., the p-value of a test).
Sinan
That certainly changes the context… that it came immediately after Steve’s response was what I was going on. Apologies for the misconception.
Mark
I am looking forward to the “grass plot” of this exerecise. Would it be possible to show what you already have?
A reader at Tamino raised the question about proxies being updated once again:
GISS/realclimate apologist Eli Rabett/Josh Halpern re-iterated Mann’s excuse that it was too hard to update the proxies:
The heavy equipment is illustrate here:
Why do these people say such stupid things?
ignorance
Re #356:
Steve, I am sure that is a rhetorical question. However, I’ll bite anyway. The reason they say those things is that they surely know that the tree-ring record since 1980 doesn’t support their case, and they have to come up with a reason, however flakey, to justify not updating the proxies.
Impugning motive is a dangerous policy. Stick to the facts.
There appear to be two lines on this hockey team. The front line that says that updating the proxies is prohibitively expensive (Rabbett parrotting Mann) is not actually in the business of updating proxies. The back line – who is in that business – are the ones who knew that bcp growth post 1980 had dropped off, and they weren’t saying ANYTHING.
Whoa, bender’s back!
Mark
It isn’t the heavy equipment; the Starbucks is prohibitively expensive.
Members of the team have made the claim that gathering tree cores is expensive and time consuming. They have also made reference to how heavy and bulky the equipment for taking cores is.
A simple picture of a coring device is sufficient to disprove both these claims.
This leads one to conclude that the person making the claim either has absolutely no knowledge of how a tree is cored, or he is lying.
If he has absolutely no knowledge of how a tree is cored, then he is lying because he is presenting himself as an expert.
If the person is relying on someone else, then we repeat the above excercise for the someone else in question.
Somebody over there is lying.
Uhhh….. Steve…..the Team can’t be expected to break a sweat. This is what they have to use:
FWIW, Here’s a pretty good illustration of the hand tools:
I don’t know what happened. Here:
http://www.plantbio.ohiou.edu/dendro/field_methods.htm
362: Wow, they have really gotten hi-tech, since I was involved in coring. Still looks like a lot of work, though, lugging that monstrosity through the woods. What’s with all the PPE he’s wearing? Maybe he’s allergic to southern pine, LOL. No ear plugs, though.
You can’t tell in the picture if there’re earplugs, but it doesn’t surprise me that the operator is wearing a mask. That infernal combustion engine puts out CO2, you know.
Ahhhh, how cute. Forestry Suppliers sells a Junior Dendro F.I.E.L.D. Kit for just over $200.
http://www.forestry-suppliers.com/product_pages/View_Catalog_Page.asp?mi=6808
Even Rabett can join in the fun…
#367
No, they won’t like that kit. Its study guide states differential ring widths indicate “moisture availability”
Although I will argue below that Boris (e.g., #243) is making a flawed argument, I find all this piling-on and nasty rhetoric about Boris’ logical reasoning abilities both unseemly and counterproductive. Nothing is “repugnant” here.
Let me quote from #243, where Boris says: “The hypothesis of past temperature reconstruction is not that all trees are valid temperature proxies; it is that some trees are valid temperature proxies.” Well stated! It does seem natural, under those circumstances, to discard data from trees that do not correlate well with temperature records.
The issue is that if this is indeed the hypothesis, then we need to be ruthless in seeking evidence to disprove it. One test would be to take whatever criterion was used for identifying candidate “valid temperature proxy” trees using only temperature data from some particular period, and then seeing if those trees continue to correlate with temperature taken from a subsequent period. If they don’t, this is a “divergence problem.” Or stated another way, this is an “apparent falsification of the hypothesis that we were able to select valid temperature-proxy trees” problem.
An alternative hypothesis is that it is not possible to select trees that are good temperature proxies by combining tree site information with temperature/growth correlation information. One reason for this could be that each tree responds to a mixture of various fluctuating factors with temperature playing a negligible role. In this case, some trees will still correlate well with temperature over some window, but that would be basically a coincidence. If we were seriously investigating this hypothesis, we could try to figure out how many trees would match some particular measured historical temperature correlation criterion due to mere coincidence. To estimate this, we would want full data from all trees, in order to apply statistical methods that would build a stochastic model.
In order to facilitate all the above sorts of analysis, anyone who collects dendrochronological data and then selects particular trees which are felt to be “valid temperature proxies” is obligated to (a) describe, in sufficient detail to allow replication by others, the process by which this selection was made, (b) reveal all the data, from both selected trees and rejected trees, so that others can test the analysis.
Not publishing or even discussing in detail the data from unselected trees impedes such analysis, and should lead to loud grousing from other scientists.
bump
BTTT.
Can anyone point me to where the data from this Starbucks exercise is recorded? I see a graph from one tree above, and the link to the spreadsheet does not seem to work.
Steve: for now, change .org to .info.
Thanks, got the spreadsheet and it seems to have exhaustive information on the sampling procedure. Is the ring width data by tree id available?
2 Trackbacks
[…] http://www.climateaudit.org/?p=2183 […]
[…] fill in the last 25 years that seems to be part of that “tricky” divergence problem. In A Little Secret (Oct 2007) Steve […]