So far, I’ve received preliminary measurement data on 8 trees – all trees with Graybill tags. Today I’m providing some notes based on a first look at this data. As noted before, the archive identifications do not match the Graybill tags. Pete obtained some information which has enabled us to make a limited concordance.
We have learned that Graybill tagged 41 trees at Almagre (tags 84-37 through 84-77). Pete and Leslie located 17 of the 41 trees (before the lightning storm cut their trip short.) Pete may locate some more today or it may have to wait until next spring. Here’s something puzzling: of the 41 tagged trees, only 16 trees were archived (the Graybill 1984 collection are in the id range ALM02 to ALM30; measurements made by Lamarche in 1968 are in the ALM41 and higher range).
Of the 17 tagged trees that Pete located, 8 were drilled. Of these 8, only 3 were archived. However, as shown below, our results reconcile well on these 3 cross-checks.
Of the 41 Graybill tagged trees, we have learned that there is cross-dating information on 38 of them. So the non-archiving of these 22 trees isn’t because cores were lost and cross-dating did not take place. Of the three tagged trees which lack cross-dating information in Tucson, all three have been located and two were drilled (the three missing are 37, 50=PH28, 51=PH29).
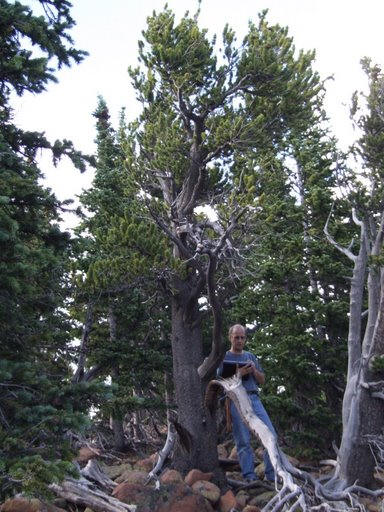
Please refer to the tree gallery for pictures. And BTW none of the trees are showing record positive growth through teleconnnections to recent warn 1990s and 2000s – actually recent growth in these 8 trees (more will come soon) is at historically rather low levels.
Three Reconciled Trees
In a recent post, , we showed a cross-matched Graybill photo with one of Pete’s photos, showing that the Graybill photo was of his 84-55, our #30.) We have now determined that this tree reconciles to the archived ALM16. Here is a plot showing our measurements (red, black) versus Graybill’s (blue). This is an old tree. As you can see, one does not observe the explosive recent growth that characterizes some strip bark trees. There is some difference between Graybill and our values in the 15th century, but my guess is that this results only from elliptical-ness in the 15th century. Recent values have been declining.
The next tree cross-matched to archived data is our Tree #33 (Graybill 84-43), which is archived as ALM06. Again here is a plot showing our measurements in black-red and Graybill’s in blue. Once again, there is a good match between our measurements and Graybill’s (although our core was not as long as Graybill’s.) In this case there are no large discrepancies between the two cores – something that is not always the case, and which seems like a useful check on ellipticity.
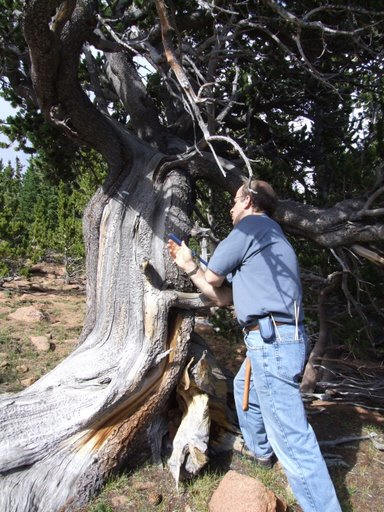
In this case, as shown in the photo below, although the tree is strip-barked, the morphology doesn’t look complex and the “good” half of the tree has a relatively healthy appearance.

Tree #33 (Graybill 84-43; ALM06)l
The third reconciled tree is our Tree #47 (Graybill 84-52; ALM13), which Pete observed to be relatively whole-barked. Here is a plot again showing our measurements (red,black) versus Graybill (blue). In this case, our cores were longer than Graybill’s, but again there is coherence in the overlap. In this case, one could plausibly imagine a negative exponential age effect (that is not plausibly detected in other series.)

In this case, as shown in the photo, this is a relatively whole bark tree.
Tree #47; Graybll 84-52 archived as ALM13.
Three Cross-dated Unarchived Trees
Next here are three trees that we cored, which have cross-dating information at Tucson, but which are unarchived.
The first is our Tree #1 (Graybill 84-56), which we’ve already discussed as an example of strip bark. Here’s a plot in slightly different format (left panel – smoothed with an 11year gaussian filter; right panel – 20th century.) In this case, ring widths peaked in 1915 and there has been a continuing decline through the 20th century right to the present. A picture of this tree is in the earlier post here. The discrepancy between cores appears to be entirely due to strip bark ellipticity.
The next cross-dated and unarchived tree is our Tree 37 (Graybill 84-41), which has almost the opposite history to the one above, as shown below. In this case, the tree experienced explosive growth in the 19th century reaching 3-sigma ring widths. This seems very characteristic of a strip bark pulse. In this case unfortunately we only have one core. Pete’s notes report that this tree was strip barked and was hollow.
The third tree in this class is our Tree 48 (Graybill 84-54.) The picture of this tree shows that it is strip barked. The plot below shows a noticeable discrepancy in the 19th century history between cores.
Two Other Tagged Trees
As noted above, there are three tagged trees for which our reconciliation shows no crossdated match, two of which we drilled.
The first is our Tree 28 (Graybill 84-50.) In this case, we have 3 cores shown below in black, red and green. Here the strip barking seems to have introduced a pretty complicated pattern: notice that the green core is lowest in the 17th century, highest in the 19th century and in the middle in the later 20th century, completing the permutation of cores. So it’s not that one aspect of the core is always the widest – but places can change. In the mid-20th century, there was a strong increase in the red core, accompanied by an equally strong decrease in the green core. Arrrgh.
This is a pretty complicated looking tree as shown here.
Tree 28 (Graybill 84-50)
The other such tree is our tree 29 (Graybill 84-51.) This history is relatively short, and had maximum values in the early part of the 20th century.

Some Thoughts on Sampling Strip Bark Trees
Based on our short introduction to strip bark sampling, one immediate conclusion is that, if one is going to bother sampling these trees at all, it is absolutely necessary to have multiple cores. The discrepancies between individual cores can be enormous – far more than any conceivable climate signal. The discrepancy may give some information on the timing of the strip bark occurrence. It’s tempting to think that an incipient discrepancy, such as in Tree #31, may give information on the timing of strip bark occurrence. But whether it does or not, it seems like the specialists should at least commence coming to grips with the impact of this phenomenon before including this information in samples.
It also seems clear that the “error” introduced by strip bark is not random in measured data. In the samples that we’ve seen (which are inevitably from the strip bark itself, the strip bark seems to introduce a strong positive pulse. There are no corresponding negative pulses to cancel out. So if strip bark pulses are not randomly distributed through a record, but concentrated in the later part of the record, you could easily get a “strip bark” bias. How many such trees would it take to affect results – one would need to do some calculations, but given the extreme size of the bias in some cases (3-4 sigmas), it wouldn’t take very many in the relatively small Graybill networks to distort results. As an objective statistical criterion for bristlecone and foxtail sites, it seems to me that any usable tree should have visual confirmation that it is not strip barked and that you have 2 or more cores that need to pass some sort of standard for non-ellipticity.
In addition, the failure of the Tucson dendroclimatologists to archive all of Graybill’s data is disquieting,particularly when there has been no previous information on the incompleteness of the archiving or the reasons for the incompleteness. The very incomplete nature of the Graybill archive at Almagre (only 16 out of 47 tagged trees) makes one wonder about what happened at other sites (Sheep Mountain, Campito Mountain). Graybill and Idso 1993 reported that they focused on strip bark, but this does not say anything about selective archiving:
These so-called’ strip-bark’ trees can have active cambium that is only a few centimeters in width. Foliage and cones are also accordingly limited. Trees of this nature were the primary focus of investigation whenever possible. They were most commonly found and sampled in stands of bristlecone and limber pine in the Great Basin and in stands of foxtail pine in the Sierra Nevada.
Did Graybill share Esper’s view that results can be withheld if the purpose is to “enhance” a signal? In the Almagre case, it’s not that I’m suggesting that the inclusion of the unarchived results would yield a “right” answer relative to what Graybill has reported. For the purposes of calculating a chronology, the NAS Panel recommended that strip bark trees be “avoided” and that seems like the only prudent course of action. But for the purposes of research, surely there is no excuse for selective archiving. Yeah, tree #31 is an extreme case and I’d agree that it shouldn’t be included in a chronology. But to give an idea of what strip barking can do, it’s sure informative. And by withholding this sort of information, perhaps readers become less attentive to the possibility of less extreme examples of the same effect. Regardless, all the results should be archived.
And, oh yes, none of the trees are showing record positive growth through teleconnections to the warm global 1990s and 2000s.


69 Comments
Just to clarify, the conclusion that strip bark causes a pulse of growth is based on the observation of an unexplained pulse of growth in the recent past? Or is this confirmed with some lab analysis on that portion of the core that it’s reaction wood, such as lignin/cellulose content?
#1. We’re just feeling our way here. Given that these strip bark trees have been repetitively used in peer reviewed studies, you’d think that they would have studied strip bark previously. But to my knowledge, there is no such information in the literature. I personally don’t know whether the wood on the other side of the bare wood is “reaction wood” or something different or whether “reaction wood” is an applicable concept here. We’ll try to get information on this, but it’s new territory for me and Pete.
I think we discussed some aspects of the strip-bark biology in an earlier thread. My take at that time was that assuming a healthy root system, if half the tree were killed (including half the roots), the surviving roots and crowns would expand to make use of available space and resources. But this would require more movement going through a narrow conduit from the roots to the crown, so the amount of wood laid down would increase correspondingly. In essence you’d have a young tree but with the small bole being linear rather than in the form of a circle. Eventually, if the tree lived long enough it would engulf what’s left of the old trunk, but until then the pulse of growth is pretty easy to understand. Why it hasn’t been discussed in the dendroclimatical literature, assuming it’s been understood, is hard to fathom.
1,2: Reaction wood would not be formed as a result of trauma. Only as a result of abnormal compressive/tensile stresses.
4, is there a different phenomenon that results from bark removal and/or the trauma that causes that? Does the wood, in fact, grow more than it otherwise would in response to that? Wouldn’t the loss of a branch, for example, upset the statics of the tree, and cause reaction wood to grow?
3: I’ll bet you are correct. I would also surmise that the glucose that is produced by the foliage to form wood would be devoted to less surface area, resulting in faster radial growth (I guess you kinda said that).
5: Re: your second question, see #6. As far as the other questions, not as far as I know.
Regarding the growth spurt, I don’t understand the claim that the stripping of the bark would result in a growth spurt in the residual bark. Is there a transverse transfer of nutrients and water from the roots that would otherwise have served the stripped portion of the tree to the unstripped portion? I can see that if the stripping were on the south side of the tree it might eliminate some shading of the north side. Can anyone explain?
re: #8
Consider just water for the moment. Trees in general don’t keep every root forever. Just as the upper part of the tree sheds needles after a while, so the smallest roots will die and the regrow when there is sufficent water. And they will continue to grow as long as there’s enough sap coming down and enough water to use it. But there won’t be competition for water from other parts of the tree and thus the growing season will be extended. So they will gradually move into the now open areas where the other parts of the tree had roots and absorb water and other nutrients. Also, as you say, there will be less shadowing by other parts of the tree to keep the remaining part of the tree producing all it can which will provide more sap for the surviving part of the tree’s root system. And I suspect that there is some recruitment of other roots which now don’t need to supply now dead parts of the tree. I suppose someone should go find a good book on the biology of BCPs and related trees to see just how much of this sort of thing can happen.
re: #9
Okay, let’s call your hypothesis the “reduced competition model” for the growth spurt. But wouldn’t we expect the same to happen whenever a neighboring tree dies? I am not arguing against what you have claimed, but if it is true, then even trees without bark stripping might be subject growth spurts from the same effect.
Please pardon my lack of reading, but I do not know much of the nutrient pathway in these trees from the roots to the crown. e.g. Do roots on the North side feed only the North aspect of the tree, and how narrowly, or do they diffuse all around the trunk by a certain height and feed NSE & W? (Leaving aside complications like spiralling). Question: Is it possible that strip bark results from loss of root function below where the bark is now missing? Once bark is lost in large quantities, it might never grow back (as for the canoe trees I mentioned elsewhere). I simply cannot see from the images where the top and bottom of the stripped intervals lie.
It’s too early to speculate yet, but I suspect I see a poor cyclicity in the longer results with a period of about 20 years … not sunspots again?
Also, on the graphs above, most come together about year 1800, especially the devil-devil 2007-28, which of itself is almost enough to question the whole method in the trees sampled – which I presume, would have been one of your working hypotheses.
Small philosophical point. Some say strip barks are the oldest trees and have longer records extending back into historical warming and cooling periods as described in history. I suggest gently that the urge to get these old events is not balanced by the need to use suspect samples.
Yes, this is the reason timber producers thin trees in a forest. It usually boils down to WATER availability. BTW, I have an undergraduate degrees in wood science and forestry, a M.S. in wood science, and a PhD in wood chemistry. I have not “practiced” in these areas for many years and have not kept up on the literature, but I do remember some stuff.
Addition to 12: that’s why this blog appealed to me. Trouble is that I tend to go WAY beyond my field of expertise sometimes, LOL. But many others here do, also….
On thinking a bit further about it, I can see that eliminating a neighboring sector of the tree’s water/nutrient collecting area would remove more competition to the still vital area of the root system than would eliminating competition from a neighboring tree’s root system, so perhaps the death of a neighboring tree would have a much less significant effect. In tree thinning they probably eliminate all of a tree’s immediate neighbors, so the effect will be greater.
I shalt devise a name for it. Compensation Wood. Or Over-Compensation Wood. That is if the phenomenon doesn’t have a name, and of course, if it exists at all, which I think it does per my previously posted ficus v. auto observation.
12 jae: I have to disagree your generalization in this matter. Just out of topic. In commercially utilized forests the above ground competition plays a major part. Why stands are kept in crown competition mode is to 1) maximize timber volume of the stand and 2) maximize valuable timber share of the trunk through natural de-branching (this way the trees form trunks that are knot free, thus high timber value). In this method stands are thinned before the crown competition starts to inhibit the tree growth (too small crowns). This has nothing to do with root competition and water in most of the commercially utilized forest stands. This natural method is copied by man when foresters cut the lower branches up to 5-6m height.
This has nothing to do with the topic thought. BCP stands are quite different compared to commercially utilized forest stands.
Steve McI,
This is very interesting stuff. If indeed all the strip bark trees show the same behaviour, it undermines the old theory of CO2 (or other) fertilisation and of course the “teleconnections”. When all the results are in, it is worth to be published in Nature!
One addition: to make it complete, you need sampling of the bare wood to know when the growth spurt exactly started, probably after lightning strike. That would give definitive proof that the growth spurt is the result of the stripping, nothing else…
Non-scientist’s observations:
Trees are quick to exploit nearby moisture and nourishment, and in the case of maples and oaks seem to send out exploring roots through sterile and hostile soil seeking richer soil:
1.)I have often seen trees send roots under two lane roads to rich soil on the far side.
2.)Roadside maples send long roots far out into cow pastures, four times the reach of the branch’s drip-line.
3.) Planting shrubs creates small area of rich and moist soil. In one case three years later the shrub was stressed because invading maple roots were “stealing” all the water.
4.) A raised bed of rich soil was put in sun well outside of an oak’s drip line. Within seven years the raised bed was so packed with oak roots a shovel could not penetrate more than two inches down, even when you jumped on it.
I conclude that even if trees send out roots randomly, they are so quick to respond to what they find that it is as if they “think.”
Re: Stripbark Physiology
Partial cambial mortality in high-elevation Pinus aristata (Pinaceae)
ITRDB Dendrochronology Forum
And from the Forest Service, U.S. Department of Agriculture, more than you ever wanted to know about Pinus longaeva which includes this interesting gem:
Every part of the tree is self-dependent. As far as the part, root or branch, provide tree more then it use, the part lives. Thus, if lower branches are shaded by upper ones and lower part cannot produce enough energy through photosynthesis, they dies away. Same to roots. As long as roots are beneficial for the tree they stay alive. I mostly mean “hair roots”, very thin roots that mostly absorb water and nutrients from the ground. Larger roots stay alive, but their ability to absorb water is very low. When the resources from that part of the soil is used, hair roots die away. Because trees can very quickly grow new hair roots they are very efficient to absorb available water. Thus, in dry regions, root network is large so that when water is available trees can absorb as much of it as possible when water is still available.
Also, root systems of some tree species can be interconnected by mychorizae fungi (root nodes). This way strong individuals utilize poor individuals root system to absorb more water and nutrients. I do not know if BCP has this kind of symbiotic relationship with any mychorizae fungi.
But, too much detail is not important because dendrochronology can only reveal factors that are most limiting. Other factors are lost in “noise”.
I am fairly new to all of this, so there is likely a lot that I don’t know about using tree rings as climate proxies, but relying on recent data from centuries-old trees is inherently frought with problems. Doesn’t it make more sense to base one’s climate reconstructions for the past using data from a combination of trees that have a narrow age range for each of the periods you are attempting to reconstruct. To give an example, if you wish to have tree ring data for the year 1100 A.D, then you core a tree that is that was, let us say for the sake of argument, 75-150 years old that year; and for data on the year 1600 A.D. take data only from trees that were, again, 75-150 years old that particular year, and so on, so that data on the year 1998 would only be obtained from trees that are 75-150 years old. Or, are the proxies already done using a similar kind of method? It doesn’t appear that way to me since most of the cores I have seen discussed here and elsewhere came from trees that were greater than 700 years old.
Steve: Dendroclimatologists purport to allow for aging of tree. Of course the devil is in the details regarding these adjustments.
Very interesting. So my question is what is the relationship between ring widths and temperature for these trees? Or have recent temperature measurements over a number of years been compared to tree ring widths, wood density, etc to obtain a preliminary relationship that could then be used to extrapolate into the past? I assume that this trees grow all year round, albeit at different rates.
Great work, Steve, once all the results are in you must write it up for formal publication.
re just about every other comment- “not seeing the wood for the trees….”. isn’t it becoming blindingly obvious that biological systems have too much innate variability/limiting factors/ inverted U type growth responses to make them suitable proxies for climatic reconstruction?
Dendroclimatology is looking increasingly bankrupt as a rigorous scientific discipline, failing the basic tests of reproducibility and verification.
It is clear that the scientific community be giving much more weight to purely physically-based climate proxies.
In my mind these findings present additional opportunities for and susceptibilities to data mining/snooping and over fitting of calibration models.
RE: #13 – Dr. jae, it’s no problem. This is perhaps the world’s best interdisciplinary program at what is becoming a notable ad hoc open university.
Why is there any problem with reconciling Pete’s cores with Graybill’s? A core can teleconnect to the slight influence of temperature 500 years ago, but cannot even identify another core from the same tree?
MrPete
In my #12 I suggested tongue in cheek that dendro data converged in year 1880.
Something happened in 1880. If you have time, look at these NH & SH temp graphs at 1880.
http://www.cru.uea.ac.uk/cru/climon/data/themi/n17.htm
http://www.cru.uea.ac.uk/cru/climon/data/themi/g17.htm
My interpretation? No idea whatsover.
$27 correction: In my #12 et seq, read 1880 not 1800. Wow. I’ve just made some observational (pattern) data available instead of hiding it from the science community, while admitting that I had made an error. Watch out Alfred Nobel.
Just to stir things up a bit 😉 …
Personally, I don’t think these major swings have anything to do with temperature. In fact, we suspect they have very little relationship to climate (other than the fact that trees need water to stay alive.)
I *did* get up into the mountains over the weekend and lived to tell about it. Collected a lot of detailed photos from the same trees (plus a few more discovered along the way.) Brought a Real Compass this time, so can correct some of the N/S/E/W directions etc.
Due to real-world pressing work, I need to set this aside for a bit (board meetings etc), but will be back. There’s a lot of data to process!
I agree. Never did think much of dendrothermometry, although I think it is conceivable that there are some trees somewhere whose growth has been limited by temperature for a long period of time. Somewhere where moisture is not a problem. I recall some studies of Idaho trees that seemed plausible.
Re: “dendrothermometry” and other derision
Trees need sunlight. It seems pretty intuitive that they would respond to it annually by “putting on weight”. I’m out of my discipline, and perhaps out of my league, but mightn’t one expect to see such a signal in river basins, or even in flatland trees? Some of the bristlecones in Steve’s / Pete’s ongoing experiment might point one direction or another with this regard. I fear certain dogmas have come to govern the thinking:
From what I can gather, An Introduction to Tree Ring Dating, by Stokes and Smiley is a manual for training dendrochronologists. The “big thing” here in the West has long been discovering / predicting signs of drought. If memory serves, A.E. Douglas was himself hired during the dam building era to search for that rosetta stone. These goals of the science must have imparted a spin to its methods, born out of the search for “sensitivity”, clearly discernible narrow and wide rings, an easily read signal. In other words, those trees that reside on hillsides, where they must be immediately responsive to water as it appears in the West, sporadically, seasonally. If “complacency” has, in fact, governed the climate scientists’ attitudes to all those others, those “fat and sassy” trees with their roots sunk in the water table of lakes or perennial creekbeds, maybe there’s a signal yet to be discovered. Maybe I’m a wide-eyed optimist.
But if there is any answer to the AGW hysteria, isn’t it in that signal?
I look forward to Steve’s ongoing graphs and observations. I’ve been astounded so far. Maybe results for cores #1 through 18 (excluding 13 and 16), and 23 will prove even more interesting.
BTW
Can anybody give a link to the Donald Graybill paper (or summary thereof) that launched this endeavor? I don’t see a record of it in Steve’s blog – only the allusions to it. I’ll try Googling later.
Just for fun, here (hopefully) is an embedded panorama from treeline on Almagre. More to come eventually, including Google Earth embedding. (Sorry for the delays but I do have a life 😉 ) Wait a bit for it to download…
function FlashProxy() {}
FlashProxy.callJS = function() {}
sorry, apparently needs “super editing” to get ampersand characters into the html. oh well.
I’ve set up a Giga-Panorama of a Bristlecone site on Almagre. Go to this link to view it. And from there, you can also view it in Google Earth. Rather nice…
https://www.gigapan.com/gigapans/1482/snapshots/3541
Re #27: Looking at the two charts there are peaks in the increases about every 60 years.
So the current peak has just passed. Are we going down now??
Do we have any temps back to 1800?
This should come as no surprise since bristlecones by definition are a moisture limited species (that’s why they grow so slowly). Only a practitioner of Voodoo Science would be able to coax a temperature signal out of the rings under these conditions.
Moisture limited, indeed. Which is why all the experts concluded that the BCP are not
good temperature proxies and shouldn’t be used for that. I fail to see why this needs
to be such an overall difficult subject for the people using them as temperature proxies
to understand.
Sam #38,
Because it’s a fairly gray issue, not b&w. The treemometers are somewhat indicative but not perfectly accurate. They’re a useful indicator, but not reliable enough for hair-splitting over what may or may not be “unprecedented” in a thouuuus-and years. But each group tries to distort the facts to suit their agenda. The denialists want the data dismissed outright; the dendros don’t want their funding cut. No one is happy with gray.
bender #39
Suppose you have a tree ring chronology from a species that you know to be moisture limited but you’re looking for a temperature signal. What is your first step when beginning your analysis? How do you determine that moisture is not such a dominate influence on ring widths that it essentially swamps any other signal?
#40 To begin, how do you “know” that it is moisture limited? By manipulative experimentation, or by natural survey/correlative guesswork? The answer here will inform the subsequent investigation.
#41, these trees are in super dry colorado, at 11,000 feet! They are not only moisture limited, they are also C02 limited.
Gunnar, there is no need to lecture me on the theory of moisture limitation. I am asking a very specific question about evidence. For a reason.
>> there is no need to lecture me on the theory of moisture limitation
Where did I do that? I believe I just stated an obvious fact. The higher the drier.
Gunnar, what you take to be an “obvious fact” I take as a likely hypothesis. For an empiricist – which I presume ferris to be – the proof is in the pudding. But never mind. If you don’t know my stance on bcps you haven’t read the blog.
bender, I think you and I are headed in the same direction, so let me rephrase the question.
Suppose you have a tree ring chronology from a species that you suspect to be moisture limited but youre looking for a temperature signal. What is your first step when beginning your analysis? How do you determine that moisture is not such a dominate influence on ring widths that it essentially swamps any other signal?
btw, Gunnar is right, but we’ll save that argument for another time. 😉
I never said he wasn’t. I asked you a question. Which you still haven’t answered, incidentally.
But since you’re so knowledgeable about the problem and the facts surrounding the case then you tell me what is the best approach for extracting the temperature signal when it is emdedded in an interaction with other limiting factors. IMO it is an area of active research. If you are active in that area, then please feel free to enlighten us. I’ve got my opinions, but they are already a matter of public record. What’s your view?
No need to get testy.
I asked a simple question which was deserving of a simple answer. Seeing how an answer will not be forthcoming, we’ll end the conversation here.
I wonder if these guys have looked just at the width of the earlywood portion of the growth rings. Moisture should not be much of an issue during the early part of the growing season, and maybe a temperature signal would stand out. I suppose they have tried this.
How do you differentiate wood that grew in March from wood that grew in August? My understanding is that a good spring growing season and a poor fall one, would be indistinguishable from a poor spring season and a good fall one.
Hmmm. Well, bender, I don’t think it’s such a gray area, but I do agree everyone tries to spin it. 🙂 That isn’t important, I’m just asking why it’s so difficult to understand what was stated; these trees in question are not good temperature proxies and shouldn’t be used. Just because the language is passive doesn’t change that. They are good for some things, but not as temperature proxies. Just sayin’.
BTW, ferris was asking you a question presupposing you know they are. I’m interested in the answer to his question (or a link) if you prespose you know that.
(But that’s ignoring that a dry area at 11,000 feet is going to be mostly noise, so my question in the first place would be why bother?)
You were asking about how to decouple the signal from the noise. I wouldn’t see how you could do that unless you had a humidity/rainfall/co2 history of the area, and a resolution in the tree that was sufficient to tell the difference. I’m “sure” there’s some spiffy method of using statistics and experimentation to extract temp from the rest, but I’m not a stat guy or a dendro guy.
Or was your point the answer is “You can’t.”
50, Mark: In temperate zones, most of the growth occurs early in the season and it consists of thin-walled cells, called earlywood. I think most of that growth is completed by June (maybe by July at treeline). During the rest of the summer/early fall, dense, thick-walled “latewood” cells are formed. The demarcation between earlywood and latewood is fairly abrupt for BCPs, so it would be possible to measure the width of the earlywood zone. However, now that I think about it, the amount of latewood in BCPs is quite small and fairly constant, so I don’t think my suggestion has merit. Cancel it.
Re: # 48 ferris says:
November 14th, 2007 at 11:12 am
You wrote: “What is your first step when beginning your analysis? How do you determine that moisture is not such a dominate influence on ring widths that it essentially swamps any other signal?”
You are asking the question we want to see answered, because many of us do not see a scientifically valid means of doing so. For example, even though there are many species of trees in the Colorado mountains such as the Ponderosa pine which require minimal moisture, the present studies do not appear to address any number of possible confounding environmental factors which could severely impair the validity of current reconstructions methods. In particular, the dendo reconstructions rely on a variety of 50 year to 100 year calibration periods from the natural streamflow gages as the basis of statistical calculations. These statistical calculations by even the most optomistic standards are estimates which are hugely reliant upon a calibration environment which may not have existed for major portions of the paleo periods under reconstruction.
In particular, these reconstructions have no calibration experience with a major change in air mass regimes which swap air mass and precipitation sources between the high latitudes and the tropical latitudes. Temperature and humidity affects evapotranspiration rates, whether or not the subject trees are moisture limited. Changing from a general cold and dry regime to a warm and wet regime or a warm and dry regime on a decadal or centennial scale may or may not induce adaptive responses in different species of trees. These differential responses may change the growth habits and ring widths in ways which have not yet been characterized and understood properly, because the regimes in which such changes took place have yet to be recognized, much less measured with any confidence.
Given these and other unknowns about the environments involved in the tree growths and their responses, it remains to be seen how it is reasonably possible to assume there is a first step which is capable of yielding the qualitative and quantitative values being sought. How do you believe there is a valid means of completing a first step with confidence in the results?
A previous discussion somewhere here 😉 linked to a paper demonstrating that:
* Most tree growth is in the spring
* Timing and quantity of growth is highly correlated to timing and quantity of available snowmelt/runoff from the winter.
Hopefully someone can find the paper linked. Sorry, no time for me to do that right now.
Let me see, I think I confused myself.
You would have to have a way of telling what in the tree was the result of insufficient CO2, what in the tree was the result of insufficient moisture (water and humidity levels) and what in the tree was the result of the altitude (I assume oxygen comes into play here).
I don’t know, isotopes? Is there enough resolution to find these things out even?
Re: # 55
November 14th, 2007 at 1:23 pm, Sam Urbinto says:
Sam,
The dendochronology reconstructions rely upon inconsistent methods and standards of using natural streamflows or gaged streamflows to assume a given quantitative value for the moisture available in the watershed of the trees being sampled. Variables in the statistical sampling and assumptions used to then apply variations in regression methods results in a plethora of methods and techniques. Statistical tools are judged by dendrochronoligists to produce reasonably reliable methods and results. However, the calibration periods and regimes used to calculate the confidence levels are extremely short at around 50 to 100 years when comparing to millenial periods. We need to ask what evidence there is to rule out other confounding factors, just as you have asked about oxygen and I have asked about major oscillations in air mass regimes.
54, MrPete: This is not the one that was linked, but it is related and very interesting.
Here’s another ref. It looks like the PDO has an enormous effect on tree growth in the Pacific NW. High snowpack, less growth.
Thanks D. Patterson, I thought it was something like that, nice to have a summarization of all the things involved.
We know plants take in oxygen during part of the growing cycle, so why not ask about oxygen deficiency if you’re going to ask about carbon dioxide deficiency?
That could be a factor if major oscillations in air mass regimes changed barometric pressure in some way and therefore the the lapse rate from 0 (If we’re talking about those trees at 11,000 feet still).
How about wind? What happens when the wind shifts and dumps a bunch of moisture on the trees? Or dries out the rain faster than usual and takes moisture away? How can we account for that?
What if somebody put a BBQ, lawn sprinkler and air conditioner next to the tree?
re: #59 Sam,
Please don’t post such silly statements! They detract from the serious science. CO2 and O2 are going to be in about equal quantity during different times of the day. O2 is present as 20% but CO2 is present at 340 ppm, several hundred times less. There’s never going to be a deficiency of O2 for plants.
Re #60
Dave Dardinger,
Science need never be pompous! Asking the wild what-if questions is fine, they show a mind probing at the limits of our ignorance/understanding. Granted sometimes those random walks of thought experiments take you to a place where, given a moment’s pause, you realise the obvious contradiction and are left with ‘Doh!’ as the answer. Still, those questions should be encouraged. Please in the future don’t be so quick to slap down the wandering mind. A gentle nudge in the right direction will suffice.
Regards,
Earle
Dave, those were what-if thoughts on other possible issues. I am thinking you are aware that there is less oxygen the higher you get. I don’t know myself if by the time there’s “not enough” oxygen it’s too cold anyway (or even as another what-if, what kind of CO2 concentrations would there be at that altitude anyway, because of the pressure bands). Or put another way, does it ever get oxygen deficient before it becomes “too cold”?
Do you have anything showing such a thing? That would be more helpful.
I wouldn’t categorize that as “silly” any more than it’s nonsense to ask a climate modeller, that a model correctly hindcasting the last 10 years give me a run forecasting the next 10 years to both get an unchangable result and make them show they have faith in it.
I assume you’ve never run 5 miles in the high desert compared to at sea level? I wouldn’t want to run 5 miles at 11,000 feet. 4,600 was bad enough.
Although of course, logically, if the tree is growing there, there must be enough oxygen for it to live, but it may not be living as well as it could (the same can be said for any factor I guess).
re: #62 Sam,
Sure, and that means there will be 50% as much O2 at 6000m (18000+ft) as a sea-level, but that’s a trivial reduction compared to the absolute difference in CO2 vs O2 levels. I’m thinking you’re able to run order of magnitude calculations in your head and shouldn’t need to make speculations which can’t possibly work.
Now if plants were like people and had to take the O2 in via a blood stream it’d be another story, but they simply use stomata so you can compare concentration to concentration.
Third thing to rescue something from this pointless discussion. The fact is that the concentration of CO2 at the earth’s surface is about as low as it can get and maintain our present ecosystems. Plants will draw down the CO2 concentration over time so that it’s basically the limiting factor. That CO2 is now rising to “unpresadented levels” for some time isn’t particularly worrisome, just a temporary blip which plants worldwide would be thanking us for if they had or needed lungs.
Dave, it is rather pointless, it’s just ‘what if’. But is it possibly a factor? And yes, I understand the difference between sea level O2 volume at about 21% and CO2 about .04% being 2.5 orders of magnitude away, of course. But they are different things, you can’t compare them directly. What oxygen levels do plants like? I don’t know. Instead of being confrontational, why don’t you tell me how much O2 plants like? You usually seem pretty helpful and I’m rather surprised by the hostility.
As far as CO2, I know plants can grow 50% faster at .1% carbon dioxide. I also know that 1% will knock a person unconsious and .5% is considered unhealthy. Which is basically why you can’t compare it to O2 any more than you can compare its percentages present to those of methane, sulphur, water vapor, nitrogen or silver.) (Silver? Yes, unless it weighs a few pounds, it can’t hurt you if it falls on you, but other forms of silver can cause death. What’s the LD50 of a thousandth of a gram travelling at the speed of light entering a person’s stomach?) Dihydrogen monoxide is one of the most dangerous substances on earth but without it we’d die. We need to know the circumstances to determine what it is the meaning of something is. The level of something depends upon the relative importance of it in the context we find ourselves. If something is “normally” 21% and something else “normally” .03% doesn’t increasing or decreasing them the same way sometimes (depending on the substance) result in the same effects and sometimes different ones? If you cut both 50%, what does A at 10.5% vis a vis what B does at .015%?
Let’s look at it this way. A hypothetical.
Plant A “likes best” 15% oxygen and .1% carbon dioxide and a temperature of about 60 F and 200 inches of rain and starts growing in such an environment. Over time as climate changes, conditions change and we are now at 10% oxygen, .05% carbon dioxide, 50 F and 100 inches of rain. Will the plant die? Probably not. Is it deficient on such matters? Yes. How well can it handle it? Depends on the plant. Might make little difference. Might kill it.
On the flip side, how about if it’s 20% .2% 70 F and 200 inches. It’s now “enhanced”. Could that kill it, will it handle it, who knows. More doesn’t mean better any more than less means worse.
But in neither case is it “where it wants to be” when conditions change.
That’s just sidetracking everything. The point is, do these things and the other variables have to be taken into account? Maybe. Which ones? I don’t know. Can the signals of “such things” (those and things like amount of sunlight, direct or difused. Normal air humidity and barometric pressure. Length of growing seasons. Amount of snowfall and speed with which it turns to water.) be removed from any study we do of the plant itself, to try and use it as a proxy for any of the variables or any other ones?
Are you categorically denying that O2 could be a factor in “some way”?
This (treeometers) is a microcosm for the climate change debate; how do the factors overlap and what effects do they have. The fact is, there are a lot of factors involved, you look at them, and you determing which ones are important, what’s not, and how everything interrelates.
Re: #53
Thank you D. Patterson for the thoughtful response.
Not only is there a calibration problem, but what is streamflow telling us to begin with? We know that it’s indicative of the depth of snowpack – that’s a given – but is it indicative of plant available moisture? In the beginning of the growing season it probably is, but because the medium in which the BCP grows is severely limited in it’s ability to hold water, this cannot be a reliable predictor across the full growing season.
So I’m back to my original question, How do you determine that moisture is not such a dominate influence on ring widths that it essentially swamps any other signal? Without a nearby rain gauge and temperature sensor, along with a suitable calibration period, I do not see a way to accurately account for moisture’s influence. Am I wrong in that assumption?
re: #64 Sam,
Sorry if I seemed harsh. Perhaps it’s just that having been trained as a biochemist I’ve internalized the subject and can’t understand how someone can not realize what’s up with O2. Basically O2 is used when a livig thing wants to burn sugars, etc. for energy. Actually, oxygen isn’t used in the main cycle of respiration. It’s used by heme-like sorts of molecules to oxidize hydroquinone sorts of compounds and produce a couple or three ATP molecules. The net result is water and the oxidized quinone which then strips off more hydrogen from a molecule to oxidixe it and become the hydroquinone again. But the point is you need the same amount of oxygen to burn the sugar as was produced when the sugar was created from CO2 and H2). So the amounts of oxygen needed at night, say, is the same, at most, as the CO2 needed during the day to produce sugars. Actually the plant normally stores part of what it produces for growth and seeds, etc. And since there are hundreds of O2 molecules around for every molecule of CO2, It’s always going to be the CO2 which is ultimately in short supply.
I suppose it could be possible that just because a plant doesn’t have to be very efficient in O2 use, it could fail to evolve enzymes which bind O2 tightly like animal hemes do. But if a plant had to live in an area, like high altitude, where it needed more O2 than it usually absorbed, it’d be pretty easy to evolve better enzymes, whereas CO2 has been in short supply for most plants since at least the Carboniferous epoch and thus all the obvious improvements have already been made.
One way of judging things would be finding areas in oceans where there wasn’t much oxygen for one reason or another but still plenty of light. What sort of plants, if any, grow in such places?
Sam U. For grins: Dave Dardinger for frowns.
Dave wrote in #60:
“Please dont post such silly statements! They detract from the serious science.
CO2 and O2 are going to be in about equal quantity during different times of the day.
O2 is present as 20% but CO2 is present at 340 ppm, several hundred times less.
Theres never going to be a deficiency of O2 for plants.”
I love sweeping generalizations.
Balloon meet needle:
http://jxb.oxfordjournals.org/cgi/content/full/54/388/1721
http://www.scielo.br/scielo.php?pid=S1677-04202002000200002&script=sci_arttext
plants under water, plants under snow or ice, plants without proper drainage
can all suffer from a lack of oxygen.
Dave will object to this as not his point.
ferris,
My apologies, you sounded like a grad student trolling for project ideas. I was/am ready to answer your question, but I wanted you to answer a question first. But I won’t play that game. The short answer is that this is an area of active research. There’s not a lot of experimental work being done. Almost all of it is passive/correlative. And with those passive approaches the statistics are everything. Herein lies a problem. Read the blog. There’s a lot here to learn. But there’s quite a bit of noise too. So visit the ITRDBFOR archives and check out their library of articles.
np bender.
I’ve just had my first look at the Abebneh thesis. There’s some interesting stuff in there that seems to confirm some of my suspicions.