In 2002, Lonnie Thompson drilled a 460 meter ice core in a col between Mounts Bona and Churchill in Alaska. As of October 2003, they had analyzed over 5600 samples and concluded that the core covered approximately 2500 years. A presentation was made at AGU in December 2004. The data was not discussed in IPCC AR4 or even in Thompson’s 2006 PNAS article. Actually, not only is the data completely unarchived, to date, there is no journal publication whatever of these results (funded by the National Science Foundations Office of Polar Programs grant OPP-0099311).
In mining promotions, whenever results are delayed, you can be 99% sure that they are not good results. Promoters can delay results a little bit hoping that more drilling will get a good hole, but there’s not much discretion. For some time, I’ve noticed the non-reporting of Bona Churchill (which I’ve compared to a similar situation at Sheep Mountain) and surmised that the results were not “good” for Thompson’s viewpoint: otherwise we’d have heard about it. Here’s one such prediction:
Heres my prediction about dO18 levels at Bona Churchill.: 20th century dO18 levels will be more negative (“colder”) than levels in the early 19th century – the opposite pattern to the pattern that Thompson is promoting for tropical glaciers.
While the results remain unpublished, Follow the Money noted a reference to Bona Churchill in a workshop proceeding here, which contained a PPT presentation (81 MB) by Lonnie Thompson, the abstract to which stated:
Records providing the necessary time perspective may be reconstructed from chemical and physical properties preserved in the regional ice cover and ocean sediments. Comparisons are made among the geographically dispersed, annually dated ice cores records from the Antarctic Peninsula, the tropical Quelccaya ice cap (Peru) and Bona-Churchill (southeast Alaska) over the past 500 years. Decadally averaged δ18O histories demonstrate that the current warming at high elevations in mid- to low-latitudes is unprecedented for at least the last two millennia.
The PPT presentation contained an interesting graphic providing the first information on Bona-Churchill 
Just for fun, let’s review the history of the Bona-Churchill project a little. Skip to the end if you want the results without waiting.
Bona-Churchill Background
The purpose of the Bona-Churchill drilling (presumably drawn from the proposal to NSF) is set out on an Ohio State webpage here:
Ice core reconstruction of North Pacific climate variability and environmental history from the Bona-Churchill Ice Field, Alaska. This project is funded by the National Science Foundations Office of Polar Programs (OPP-0099311) and is in its third year.
This project was designed to retrieve and analyze ice cores from the col situated between Mt. Bona and Mt. Churchill (61o 24′ N, 141o 42′ W; 4420 m asl) in Wrangell-St Elias Mountains of southeastern Alaska. These records will fill a significant void in the high resolution climate history of this region. These new ice core records will complement and extend the existing tree ring-based climate records for the region and will add to the suite of high resolution ice core histories now emerging from other north polar ice fields. Global scale syntheses of past climate variability include ice core contributions from both Antarctica and Greenland as well as from ten lower latitude, high altitude sites in Tibet, South America and Africa. To date the unique paleohistories preserved in Alaskas ice fields have not been tapped and thus have not contributed to this global climate synthesis. The sparseness of high resolution climate histories from the northeastern side of the Pacific Basin has been a major obstacle to advancing our understanding of the rapid and recent changes in the dynamical state of the Pacific region and its global teleconnections. The ice cores attained from the Bona-Churchill col will help fill this void and provide critical new insight to the climate history in this region.
Our scientific objectives for the Bona-Churchill cores include:
(1) Assess whether the warming of the last 30 years that appears to be amplified at high elevations in the tropics and subtropics extends to northwestern North America;
(2) Assess the character of the most recent step change in the dynamics of the Pacific Basin climate regime that occurred in 1976-77 and explore whether similar abrupt transitions have occurred in the past and if so, determine when and of what magnitude were the changes;
(3) Explore whether the recently identified multi-decadal ENSO-like mid-latitude climate variability has its roots in the tropical Pacific;
(4) Determine the bottom age of the ice on Bona-Churchill col; and
(5) Determine whether Mt. Churchill is indeed the source of the White River Ash.
By October 2003, Thompson’s group reported that they had completed over 5600 samples from over 75% of the core, which was estimated to cover 2500 years:
The analyses of the Bona-Churchill ice cores are now underway in the laboratories at OSUs BPRC. The primary measurements that are being made continuously along the length of all cores include the concentration and size distribution of insoluble microparticles (dust), δ18O, δD, and concentrations of the major anion and cation species. The upper sections of the cores have been analyzed for total Beta radioactivity. The annual accumulation rate has averaged ~1100 mm of water equivalent over the recent past. As of October 2003 we have analyzed 5600 δ18O, δD, dust and chemistry samples representing 320 meters of the 460-meter deep ice core. The dust and calcium concentrations show distinct annual variations and the preliminary results suggest that the annually resolved record will cover more than 2500 years. This bodes well for the recovery of a very high-resolution record of past climatic and environmental variability from these cores.
In an interview in May 2004, Thompson noted high levels of potassium in snow layers from the 1960s, which he thought might have come from China (given that potassium is an important fertilizer, it’s interesting to think of it being airborne at higher altitudes in the context of high-altitude tree ring growth):
A second surprise in the Bona-Churchill ice core is the high level of potassium found in snow layers from the 1960s.
Potassium is not something you usually find in an ice core, Thompson said.
His guess is that the potassium is from China, where wind lifted it from fertilized dry fields and carried it across the Pacific to settle in Alaska and elsewhere in North America. Thompson said he doesnt know if the level of potassium is high enough to boost the growth of Alaska plants.
A third question raised by the Bona-Churchill ice core is why the ice from 1,500 feet down in the core fell as snow in 1,000 B.C., which suggests that no ice existed on the mountain before then. The current theory of Alaskas past is that glaciers have covered at least the mountainous parts of the state for at least 12,000 years, when the last Ice Age started to wane. Though Thompson said volcanic heat might have affected the Bona-Churchill ice core, it shows no evidence of this.
Is it possible that the ice totally disappeared, and these glaciers are a function of climate in the last 5,000 years, in the cooling period that started in the middle of the Holocene (the last 11,000 years of Earths history)? Thompson said. To me, its a very important story to unravel.
In December 2004, there were two presentations at the AGU Fall Meeting. In one presentation, they stated:
In 2003, six ice cores measuring 10.5, 11.5, 11.8, 12.4, 114 and 460 meters were recovered from the col between Mount Bona and Mount Churchill (61° 24’N; 141° 42’W; 4420 m asl). These cores have been analyzed for stable isotopic ratios, insoluble dust content and concentrations of major chemical species. Total Beta radioactivity was measured in the upper sections. The 460-meter core, extending to bedrock, captured the entire depositional record at this site where ice temperatures ranged from -24° C at 10 meters to -19.8° C at the ice/bedrock contact. The shallow cores allow assessment of surface processes under modern meteorological conditions while the deep core offers a ∼1500-year climate and environmental perspective. The average annual net balance is ∼~1000 mm of water equivalent and distinct annual signals in dust and calcium concentrations along with δ 18O allow annual resolution over most of the core. The excess sulfate record reflects many known large volcanic eruptions such as Katmai, Krakatau, Tambora, and Laki which allow validation of the time scale in the upper part of the core. The lower part of the core yields a history of earlier volcanic events. The 460-m Bona-Churchill ice core provides a detailed history of the `Little Ice Age’ and medieval warm periods for southeastern Alaska. The source of the White River Ash will be discussed in light of the evidence from this core. The 460-m core also provides a long-term history of the dust fall that originates in north-central China. The annual ice core-derived climate records from southeastern Alaska will facilitate an investigation of the likelihood that the high resolution 1500-year record from the tropical Quelccaya Ice Cap (Peru) preserves a history of the variability of both the PDO and the Aleutian Low.
In a second presentation, they reported:
The White River Ash (WRA) is a well-documented bi-lobate Plinian deposit covering as much as 540,000 square km of the Yukon Territory, Canada and adjoining eastern Alaska. Recent studies have identified the source of the ash as Mount Churchill in the St. Elias Mountains of southeastern Alaska by comparing pumice deposits from the summit area of Mount Churchill with more distal pumice deposits of the WRA (e.g. McGimsey et al., 1990; Richter et al., 1995). In spring 2002 a team from The Ohio State University’s (OSU) Byrd Polar Research Center recovered a 460-m long ice core drilled to bedrock in the col (elevation 4420 masl) between Mount Churchill and Mount Bona (4 km southwest) to reconstruct a proxy climate history for the region. This core is also ideal to assess whether Mount Churchill is the source of the WRA. No evidence of a visible ash layer was encountered during drilling. Borehole temperatures of -24 degrees C at 10m depth and -19.8 degrees C at the ice-bedrock interface indicate the glacier is frozen to its bed. After being returned frozen to OSU the core was cut into 12,162 samples that were analyzed for stable isotopic ratios, insoluble particles and soluble chemistry. A preliminary time scale was developed using annual variations in oxygen isotopes, dust and calcium concentrations, beta-radioactivity (bomb horizons) and well-documented historic volcanic eruptions. The ∼1500 year long record shows elevated sulfate values at ∼803AD possibly associated with the second of two eruptions in the past 2000 years that produced the eastern lobe of the WRA deposit. The paleoclimate records appear to be stratigraphically continuous and show no evidence of a depositional hiatus. The absence of an ash layer in the core suggests that the WRA deposit requires further investigation, and the source and age of the WRA will be addressed.
Fisher and Mount Logan
Around the same time as Thompson was drilling the Bona-Churchill ice field, David Fisher and associates were drilling a similar legnth of core at the Eclipse ice field near Mount Logan.
Two cores (345 and 130 m) were recovered in 2002 (Table I).
They submitted a manuscript on May 5, 2005, revised and accepted Jan 13, 2006, published in Sept 2006. Fisher et al showed an interesting graphic (previously discussed here) which showed a dramatic and sharp drop in the 1840s (as well as a sharp change ~800 AD held to signal the start of the MWP.
Original Caption: FIGURE 3. (A) The d18O for PRCol (5 340 m asl) and the dD for Eclipse (3 017 m asl) ice core sites, smoothed with a 5-years low pass filter. At PRCol there is an abrupt shift in d18O of about 3 ca. A.D. 1840, that is not evident in the Eclipse record. The older NWCol Logan core also has a similar shift at the same date.We suggest that prior to A.D. 1840 the moisture flow was predominantly zonal with North Pacific sources of water, and after A.D. 1840 the flow was mostly “modern” delivering moisture from more southerly sources. The higher site receives relatively much more distant southern warm-source moisture than the lower. Compare the A.D. 1840 shift to that of A.D. 1976. (B) The deuterium excess plot for PRCol, indicating a major shift of moisture source ca. A.D. 1840. The larger excess points to warmer source oceans providing the moisture. (C) A plot of ENSO strength statistics implying that a regime shift occurred in the mid-19th century.
Fisher et al hypothesized a re-arrangement of hemispherical wind circulation patterns in the 1840s, taking place over only a few years, changing the moisture source and thus dO18 values.
The synoptic situation that would go along with the shift is that a deeper more northwest-centred Aleutian Low would draw moisture from farther south.Comparison of stable isotope series over the last 2000 years and model simulations suggest sudden and persistent shifts between modern (mixed) and zonal flow regimes of water vapour transport to the Pacific Northwest. The last such shift was in A.D. 1840. Model simulations for modern and “pure” zonal flow suggest that these shifts are consistent regime changes between these flow types, with predominantly zonal flow prior to ca. A.D. 1840 and modern thereafter. The 5.4 and 0.8 km asl records show a shift at A.D. 1840 and another at A.D. 800. It is speculated that the A.D. 1840 regime shift coincided with the end of the Little Ice Age and the A.D. 800 shift with the beginning of the European Medieval Warm Period. The shifts are very abrupt, taking only a few years at most.
Bona-Churchill Results
Here is a graphic showing dO!8 from Bona-Churchill from the workshop proceedings (Thompson and Moseley-Thompson 2006):
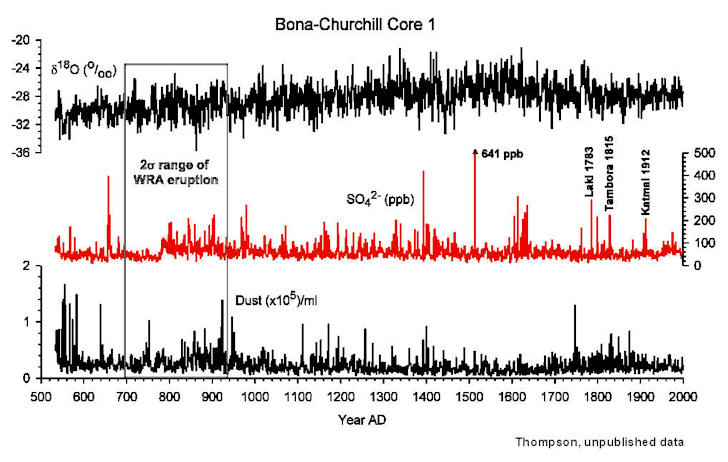
The dO18 history is a bit different from the Mount Logan history in that the 20th century decline is more mooted; squinting at the graphic, one can perhaps discern a small decline between the two centuries. However, the visual impression is that there has been negligible change between the 19th and 20th centuries in dO18 values and that there were “warmer” values from about 1350-1600. Does it mean anything? Who knows. If one thought that there had been strong warming in Alaska in the 20th century (and there is evidence of this), then one could hardly say that the dO18 histories were a useful proxy for this warming.
Thompson and Moseley-Thompson say of this data:
Decadally averaged δ18O histories demonstrate that the current warming at high elevations in mid- to low-latitudes is unprecedented for at least the last two millennia.
The U-word again. But is there any evidence of this from the Bona-Churchill δ18O history showing unprecedented warming? I can’t see any. Maybe you need to be a dendrochronologist to see it. Again, please note that the question here is not whether there is or isn’t “unprecedented” warming, but whether the Bona-Churchill δ18O history provides any evidence of unprecedented warming? I think not.
I think that my prediction for Bona-Churchill was pretty good: there’s nothing here that “helps” Thompson’s story that there are higher ice core dO18 values in the 20th century show global warming.
References:
D.A. FISHER*, C.WAKE, K. KREUTZ, K.YALCIN, E. STEIG, P. MAYEWSKI, L. ANDERSON, J. ZHENG, S. RUPPER, C. ZDANOWICZ, M. DEMUTH, M. WASZKIEWICZ, D. DAHL-JENSEN, K. GOTO-AZUMA, J.B. BOURGEOIS, R.M. KOERNER, J. SEKERKA, E. OSTERBERG, M.B. ABBOTT, B.P. FINNEY and S.J. BURNS; STABLE ISOTOPE RECORDS FROM MOUNT LOGAN, ECLIPSE ICE CORES AND NEARBY JELLYBEAN LAKE.WATER CYCLE OF THE NORTH PACIFIC OVER 2000 YEARS AND OVER FIVE VERTICAL KILOMETRES: SUDDEN SHIFTS AND TROPICAL CONNECTIONS, Géographie physique et Quaternaire, 2004, vol. 58. url
Lonnie G. Thompson, Ellen Mosley-Thompson 2006. Glaciological evidence for abrupt climate change: past and present. NSIDC: An International Workshop: Antarctic Peninsula Climate Variability: Observations, Models, and Plans for IPY Research. ftp://sidads.colorado.edu/pub/ppp/IPY-APCV/LonnieThompsonWorkshop.pps


71 Comments
Not off topic but an minor expansion of one point: potassium in dust from China is credited with making plant life possible on Kauai in the Hawaiian islands.
Kauai is very rainy, which leaches out minerals. And famously green.
However, this has been going on for millions of years, not just in the 1960s.
I don’t have my reference to this handy, but if anyone cares I can look it up.
Surprise, surprise.
Not off topic but a minor expansion of one point: potassium in dust from China is credited with making plant life possible on Kauai in the Hawaiian islands.
Kauai is very rainy, which leaches out minerals. And famously green.
However, this has been going on for millions of years, not just in the 1960s.
I don’t have my reference to this handy, but if anyone cares I can look it up.
Note the careful phrasing here: “Decadally averaged ä18O histories demonstrate that the current warming at high elevations in mid- to low-latitudes is unprecedented…” Presumably, Alaska is high-latitude, so no statement is being made here about the Bona-Churchill results; they must be referring to other results here.
As much as anything, this reinforces your main point. The attitude seems to be, “The Bona-Churchill data don’t support the preferred narrative and/or our hypothesis that δ18O levels are a good temperature proxy, so we will simply refuse to draw conclusions from the data.”
Harry seems to be referring to this.
Chadwick
1999
Chadwick, O.A., L.A. Derry, P.M. Vitousek, B.M Huebert, and L.O. Hedin. Changing sources of nutrients during four million years of ecosystem development.
Nature 397: 491-497
Is 61 degrees considered mid-latitude?
If I remember rightly, Plinian refers to volcanic eruptions such as the one that overwhelmed Pompeii in AD 79. So there would have been an enormous ashcloud towering over Mount Churchill, which would have collapsed all over the local area.
So where is the evidence of the ashfall? It’s not in the core even though much more distant volcanic events are “recorded” in the ice core. Something is clearly wrong with the hypothesis.
There are clearly volcanic events recorded in the ice core record (including one in the 1500s that must have been close by).
As for the Thompson claims of “unprecedented” warming of the 20th Century, we’ll have to file them with the Mannian claims to robustness – under “I” for “Imaginary”
I would think that a more logical explanation for K in very fine ash form would be from burning firewood (and possibly forest fires, as well). This, of course, would have started long before the 20th century, but probably increased as the population in China, India, and Siberia increased. I don’t know whether to expect it to be on the increase or decrease currently.
Wood ash is very high in K (ever heard of potash?).
JohnA,
“Volcanic event” could just refer to rising magma that heated the ground, maybe even vented some steam, but did not result in an eruption that would have procudec large amounts of ash.
Steve McIntyre
please see my post #78 in unthreaded
http://www.climateaudit.org/?p=2335#comment-159965
Steve:
Is it worth another email to Thompson about Bona Churchill, now that you have some indication that the d18O results are somewhat at odds with his summary of the earlier ice cores.
Also, what does Fisher say? Surely he has been in contact and discussions with Thompson? His results appear to reinforce the lack of a temperature signal from the BC ice core.
The 1840 shift looks pretty dramatic. A good thing Gore was not around then!
MarkW: the eruption producing the White River Ash was described as “Plinian” – which refers to a specific type of volcanic event.
See this link at the USGS for more.
http://www.nsf.gov/awardsearch/showAward.do?AwardNumber=0099311
This one right. I havent been through the Grant requirements, I think you looked
at this is the past however, right?
#13 I notice that the grant period expired in 2006 – without any publication.
RE 14. I think the PM should probably get a letter.
I started to go through grant requirments but They have been changing almost biannually.
“So where is the evidence of the ashfall?”
It depends on where you look. There were two primary White River Ash (WRA) eruptions. During the first the wind was from the South causing a Northerly distribution while the winds were from the West during the second eruption causing a Easterly distribution of the tephra.
More information here.
Maybe the original notes said “last 200 years” and there was an error in transcription.
That’s not a hockey stick.
I play hockey and that is not used in my game.
That’s a pool cue.
Just depends on what end you look from.
I want to make sure I have this perfectly clear.
The actual observed data shows virtually zero difference between 19th and 20th century dO18 levels, and they are, in fact, lower than levels 500ish years ago, yet somehow this proves unprecedented warming over at least the last 2000 years?
Do I have that right?
Steve: This is not the only data in the presentation. It is excluded from Thompson’s composite.
Presentation implies that a MS is in press with PNAS. They should be fairly quick.
The reality is that, just as in the case of tree rings, d18O is something that can be measured apparently to a fairly high level of precision. However, it remains unclear what signals (and what noise) are contained in this measure. One can imagine all sorts of factors and interaction of factors influencing the level of d18O and based on other articles Thompson et al are aware of them. What is troubling is that Thompson (and Mann) appear to assume that temperature is the dominant signal. What the BC data shows in part is that this emphasis on the temperature signal results in problems for either the temperature record or the strength of the temperature signal.
Does anyone have any explanation for the apparent silence on the issues around the validity of this measure?
Again and again, the image that springs to mind is of the drunk looking for his car keys under the street light.
#20. This was a May 2006 presentation. Thompson PNAS 2006 icame out in the summer and doesn’t cover any of this information. No mention of Bona-C
More evidence of a warmer-than-today Holocene? This seems to go along with the evidence for an ice-free arctic around the same period.
What is the excuse from Thompson for not publishing the information? Surely if he has been given taxpayers money, someone is responsible for getting value for money. Maybe a politician should investigate?
Steve McI:
Did Fisher archive his data? The article does not seem to mention it. Does the Geological Survey of Canada make the data available??
Fisher also references a 2004 abstract from Thompson on the annual climate and environmental variability at Bona Churchill. Given the geographic proximity I assume that Fisher would have been interested in sharing detailed results. Wouldn’t Thompson have been equally interested in checking FIsher’s data? Curiouser and curiouser. Bernie
Steve: Fisher sent data to me when I requested it.
Crosspatch:
So why is there no evidence of ashfall directly below the mountain. Are the winds that strong in that part of Alaska?
I read in the glossary dO18 is change in ogygen isotope level. Is this being used as a proxy for warming? If so, then it seems the the Bona Churchill graph does not support the claim of warming in the 20th century as Steve stated. And in fact, I would think the most interesting period for a climatologist (should they value this information) would be the period from 1600 to 1750 where the dO18 deceases significantly before starting the gradual increase again.
#25
What does Fisher think of the Bona Churchill results? Will he discuss? The NH high altitude ice cores appear to be tracking – with both saying no temperature related signal.
Any clue or referneces as to the link between solar activity and d18O?
RE 24..
the grants may or may not require publication of the data. There is a requirement for ANNUAL REPORTS
which are given in accordance with a standard form and a FINAL report as well. There may be no
requirements to provide the data to the contracting agency. The actual award may spell this out.
The person that would know this would be the PM. The PM will side with Thompson since Thompsen has
made the PMs life meaningful.The PM may be able to decide that the source data is not important and
leave it under the control of the PI. I’m looking through the docs as I get time.
In simple terms that can be criticised, the production of oxygen isotope anomalies is commonly attributed to fractionation during evaporation of warm versus cold waters, then precipitation at the cold site being measured.
If the depositing winds can change direction (as is theorised by the absence of certain volcanic ash) then surely they can change from a warm water source to a cold water source. If they do this frequently, could this not remix the oxygen isotopes? Could this not produce a result close to null change? A valid inference is that the utility of ice core thermometry is site-specific and that quantitative comparisons from place to place on the globe are simply naive. As is the qualitative hypothesis for original evaporative fractionation, especially when it is turned into a quantitative proxy for temperature.
I agree with # 21 Bernie.
Re potassium levels in ice core. Essentially all plants need potassium at some level. There is enough potassium in most rock types to be non-limiting to growth in most places. Rocks weather in rain and air and make potassium available to plant roots. The potassium circulating in the atmosphere (major volcanic episodes excepted) would be expected to be both soluble and miniscule through precipitation in rain. It’s an observation that needs checking and it might lead to an advancement in Science, but not all goods are made in China yet.
Steve: the White Mt BCPs are typically in dolomite and I would presume very K-deficient. There’s nice picture showing a geological contact through the change in vegetation from BCP (dolomite) to big sagebrush (sandstone).
30, that’s correct. The amount of heavy water (D2O, D2O18, H2O18, etc.) is a function of the temperature where the water condensed. That could be a considerable distance from where it landed, especially if it’s snow. And it would strongly depend on the cloud hight. This seems like a pretty loose relationship. And that’s not even accounting for the fact that the amount in the atmosphere is a function of the temperature where it vaporized, which could be over a pretty wide area.
“So why is there no evidence of ashfall directly below the mountain. Are the winds that strong in that part of Alaska?”
No idea but there is evidence of ashfall in other areas relatively nearby. According to Thompson himself in this article, he says that the source of the ash much be someplace else because he got all the way down to where there was no ice on that mountain and found no ash.
Re #24 (Derek Tipp) and #29 (steven mosher).
There are rules about data availability, but there is no enforcement mechanism. For details of how the NSF non-enforces those rules, see
http://www.climateaudit.org/?p=1443
#32 Dr Thompson does not think like a geologist. He found granodiorite, presumably from uplifted deep-seated igneous intrusives penetrated by Mt Churchill, near the crater ie upslope from the ice mass. This could easily explain the presence of GD in the ice, down-slope and at the base of the ice, eroded from the original mass. The tephra from the ignimbrite would have been in the thousands of degrees when deposited on the ice. It was not preserved! It disappeared in the ensuing flood, as did Mt. St. Helens ashfall on the icefields. I would invoke Occam’s razor and suggest he look for the simple explaination.
Re # 30 and not all so important,
Of the three major plant nutrient elements N,P and K, P is commonly the most soluble and as such moves sometimes large dustances laterally in groundwater. It can limit the growth of plants but I cannot recall plants not growing at all because of K deficiency alone, though there will no doubt be occasional places where that will happen. Yes, you can see geobotanical changes with K deficiency, but the best visual examples are from P. Phosphate is usually comparatively insoluble in solis and rocks as you know.
If the K anomaly reported in the core is from wind-blown potassium fertiliser, then I would expect also an anomaly in phosphate, which should travel together from source but be more persistent than K. The phosphate anomaly would have a probability of association with a Ca anomaly on the micro scale, but there are other confounding Ca sources at macro scale.
Correction to # 35 line 1. K is the most soluble, not P. Typo. I type terribly. Also, Line 6, “solis” should be “soils”.
Apologies Geoff.
re 24:
It’s even dangerous. Did he split the cores and kept the other halves off site. If a tornado hits his freezer he can’t go back to kilimanjaro to get fresh ice because the ice is gone.
Therefore:
DR THOMPSON I URGE YOU TO PUBLICALLY ARCHIVE A COMPLETE DIGITAL ICECORE LOG, AS FREQUENTLY REQUESTED
Roger Dueck:
That would mean that there is something fundamentally wrong with the dating since Thompson claims that the ice field predates the last major eruption (c. 1250 years BP). If the ice field was hit by large amounts of hot ash and its not there now, then there much have been a large lahar which would have swept everything away from the mountain.
Does anyone think it perhaps more likely that data is withheld (or at least hidden) by scientists not because they are part of some big conspiracy, but because they wish to maintain exclusive access to that data for future papers and/or discoveries? It strikes me that the competitive nature of grant funding would be a very great incentive to keep original work to yourself, rather than to share it with other scientists.
Just a thought.
“…Does anyone think it perhaps more likely that data is withheld (or at least hidden) by scientists not because they are part of some big conspiracy, but because they wish to maintain exclusive access to that data for future papers and/or discoveries?…”
I think it more likely that they are ‘riding the tiger’. They did well out of pinning their reputations on the Global Warming hypothesis early, before it was able to be verified, and then the world’s media and politicians followed them. That left them ‘forced’ to keep the ball rolling.
There is now too much at stake to simply turn around and say ‘Whoops, I was wrong!’. Indeed, much of the push now is in media, political and commercial areas where scientists do not have much influence. All Mann et al can do is hang on tight, and hope that when the inevitable crash comes, people will be too busy blaming Gore, or trying to hide their own unthinking suport, to descend on those who started it.
If I were a ‘Warmist’ now, I would be trying to suppress any indication that I was wrong, and trying to get other people to join in supporting the thesis, while quietly saying a few things which could later be quoted to show that I didn’t ‘really’ support it unquestioningly….
#41 There are many mundane reasons why data sets don’t get rapidly used in publications. I’ve never met one that has anything to do with the conspiracy theories about being “found out” that are popular on this website. Some of the most common reasons include lack of manpower or unexpected difficulties with the data quality. My own research group operates a number of geophysical instruments. But even if they gather data, without funds to support students or post-docs to work on the data analysis progress will be very slow or may even stop. Tough, but that’s the way it is when university science is casualised and relies on students and contract pos-docs. Sometimes you get datasets which turn out to be much more difficult to work with than anticipated. Examples include interference causing deterioration in accuracy, instruments not working properly, human errors in making records etc – basically a mixture of human foul ups and the cussed nature of the real world. Often, useful work can still be extracted from these data sets, but it can be much harder work and decisions have to be made as to where to direct scarce resources. In my own work this has led to some instruments/grants producing much more output (papers) than others. But it’s nothing sinister. It’s just the way the game works.
Steve:
It seems like comments are being dropped or snipped even when they are on thread. Is there something up?
#40, Robison.
Well, yes and no. It only seems fair that if someone were to collect data they should be allowed first stab at analyzing it. No one wants to do field work only to be scooped by the guy who sat around at home. A reasonable non-disclosure period should be allowed. How much should depend on how long an analysis takes. Usually, 1 to 2 years in some disciplines.
#29, steven mosher
Yeah but unfortunately that sets up the current situation where it’s extremely difficult for anyone attempting replication. I can see how it happened though. At one time, climate was in the who-really-cares category and most of the research was only of interest to a very few.
Today, of course, things have changed. Now it’s imperative to know the quality and correctness of the work. It’s going to be hard to fix things. It may be too late. Even if a concerted effort to revisit old analyses were started (ala, M&M), there would be howls and accusations from both sides with vested interest in the outcome. And who would actually do it? There really is some specialized knowledge that would require cooperation from the paleoclimatologists.
But they’re very likely to see any revalidation as impugning their integrity (Yeah, I know this is going to generate a lot of smart-ass remarks but put yourself in their shoes, people, and ask how YOU would feel and react). Maybe, in the long run, Mann has really helped in this area because now it’s possible to point to his work and say “Look! Mistakes can and have been made! Let’s make sure there are no others. We really need to know.”
Bernie #43, Steve is the only editor I will accept. He deleted a comment of mine expressing concern for the reaction against science if and when AGW is exposed as a hoax.
===================================
I’ve moved various venting comments to Unthreaded. Why should a thread on Bona Churchill be used for extravagant claims about AGW motives – which I try to discourage in the first place.
#40. You’re conflating a couple of issue. I’ve never suggested that all data archiving failures pertain to “sinister” motives. Practically I think that most non-archiving is for proprietary reasons. However the U.S. climate change program has longstanding policies requiring researchers to promptly archive data. If present policies were enforced, I’d be fine with that.
The delay in publishing results is a different issue – distinguishing between archiving data and writing a journal article. In mining promotions, if promoters have good results, they find a way of getting them out fast; while they delay bad results hoping that they’ll get some good results. It’s human nature; but there are limits on the delay.
In the cases of Bona-Churchill and Sheep Mt, I believed that the authors would have fond a way to get the results into play if they had been “good” results and that, in these cases, the publishing delays were suspiciously long. I’m not saying this after the fact. I predicted “poor” results for both proxies a long time ago and my predictions are being vindicated.
You give a good reason why Sheep Mt and Bona Churchill haven’t been published. Or why Hughes didn’t use the updated Sheep Mt data in Salzer and Hughes.
This post should be perhaps transferred to Unthreaded but it starts from 2 posts on this thread and concerns a true question of audit I have no response to, perhaps of an ill formulated previous post.
Geoff S said in #30
In simple terms that can be criticised, the production of oxygen isotope anomalies is commonly attributed to fractionation during evaporation of warm versus cold waters, then precipitation at the cold site being measured.
And Larry in #31
30, thats correct. The amount of heavy water (D2O, D2O18, H2O18, etc.) is a function of the temperature where the water condensed.
These two positions are IMHO contradictory, but the second is the commonly admitted, though I think it is false. If it were true one would observe more heavy isotopes in ice during the cold period and this proxy should be for cold and frozen zones climate. Yet it is the contrary which is observed. So the stable isotopes deficits are proxies for evaporation zones, principally ocean surfaces (SST), a more global proxy indeed.
Congratulation for Steve and the Blog
This post should be perhaps transferred to Unthreaded but it starts from 2 posts on this thread and concerns a true question of audit I have no response to, perhaps of an ill formulated previous post.
Geoff S said in #30
In simple terms that can be criticised, the production of oxygen isotope anomalies is commonly attributed to fractionation during evaporation of warm versus cold waters, then precipitation at the cold site being measured.
And Larry in #31
30, thats correct. The amount of heavy water (D2O, D2O18, H2O18, etc.) is a function of the temperature where the water condensed.
These two positions are IMHO contradictory, but the second is the commonly admitted, though I think it is false. If it were true one would observe more heavy isotopes in ice during the cold period and this proxy should be for cold and frozen zones climate. Yet it is the contrary which is observed. So the stable isotopes deficits are proxies for evaporation zones, principally ocean surfaces (SST), a more global proxy indeed.
Congratulations for Steve and the Blog
I have no problem with editing out venting and speculations about motives, but my last comments raised what I thought were reasonable questions about the way ice core data can and should be aggregated together in a scientifically defensible manner – i.e., Is Thompson
chart that combines Peruvian and Tibetan data reasonable or is it cherry picking? If the isotope metric is subject to dramatically different mechanisms in different geographic locations then they should only be aggregated with great care, if at all, and with an explicit explanation as to why and how – kind of like bristle cone pines TRs. I am now reading the earlier threads which address this subject. It just seems that this thread naturally calls for a restatement of relevant major points from the earlier threads on the usefulness of d18O as a temperature proxy.
Steve: I moved it to the Gore Thermometer post where it belonged. What did it have to do with Bona Churchill? I move more than I delete.
DaveR says:
I am not a scientist, yet this seems like a strange “excuse” to me. At this point in time, archiving digital versions of “raw” data and making it available on-line is relatively trivial. I’m guessing that you’d want a digital copy in any case for ease of (your own) use, and while I certainly appreciate cost constraints in the actual analysis of the data, and even the desire to keep “interesting” (and difficult/costly to produce) data private until you can publish something on it, surely at some point – say 1-2 years after collection – you will have a good idea whether you will be spending the time and effort on that data. Given the trivial costs associated with making that sort of data publicly available, and the ethical obligation to provide data for replication of your papers (if any) based on this data, it seems extremely odd to me that Steve has been able to find a number of cases where such data is *not* archived publicly, even after 20 odd years!
Re #41 Dave R:
All very plausible Dave, and I am convinced that there are many reasons why data sets cannot be archived (some for 20 years). But surely you agree that if the data sets are not available, the work cannot be replicated, and therefore cannot be confirmed as sound science.
Scientists have a choice:
EITHER: Comply with sound scientific practice, particularly supporting proper data archiving, disclosure of methods etc, and have your work taken seriously.
OR: Fail to disclose date, methods. Obfuscate. Refuse to participate in rational discussion regarding their work. Refuse to support replication. The inevitable consequence of this approach (as I suspect Michael Mann, James Hansen and Phil Jones et al are rapidly finding out) is that your work will not (cannot) be taken seriously. That in turn must jeopardise continued access to grant funding as funding organisations come under pressure to enforce their rules relating to these matters.
Which camp do you want to align with Dave R?
DaveR,
If the reason why scientists are reluctant to archive data is because quality issues have been discovered with the data, then what does this say regarding the reports that were generated using this same data?
Work has to be replicable. It’s not. Why not? Because the data is not available. Why not? I can see not releasing it until your material is published, but after? No. 20 years after? Heck no.
But forget that even. The standards are that the data is made available. The people responsible for making that happen, for enforcing the rules, are not enforcing them. In fact, as far as I can tell, they are active in helping to keep it repressed. If the standards are there, that’s no random thing. That’s deliberate. Why are the standards there? Because if you can’t get it, it’s not science.
Do people interested in their reputations, science itself and the furthering knowledge act this way? Does it surprise them when they don’t do what’s required, people question their motives in the first place, much les when they are breaking the rules by not doing it? And even the people they work for are unconcerned about it?
There is no excuse for this. This is data making up published papers, not
Re #41 Dave R:
But when the results of these non-archived studies are being used as a blunt instrument to terrify the general public and as an excuse for massive changes in socioeconomic policy, then the “mundane” ceases to apply.
RE: #6
It is probably unlikely Professor Thompson would argue these, “ice cores from the col situated between Mt. Bona and Mt. Churchill (61o 24′ N, 141o 42′ W; 4420 m asl) in Wrangell-St Elias Mountains of southeastern Alaska,” are from a middle latitude location. But, it never hurts to ask.
Undergraduate geography textbooks usually define the middle latitudes as 35-55 degrees N and S, while the higher latitudes pole ward are referred to as the Subarctic/Subantartic (55-66.5 degrees N/S) and the Arctic/Antarctic (66.5-90 degrees N/S).
However, in biogeographic terms the designation “high latitude” may vary somewhat. For example, Mary Belle Allen, “High-Latitude Phytoplankton,” Annual Review of Ecology and Systematics, Vol. 2, (1971), pp. 261-276, notes that relative to the marine environment, 50 degrees S likely qualifies, but in the northern hemisphere 60 degrees or higher (depending on location) would be the appropriate designation. Regarding terrestrial biomes, the IGBP High Latitude Transects (University of Alaska, Fairbanks), which include locations in Siberia, Canada, Scandinavia, and Alaska, cover latitudes ranging from 52-71 degrees N (the Alaska transects range 60-71 N) http://picea.sel.uaf.edu/projects/igbp.html
Scientists can not have it both ways. If you want to use your data to influence public policy, then your data must be archived and you forsake any proprietary rights. That’s democracy. That’s accountability. That’s responsible government. Don’t like it? Leave it.
No, bender, they can (and do) have it both ways! 🙂
Hopefully what we’re doing changes that.
55, Hypothetically, what do you do in the case where the scientists don’t have any intent of influencing policy, but NGOs grab your work and use it to effect policy? Obviously, people like Mann and Hansen are out-of-the-closet activists, but I can see someone like Ababneh not wanting to dot all the i’s and cross all the t’s (per SOP for the field), and yet getting dragged into a kerfuffle by some group who grabs the research and uses it for policy purposes.
Maybe this is why the lawyers are getting involved.
Larry, those cases are usually so isolated and rarified as to be inconsequential. Individual cases of data abuse are unavoidable. It makes no sense to worry about them at a societal level. It’s an individual problem. It’s when the semi-science-based consensus-seeking policy juggernaut emerges that the solvable propietary/public IP problem crops up. No need splitting hairs. Design and enforce a disclosure policy that effectively regulates the juggernaut and all society will be better off.
I was interested to see Thompson’s slide of his class 100 clean room. Then I looked closely at the picture. Let me first put this into perspective. I have audited clean rooms professionally, consequently I have a reasonably good understanding of what items would cause problems in a clean room.
1. In that photo, you can see standard chairs. When you sit in a standard chair, air rushes out of the cushions. This air contains high evels of particles. There are special clean room chairs which do not spew out particles when someone sits on them.
2. Wood, standard paper, cardboard, and standard books are banned for clean rooms because they shed particles.
3. I have never seen a dot matrix printer in any clean room rated better than class 100,000. These printers are great particle generators.
This clean room may have been certified when it was built. I highly doubt that it would meet class 100 today with people working in it.
People use clean rooms to exclude particle contamination from sensitive products or from analytical samples. If a room is filled with particle generators, it is hardly a clean room.
I would be happy to audit Dr. Thompson’s clean room (for free), the next time that I am in Columbus.
SteveM
Ties in with the Bristlecone Pine growth spurt you are looking at?
Also if changes in wind patterns can have this dramatic effect on Temp Proxies, how can the effects be corrected for if at all?
Steve: NOte the change in dO18 values in bristlecones reported by Berkelhamer and Stott.
#49 Neil, Sometimes data sets need work before they are good enough to be archived and used by others. If it’s been used in a publiation, obviously it should be archived. But this thread is about a data set that was recorded in 2002 and then not used, or at least not used to produce a publication – quite different from one that’s been used in publications but not archived afterwards.
#50 Trevor, Again, this thread is about a data set that was recorded and not used in publication. I’m just saying that in my experience there are many reasons why data sets can prove to be more tricky to work with than expected. There’s no particular need to start attributing sinister motives to Thompson.
#51 Mark, As far as I know, Thompson has produced no reports from this data set. It seems to have been used in a conference presentation, but that’s it.
#53 Don, I don’t think even Thompson can terrify anyone with a non-existant publication.
Steve implied that lack of publictions from this data set is because Thompson is hiding it because it didn’t show what he (Thompson) wanted it to show. All I’m saying is that there are many less dramatic reasons why a data set may not lead to publication and may not be in a fit state to archive.
DaveR, there may indeed be less dramatic reasons, in theory, to explain it. The sheer uncooperativeness of so many that are creating the papers and doing the peer-review implys otherwise, but it’s possible.
However, when people have nothing to hide, and no ulterior motives, and are dedicated to science, , etc etc etc they usually give a reason why they’re doing something. They say
“Yeah, this data’s not archival quality, but if you want it, here. Just keep in mind that it’s pretty much junk, and you probably won’t find anything useful to do with it.”
You do that publically, difusing any possible stink over the quality ahead of time, because you have already set expectations and said it’s not very good. What can anybody say?
If you go to Real Climate, I forget which thread, it’s a long one, I seem to remember Gavin changing the reason they wouldn’t release the code about 5-10 times. Most were the lamest excuses I’ve seen in a while.
When they eventually released it, it became clear why; even with the many skillful programmers here; it doesn’t even look like it runs.
I think any doubts that exist here are warrented based upon past and current behavior.
I went to the OSU website (Thomson’s university), and found that another grad student was supposed to be using that same data for his thesis.
“In November 2003 David Urmann, a graduate student in the Department of Geological Sciences, will complete his Masters thesis entitled: An Evaluation and comparison of ice core data from Bona-Churchill and Quelccaya, and lake level data for the Western United States, Alaska and Peru as proxies of El Niño events during the last one hundred years.
David Urmann
Ph.D. Candidate
Dissertation topic: “A 1000-year record of ENSO and its response to climate”
M.S., Geological Sciences, The Ohio State University, 2004
Thesis Title: “ENSO and PDO variability in ice core and lake level records over the past century.”
B. S. Geology, Utah State University, 1997
email: urmann.1@osu.edu“
Maybe he can’t get access to the data…
Re. publically (sic): I don’t make the rules!
For a minute there, I thought we had something…
http://davidurmann.com/masters.htm
Website showing his Masters Thesis, comes back as file not found…
re: #65,
If you go to the Icecore Group you’ll see that he’s listed as a PhD. candidate and it gives his e-mail address if anyone is interested. Also of note is the picture of the group with Al Gore from back in 1994 before Mr. Urmann became a member of the group. I hope it doesn’t surprise anyone that Lonnie Thompson would display prominently a picture of them with Gore.
But I’m afraid that if we e-mail him, and ask him about the BC ice core data, we’ll get the same reply as we got from Linah Ababneh: requests are improper, and mention his getting advice from a lawyer.
The area listed as “data locations” on his thesis site (http://davidurmann.com/masters.htm) is showing as file not found.
Do we have any OSU alum that can visit the library there and see if his thesis is posted?
P.S. Doesnt surprise anyone about connection to Mr. Gore: Thompson and wife were advisors to AIT.
RE 59 Clean Room comments.
Hole punch on desk 25 dollars.
Used grocery bag under the desk functioning as a trash receptacle…priceless.
RE henry, #67 —
Last year, I checked Urmann’s master’s thesis, with its discussion of Bona Churchill, out of the OSU Geology Library and sent Steve a photocopy.
We haven’t heard from Steve about it, so I gather it wasn’t too informative for present purposes. I didn’t study it closely, but I didn’t see a table or even full-length graph of Bona Churchill d18O.
Nevertheless, Thompson has the data and NSF should insist he at least archive it. Perhaps Ellen Mosley-Thompson will write about it in her NAS inaugural article in PNAS??
RAB note: I do not doubt there is global climate change, but I do have a problem with the way the media and some “scientists” are justifying the cause to be in Man-made green house gases.
As a geological scientist in a different profession (minerals exploration) and having +40 years of field experience, I offer the following provocative issues:
1. The geological record for the rise and fall of sea level, as evidenced by beach strands in Nome, AK and elsewhere – this is a huge indication of dramatic climate changes where sea level has risen and fell by +200 meters….not a few inches or a few feet…. (I consider this effect to be related to a real “climate change”;
2. Incised channels of 20 to 50 meters deep in solid bedrock, well below current sea level (the top of which is 30 to 50 meters below sea level) in places like Susitna River and Lewis River, AK (also Ruby Creek and Limestone Creek in central Alaska);
3. Incision of these channels also portends a huge water flow from the hinter lands (greater than Niagara Falls) must be related to past very rapid temperature rise from a “global warming” – at a time well before Man made metal implements;
4. The retreat of Gulkana Glacier, AK in the period 1910 (Mendenhal)-1955 (Rose), and then in 1970 to 1972 (Richter, and by Blakestad);
5. Occurrence of 100 to +300 feet of “muck” (loess) in the age of wooly mammoths in central and northern Alaska – loess is a glacially-derived wind-blown sediment, suggesting a huge glacial melting event(s) during that era;
6. I do not see the data for NH4 (methane) anywhere in the discussion – but there are huge deposits of methane on the ocean floor – sea water interface; these must have been part of the ocean-atmosphere equilibrium set, that existed for perhaps tens of thousands – to hundreds of thousands of years; and
7. Arctic sea ice is melting… OK, what data is there that it has not completely disappeared in recent geological times (before Man made metal implements) a dozen of more times, or over longer geological times?
Re Thompson Bona Churchill core: Graduate student Urmann’s dissertation has now been posted at his personal website “in partial fulfillment of the requirements” with a more fulsome discussion on Bona Churchill including a complete time series of BC1. Data not linked as far as I could tell.
Click to access download.php
3 Trackbacks
[…] showing that Bona-Churchill delO18 did, in fact, go the “wrong way” as reported at CA here. So in case, Caspar Ammann PI didn’t report to Loso on Lonnie Thompson’s ice core, Loso […]
[…] See, for example, IPCC and the Dunde Variations, Juckes, Yang, Thompson and PNAS: Guliya, Gleanings on Bona Churchill, and Mann on Irreproducible Results in Thompson (PNAS […]
[…] https://climateaudit.org/2007/11/12/gleanings-on-bona-churchill/ […]