This post contains an important calculation, which will affect the many multiproxy studies in which Graybill bristlecone chronologies impact results either directly or via Mann’s PC1.
Hans Erren has digitized the data from the Ababneh Thesis. In Figure 1 below, I’ve shown the difference between the updated Sheep Mountain chronology and the Graybill chronology. The difference is profound. The Ababneh chronology obviously doesn’t show the tremendous 19th and 20th century growth pulse of the Graybill chronology, leading one to wonder whether the entire effort to “explain” the Graybill pulse through CO2 fertilization is misplaced – and whether some effort should be placed on examined details of how Graybill’s chronologies were calculated (something that we’re thinking about in connection with Almagre.) The number of cores in the Ababneh study (100) is much higher than the number of archived Graybill cores for Sheep Mountain.
How could such a difference occur? This is nowhere discussed in the Ababneh thesis, which is too bad. You’d think that she’d have been required to reconcile her results to Graybiull’s, but she doesn’t even mention Graybill’s results (though she does compare her results to an even earlier chronology said to derive from Lamarche, which doesn’t match the archived version.) So inquiring minds are left with what’s really a rather major mystery – and one that surely deserves an explanation given the reliance on Graybill chronologies in so many important studies.
Figure 1. Sheep Mountain (Bristlecone) Chronologies Black – Ababneh 2006; red – Graybill 1987.
The Sheep Mountain chronology is not merely an incidental nit in Team studies. It was the most heavily weighted series in the MBH98 PC1. We mentioned it in our first Nature submission in 2004 here without then realizing that it was a Graybill-Idso bristlecone pine site – at the time, we merely realized that it was weighted 390 times more heavily than the least weighted series in the MBH98 PC1. It is also the most weighted in the MBH99 PC1 and in the Mann and Jones 2003 PC1.
The Ababneh Sheep Mountain chronology only goes back to the mid-12th century. In order to assess the impact of the update on the Mann and Jones 2003 PC1, I spliced the Ababneh chronology post 1121 with the Graybill chronology prior to 1121 (and the two are within a good enough synch at that time to justify the splice for a first-cut analysis.) I then calculated a PC1 using the correlation matrix (not the Mannian method) and obtained the following PC1 (using the 6 sites in the Mann and Jones 2003 network).
Figure 2. PC1s from the Mann and Jones 2003 AD200 Network.
The weights in this calculation are far more balanced than in the original MBH calculation. I note that I’ve been able to replicate the Mann and Jones 2003 PC1 to five 9s accuracy (prior to Mann splicing it) so I’m 100% certain that we’re talking apples and apples in terms of network.
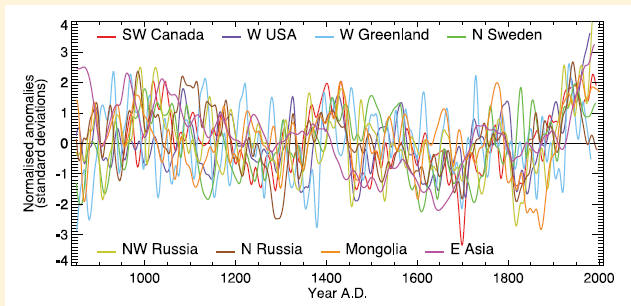
The Mann and Jones 2003 PC1 was not merely an important contributor to the very small Mann and Jones 2003 network, but was used in the (also small) Osborn and Briffa 2006 and Hegerl et al 2006 networks and even illustrated in IPCC AR4 as shown below (see the uptrending “W USA” series.
I’ll look at its effect on the MBH99 PC1 at some point, although this assessment is complicated by the fact the MBH AD1000 is still dominated by Graybill chronologies, most of which haven’t been updated, and the ones that have (San Francisco Peaks, Pearl Peak) haven’t been archived. Given the profound impact of using the Ababneh data on the Mann and Jones 2003 PC1, one does wonder even more at the failure of her colleague and thesis reviewer (Hughes) to use this updated data in Salzer and Hughes 2006, where he used Sheep Mountain in the now obsolete Graybill version.
Reference: Ababneh, L (2006). Ph.D Thesis, University of Arizona http://www.geo.arizona.edu/Antevs/Theses/AbabnehDissertation.pdf


85 Comments
And so the Hockeystick ends; not in a bang, but in a whimper.
I swear I see about a 50-year cycle in that data.
3, you don’t need to make subjective judgments. A Fourier transform will confirm or deny that unambiguously.
As for the squigglegram, all bets are off.
I am a total novice on climatology but I have been reading your blog for awhile now. I don’t know if this is the right place to ask but here I go. All these tree ring proxies depend on how fast the trees grow which is related to several factors including temperature and atmospheric CO2 concentration. We know that there is more CO2 in the air so couldn’t this extra CO2 cause the trees to grow faster in the 20th century even if the temperature hasn’t gone up? Wouldn’t this make the proxies seem like today is much warmer when in fact only the COS level is higher?
re: #5 Jackson,
Yes, that’s precisely what Graybill and Idso were looking for when they first took cores of the Bristlecone Pines. They were trying to find pines which were limited by CO2 rather than, say, water. They didn’t find much, apparently. Later the Dendroclimatologists thought their data would be peachy for measuring temperatures. We don’t think THEY found much either.
Ref 5 Jackson, I think it is better to think optimum watering, soil nutrients, sunlight competition, then wander off into CO2 and temperature. They are trees. If Wedgeman had the strip bark data and blown of the CO2 fertilization theory, his paper would have had much more weight.
Steve,
I was wondering about the apparent growth pulse in Graybill’s data. Is it possible for you to redo the graph and mark where the year 1883 is?
Reading the Nov 11 issue of the Grand Forks Herald in the restaurant. There is an article about what if anything they should do in a park in South Africa where they say the CO2 is causing trees and brush to take over the Savannah.
This post is NOT about CO2 fertilization – please post on such topics on another thread.
ref 7 John A. Why? Tree rings indicate one thing, growing conditions. In good years they grow more in bad years they grow less. Period. They are a good indication of drought. Even there, they are not perfect for drought because too much rain is bad for any plant. You can use isotopes, but don’t they depend on rainfall?
There are temperature dependent animals and microbes. The Sargasso Sea study Steve referenced a while back for example. Where you can reduce rainfall influence, you have a better chance of finding a valid thermometer for proxies.
Just look at the Sheep Mountain resent results and think what would have happened during the MWP with lower rainfall? You end up with a FIIK proxy.
Validity is the thing. Not if some small blip fits your agenda, it has to work all the way.
Readers will note that Steve’s prediction was, yet again, correct: the suppressed data was unfavorable to the hypothesis. Where’s Rabbett, Bloom, Dano, Boris et al. on this thread? Where’s Wilson, Wilmking & Juckes? This is damning stuff.
If you look at figure 1 from the divergence point, mid to late 19th century, you see that every peak in one data set has a match in the other, every trough in one has a match in the other. Every spike up and every spike down as well. Either the Ababneh data is compressed from that point or the Graybill is expanded somehow. One of them is clearly showing a treatment artifact of some kind, and I know where my guess lies.
bender, note the presaging of this problem with the discrepancy between Graybill and Woodhouse records at Niwot Ridge.
http://www.climateaudit.org/?p=624
http://www.climateaudit.org/?p=623
Also a note here that I’d forgotten about on the Churchill chronology of Jacoby that is problematic.
http://www.climateaudit.org/?p=625
We noticed that kind of dilation in Almagre TRee 31 which we discussed a while ago. When very old trees suddenly start having 3 sigma growth pulses, it’s not because of a couple degrees change in temperature; it’s because of something else going on. Graybill has specifically stated that he was seeking out strip bark and we know that Graybill’s archive is incomplete from Almagre – where we found tagged trees that hadn’t been archived.
We also know that dendrochronology has built up some very questionable practices in terms of non-archiving and non-reporting of adverse information. My guess is that Graybill has picked out growth pulse trees – and that’s what’s caused the bulge. You don’t need to do this for too many cores to get a Graybill-type chronology.
Seen it a thousand times. Nonstationarity. Departure from the uniformitarian principle. No good for building master chronologies. Too loaded with extraneous signal. Junk. Archive it, but don’t use it.
Thanks to Hans Erren for taking the time to digitize these data.
I can’t wait to see some more updates.
Steve M, could you plot 95% confidence intervals around the mean chronologies? i.e. x ± t.statistic*std.dev/sqrt(n)
I want some idea of the sample size and variability in the Graybill vs. Ababneh samples, esp. during the divergence period.
Just when I’d think that it’s all known, nothing else to be found, Steve M., you find another gaping pit. The whole hockeystick shape of the Mann and Jones 2003 AD200 Network rests on one single solitary group of trees? What kind of analysis is that?
And it’s studies like this that supposedly validate and verify MBH 98 and 99? I feel like the rube at the circus going “that’s it??”
One substantive thought I had (the only one to date on this issue, I fear) is that the question of how “robust” a reconstruction is is not easy to quantify. The normal procedure is to pull out and replace the proxies one at a time, and look at the results. Which makes sense on the face of it, and kinda works.
The complication arises through the procedure you have used. Rather than extracting a series, you are replacing a series with another series. In this case, they are closely related series. In this case the switch made a huge difference in the PC1. And that difference is quite unlike what happens when the series is simply extracted.
The thought I had was that a reasonable test would be to replace a series with a straight line, and see what happens to the correlation or PC1, as the case may be. A meaningful signal has got to beat a straight line in explanatory power, I reckon. A necessary but not sufficient criteria for a meaningful signal.
Now, I just gotta step back and admire the size of the hole you just blew in Mann 2003 …
w.
w.
Steve, this is amazing stuff. Not only the data and analysis, but your observation that “This is nowhere discussed in the Ababneh thesis, which is too bad.”
It is worse than bad. Any half-competent external examiner for her doctorate would have hauled her and her supervisory team over the coals for not discussing and relating her work to the most important previous work in the area (quite literally), the Graybill chronology. But, of course, look at the names on the supervisory and external examiner team.
I smell a cover-up
#re 19, Willis -you just don’t get it do you? “The whole hockeystick shape of the Mann and Jones 2003 AD200 Network rests on one single solitary group of trees”.
Don’t you realise that this group of trees represents the “sweet spot” that, by telleconnections, is uniquely senistive to Global temperatures?
physics experiment class 101:
do experiment
compare with previous results
discuss differences
This needs to be published, even if it’s not Steve, someone should write a paper (ofc. with Steve as a coauthor in that case) discussing this important omission from the Ababneh thesis. This becomes so much more valuable as ammo against “warmers” if it’s publisned in a peer reviewed journal, since there are still lots of people out there still suffering from the delusion that anything peer reviewed is soooo much more worth.
A good writeup of this would thoroughly demolish a lot of the dendro AGW stuff out there.
I really like the irony in the term ‘Sheep Mountain’. A title for the chronicles.
==============================
Any response from the hokey team yet?
In building scales in surveys, Cronbach’s coefficient-alpha is used to represent the item-intercorrelation for particular questions. Couldn’t you use the same statistic for assessing the integrity of the set of proxies, treating years
as the cases? The standard report out provides the Cronbach aplha when you drop a single item.
I’ve posted the data from the ababneh digitiziation in the directory http://data.climateaudit.org/data/mbh99/ also the Graybill chronology as ca534.crn.tab (also locatable at ncdc.noaa.gov/paleo/ in Tucson form at ftp://ftp.ncdc.noaa.gov/pub/data/paleo/treering/chronologies/northamerica/usa/ca534.crn
Has anyone read the conclusions in her thesis?
Which of Ababneh’s trees are depicted in Figure 1? Both strip bark and whole bark?
Do you mean the conclusions on page 73 or on page 96? I know, dumb question, but don’t miss p. 96.
=============================================
I was speaking of page 73, but 96 should also be noted. Now I need to go back and read the whole thing.
#28. I believe that both are included in the chronology shown here.
Nothing on Real Climate either.
Yet another fantastic piece of work, Steve.
One of the comments made at the Team site is **The recent DArrigo paper has a few more that also demonstrate the same thing, and O&Bs result is robust to the removal of any three of the proxies**. I am not familiar with the amount that can be played with. However I expect some garbled responses may be made to any quuestions there.
#18/#20 Willis is right to be shocked at this outcome. It means that the trees themselves are not the real problem here, but the people who sampled them and then sifted through them post-hoc in search of a fit to a particular “signal”. You may have suspected it before, but this is PROOF: the chronologies selected by MBH are not statistically representative of bcps as a population. That is major.
http://wc.arizona.edu/~wildcat/papers/90/85/08_1_m.html
before commenting on the Ababneh paper, please ask yourself this question:
if i had written my Ph.D Thesis last year, would i want this comment on it on an internet site?
this goes for both sides, btw.
I thought this has been obvious for a LONG time.
Interestingly, the Ababneh series shows three periods of better growth conditions than now between 1300 and 1600. We don’t even have “the best BCP growth conditions in 1000 years”. Murray
36 sod says:
The same goes for the Grad student at Ohio State who’s doing his Master’s thesis, using the Bona-Churchill data. So far, with what we can find, that particular piece of data doesn’t match the rest of Thompson’s core data. It questions the fact that 18-O is a global temperature proxy.
Re #37
No, this is news. This is why we were clamoring to “update the proxies”. NAS said that the bcps, especially stripbarks shouldn’t be used. But the problem is not the samples, it’s the samplers. NAS served to shift the blame from the people to the trees. These data shift the focus right back where it belongs.
FWIW, the strip barks in Ababnehs thesis do show higher growth comparable to the Graybill series.
38 Murray Duffin says:
November 15th, 2007 at 8:35 am
You may also wish to note that a number of the dendrochronological publications ranging from Schulman’s pioneering works in 1944 to the most recent reconstructions by Cook, Woodhouse, and others report the 20th-21st Century period as the wettest in the past 400 years in the Colorado River basin, and they report decadal droughts longer and drier than anything experienced in the past century. The time period corresponding to the Medieval Warm Period (MWP) corresponds to an increased frequency and severity of droughts. In particular, the period 1127 to 1177 is reported to have had only 9 years in which a relative drought was not in occurrence.
Consequently, we don’t even have a record on droughts and related warm climates in the recent past when compared to the historical millenia.
40: I was just referring to public statements from famous scientists, like “You have to pick cherries if you are going to make a cherry pie,” and (paraphrased) “A big advantage in dendrology is that you can select the trees that show the proper signal.” Also, tree ring data for many trees is not archived. I guess I just always assumed (I know, dangerous word) that if you are going to cherry pick your chronologies, you are also going to cherry pick the trees in that chronology.
Steve,
This is good analysis. Not sure if ‘science’ is the correct term for what you do, but ‘statistical analysis’ is of course a valid adjunct to reconstructions such as MBH99.
I understand that these findings call into question the accuracy of the proxy reconstructions, and thus the robustness of their conclusions regarding past climate.
Would it be correct to state that these new findings are relevant only to studies which rely on bristlecone pine for proxy reconstructions?
In other words, the instrument record is not affected. There is still much to determine with regard to the accuracy of the instrument record, of course, but that is a separate issue.
Yes?
#42
The US Supreme Court used a thirty year normal (1931 = 1960) of precipitation to determine the flow in the Colorado River. They were trying to apportion water among competing demands from States including some outside the drainage Basin. In a documentary for TV it was noted by a dendrochronologist sitting in a boat, I believe on Lake Powell the artificial lake designed to control water between the upper and lower basin states, that the tree ring record showed they had chosen the wettest thirty years in I believe it was 500 years.
The movie claimed one reason the Colorado didn’t reach the ocean anymore was because the Supreme Court had apportioned 110% of the actual long term flow and withdrawals removed virtually all the water by the time it reached the Mexican border. It was also claimed the only flow beyond that point was contaminated water returned to the river from irrigated fields in the Imperial Valley. As I recall the numbers given were an annual flow of 11 million acre feet but the court had apportioned 13 million acre feet. The dendrochronologist? Gordon Jacoby – the film? “Where did the Colorado go?”
#14
I’ve been following along on here for 6 or 8 months, and because of my lack of scientific and mathematics background I struggle from time to time(understatement). However I thought that Graybills tree ring data ended in the 1980’s. Help layman brother out. How is this graphed out into the 2000’s
Keypunched by sod (namesake “Seed_Of_Doubt-Iraq.blogspot”):
Complaints such as mine regarding grammar, IMO, fall along the lines of ‘getting a shave and a haircut’ and looking presentable and representing oneself well in a public setting; demonstrating basic low-level competency in the use of the language as well as showing some modicum of respect for the host (Steve – it’s his blog in this case) and those one is addressing.
I can’t say, either, that the above quote is lent really ANY credibility by being penned in all lower case either – and that would be for either side BTW. I also have to say it also looks bad on this site (or any site for that matter) to continually see this flagrant violation of grammar; to that end, I would recommend for remediation/review the following in the use of capital letters:
“The Owl at Purdue” – A Little Help with Capitals: http://owl.english.purdue.edu/owl/resource/592/01/
Here’s the issue: Plot (correct) “global” temp against CH4:
Yes. Publish it!!!
If the case is as strong as commenters here believe it is, it should be formally reviewed by those in the field. Write it up. For the conspiratorial-minded that think peer review for this won’t be worth it, submit it anyway. Either way…you’ll have a nice succinct argument and you will gain through the process. Submit your results and conclusions. Just do it. 🙂
I’m interested to see how this turns out with your own recent tree-coring adventure. Looking forward to it!
Steve, have you (or anyone) contacted Dr. Ababneh, and/or copied her with your results? She’s likely planning to publish parts of her dissertation; it wouldn’t hurt to point out the implications of her research.
Worth a shot, and an independent publication would be valuable. These sorts of things eventually self-correct.
Cheers — Pete Tillman
Peter D. Tillman says:
Along that same line, she might consider allowing you to review her data or even make you a “co-author”, since you are also having trees cored and analyzed, and you may even offer her your data to point out things she never considered about her original data.
Steve as a co-author on a BCP study – that would be priceless. I can imagine the peer review process there. The other blogs would likely implode…
Pete, as I recall,Steve has attempted to contact, but Ababneh’s lawyers advised her not to have any contact with Steve at all.
But, at the same time, she was reluctant to release or archive her data. How did Steve get the data?
Hans Erren digitised it from the graphs in the thesis.
Stve-
This is the best piece of auditing I’ve seen since the Bre-X cores were analysed. That Hocky stick has been one tough cockroach to stomp out. I think you finally applied the sledgehammer. Thank you.
Re #53, “…but Ababnehs lawyers advised her not to have any contact with Steve at all.”
Grad students now have lawyers to defend their thesis?
Re: 53
Thanks, Matt. Here’s the cross-reference: http://www.climateaudit.org/?p=2310#comments
— comment #18. Sigh.
FWIW, I’ll send her a polite email with the address of this thread, as I have connections to both UA and W&M.
Cheers — Pete Tillman
Isn’t tenure supposed to give you balls.
Grad students aren’t tenured.
Grand students get lawyer’s advice because their thesis advisers want to avoid exposure. I don’t think they have the law on their side, though. All they can do is drag their feet.
And if they contest the digitization that Hans did, well, the only to do that is to cough up the data. Another well-painted corner.
I honestly think the issue is not with Ms Ababneh. I can think of many reasons why a young nonWestern professional would not want to be in the headlines.
Steve,
I noticed something missing with this chart, why are there no tree ring data from the Southern Hemisphere? If and that’s a big IF, tree rings can inferentially signal atmospheric temperature or CO2 or rainfall or whatever one wishes to ascribe to them, shouldn’t there be a “representative” sample from Southern Hemisphere included in order to come with a “global” chart??? Are there any tree ring series from the Southern Hemisphere at all? I say this since it seems by some accounts that the Southern Hemisphere has not indicated a warming trend which means there is only Northern Hemispheric warming, not Global warming.
Why are some people so desperate for each new finding to be the “death knell” for this or that AGW theory?
Aren’t we all simply interested in the truth, wherever it may lead us?
🙂
Hi there,
I’m curious of
how many studies or papers actually depends (to a significant degree) on the Mann Greybill series and/or derivates(PCs)?
Is there a list?
Steve: Look at the post entitled the Return of Chucky http://www.climateaudit.org/?p=2245
Aside from all this being published in a peer reviewed journal, I’d like to see Steve M write a book – I’m sure there would be no problem finding a publisher, and it would be a best seller for sure.
64, this isn’t about AGW theory, it’s about the hockey stick. MM 2003 should have been the end of that, but it keeps coming back from the dead, even if under the name of Thompson. So we have to kill it again. The real question is, why does RC insist on making a zombie of the hockey stick? How many deaths are required before it finally dies?
#66, Paul Biggs says “Aside from all this being published in a peer reviewed journal, Id like to see Steve M write a book.”
Yes and also full length documentary film and DVD boxed gift set.
Just kidding!
How about a script?
For the anti – AIT movie I am planning featuring Fred Thompson.
re 60. Not talking about her.
But if I were talking about her, I do believe she is a Dr.
Can you imagine the uproar if a female scientist were sacked for sharing data that just happened
to expose Pennstate mann.
That’s the kinda fight you dream of if you’re moshpit.
“The night of the living dead”
“The return of the living dead”
“The night the last zombie was killed”
Has anyone coined the term ‘creative selection’ yet?
Thank you for the work Steve.
RE 64.
Hi walt. Here at CA most regulars know that no single piece of data will take down a Zombie
Theory. Especially when it guarded by a Phalynx of Pennstate men armed with hokey sticks.
That is probably right…and would be a good idea. But, results should also be written up for a journal. If they can’t defend against this, then it should be no problem. If it’s not accepted or even considered, then you can get into the nitty-gritty from there with the journal editors. In the meantime, you have a succcint analysis with conclusions for all to see. The popular book/DVD can come later.
73, picturing an army of flying Pennstate Manns marching and chanting “o-wee-o wee-OO-oo”.
73
I thought the Hokey sticks were in Blacksburg, VA, not State College, PA.
Sorry – no can do. The WGA and writers are on strike!!!
PS. Almost typed in “AGW” out of habit 🙂
Walt Bennett says:
November 15th, 2007 at 3:03 pm
Because too many manifestations of the AGW theory predict a “death knell” for civilization if their demands for radical societal change are not met.
Why shouldn’t skeptics celebrate if the science that predicts imminent catastrophe caused by everyday human activity is found wanting?
Steve M and Bender I think that pk is right in urging caution in comparing any mixed sample to a Graybill (heavily splitbark) sample. The apples to apples comparisons are between the Ababneh sb and the Ababneh nsb or between the Ababneh sb and the Graybill data. The blended Ababneh data would be expected to have smaller second or third moments than Graybill or Ababneh sb data. I don’t understand how any balanced series can be considered an update to the Greabill supervariance series.
Maybe a balanced series is a more appropriate choice for a reconstruction than a supervariance series, but that’s a different question.
Sorry if the story is equally clear in the A. sb to Graybill comparisons. Those are not presented here and I haven’t built those. But the top article is apples to oranges. There is something really interesting going on, but nothing that can be shown to be wrong n one step.
Yes, appropriateness of choice. A key phrase.
===========================
johnlichtenstein, while it’s not apples to apples Ababneh did find that the Sheep Mountain whole barks provided the best correlation (although not a strong correlation) of the four with local precipitation and temperature (Appendix II). So in the end, they really are the trees that should be compared with the Graybill series since it was used as a temperature proxy by Mann.
Re: #78
Thank you for the honest reply.
I’ll deal with doomsday scenarios separately. I”m just here for the science.
I will say that the belief that a piece of evidence somehow supports something that it does not, simply so one can sleep better, sounds a bit like hysteria.
22 49 74: Yes, Steve, you should write this up, concisely as a short note focusing on the facts without any criticism of any individuals. Send it to a modest journal (not Nature! – maybe your favourite CPD?) and post it on a preprint archive. This would really not be much effort for you after the work you have already done.
45 Tim Ball says:
November 15th, 2007 at 10:42 am
Yes, to put it mildly, the waters of the Colorado River have been grossly overallocated because the original streamflow estimates failed to recognize that the Colorado River was experiencing its largest streamflows in centuries at the time it was initially measured. The Colorado River Compact of 1922 and some later treaties allocated 16.5 MAF or 17.5 MAF (million acre feet) of water between the upper river basin and the lower river basin, depending upon how the treaties are interpreted. Each river basin, upper and lower was to receive half of the 16.5 MAF, and the other 1 MAF was in dispute. These allocations were made based upon the 20 year average of 16.4 MAF of streamflow at Lee’s Ferry, Arizona in 1922. Subsequent measurements have averaged around 15.1 MAF, which meant the Compact of 1922 had seriously overallocated the water when compared to subsequent streamflow experience.
Later dendrochronological studies and reconstructions have reported much lower average streamflows ranging from as little as 13.0 MAF to as high as 14.7 MAF over time periods of 500 years to more than 1,200 years. These reports also describe low streamflows during the late 16th Century mega-drought resulting in as little as 9.1 to 12.9 MAF of water. To say the least, the initial failure to recognize the exceptional streamflows existing at the beginning of the 20th Century resulted in an entirely unrealistic and unreasonable treaty allocation of the water.
One source for this information is from the Website for the Colorado River Streamflow: A Paleo Perspective; Western Water Assessment, NOAA. This source describes the advent of dendrochronology, and it describes a number of related publications.
58 Peter D. Tillman says:
November 15th, 2007 at 1:24 pm
Ms. Ababneh received Steve McIntyre’s original e-mail/s, knows about Climate Audit and the thread/s concerning her thesis, and indicated she does not want to be contacted about it. Sorry, but she has made it very clear that she is not receptive to inquiries from the CA community about her thesis.