Here is a script for collating Loehle proxies into an R-list in which each item is a table with two columns – one the AD year and the other the temperature (except for Holmgren where it is a native value as temperatures were not estimated in the underlying article.) This has not been coordinated with Craig Loehle (who’s undertaken to send me his values as used) so it will be instructive to see how close I’ve come to replicating his data as used.
I’m going to write a longer post on this, but I do wish to note that I’ve done quite a few calculations over the past couple of years showing how slight changes in proxy selection alter medieval-modern relationships, mostly focusing on the impact of bristlecones and foxtails, Yamal and the Arabian Sea G Bulloides. Typically I’ve observed that these variations cannot be distinguished from the canonical versions in the calibration period.
One such example is shown below for Briffa 2000, where using the Polar Urals Update instead of the Yamal series (substituted by Briffa instead of using the updated Polar Urals information) altered the medieval-modern relationship. (A virtually identical result applies to the medieval network of D’Arrigo et al 2006 which is nearly identical to Briffa 2000.) You can see that any verification statistics that apply for one variation will apply to the other and thus, inspection of verificaiton statistics will not enable anyone to determine which recon is “better”.
Figure 1. Briffa 2000-type reconstruction: black – canonical version; red- using Polar Urals update instead of Yamal.
I’ve done numerous similar variations – for Moberg, Esper, Jones et al 1998 and, of course, for MBH98-99, all with similar results. Slight variations yield different medieval-modern relationships, often with indistinguishable verification statistics (including similar problems.) Someone inquired about our apple-picking calculation presented to NAS. Here’s a plot of our apple picking version together with the Loehle recon in similar format. A number of the selections are in common: Sargasso, Conroy, Yang, Mangini; and the GRIP borehole and Cuffey recon have much commonality.

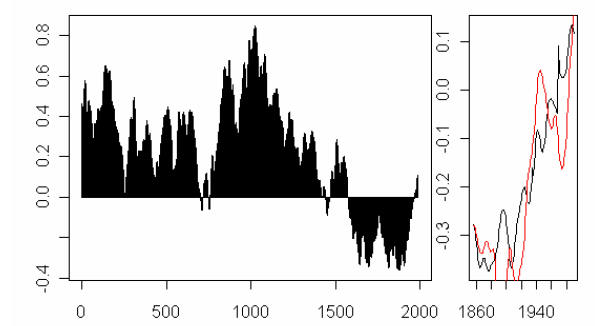
Top – Apple picking recon; bottom – Loehle recon.
Here’s a quick plot of the series used in Loehle 2007. I’ll update when I get digital versions from Craig.


56 Comments
surely there is a case here for a publication ?
if you make the case that selection of proxies can yield vastly differing reconstructions, where the verification statistics are uninformative for differentiating between these reconstructions, surely you can use that information to make a case that the proxy selection process is a key determinant ?
per
I think you have spliced foram-transfer function derived SSTs onto the alkenone record for MD952011 (Calvo).
#1. Perhaps so. The point actually has been “published” in my comments on Juckes at CPD.
With the exception of the Finnish lake, which remains on Steve’s hard drive, I’ve looked at the date estimated for the last data point for each proxy.
sapply(proxy,function(b)max(b$year[!is.na(b$t)])))
GRIP 1996
conroy 1968
chesapeake 1995
sargasso 1985
caribbean 1950
shihua 1985
yang 1990
holmgren 1996
demonocal 1862
farmer 1950
calvo 1947
stott1 1936
stott2 1810
viau 1950
ge 1995
kim 1940
mangini 1935
Half of the series don’t have any data after 1950.
Hello Steve,
the TSUOLBMAJAVRI proxy (#6) is not available online. The script you provided referrs to a lokal file:
url
Newbie Q:
The data end in 1995, but why does the smoothed series end in 1980? I assumed at first that Craig used a centered MA, putting the last smoothed point precisely at 1985. But then I read where he used a running mean (i.e., looking backwrards).
Something to do with #4 above?
Joel,
I was under impression that “moving average” = “running mean”
ouch, this is bad.
i had made multiple comments on this in the other discussion. actually i was laughed at a lot.
seriously, i didn t expect the problem to be this BAD.
take a hockey stick. saw of the blade. take measurements and notice, that it doesn t have a blade.
weird science, i d say.
I don’t know if ending in 1950 is much more of a problem than ending in 1980 (i.e. MBH). Not much happened to the surface record in that period, anyway. It was kind of the doldrums.
sorry, but many people posting here seem to believe that a parking space next to some of the thermometers is messing up all our data.
now you don t see a problem when Craig tries to give an estimate of 1995 data, by looking at 1810?
1810???
Sod,
Please focus on the handle, not the blade. The data is what it is.
Re #8, sod
The important argument is not about the blade; it is about whether the handle is straight.
sod:
The station data and the proxies are two separate and independent issues. The blade and the stick are two separable issues. I cannot for the life of me understand why you are being so obtuse – unless you simply — no, nevermind.
sod, it’s this simple: go look at ANY proxy study and you will find a common issue: either bad data (strip bark etc etc) or out of date data.
Why do you think we went to resample BCP’s?
Your argument is NOT with this paper, it’s with proxies in general.
Today’s reality: either accept proxy studies, with their older data, or avoid proxies in favor of the temp record. But if you require up-to-date data, you’re gonna have a problem going back 2000 years, let alone more than 2000 years.
Let me rephrase #6 to simply: Is Craig using a centered moving average?
As I said in the Loehle’s paper discussion, he made a major mistake to include that last paragraph of the paper and even mention that 20th century temps are not special. His data is not good enough to make that sort of conclusion and it is only speculation. Now, sod type of people are only picking that part and has lost the main point of the paper. Lots of hand-waving going on right now.
16 Joel,
This was clarified by Craig here:
http://www.climateaudit.org/?p=2380#comment-161863
Re #17 and others speculating on MWP vs CWP,
My hunch is that once the error bars are correctly calculated what you will find is there is insufficient evidence to conclude there is a “significant” difference between the two time periods: MWP, CWP. The problem will be the size of the error bars. And what we will be left with is uncertainty, wishing we had better data. Just a hunch.
Dr Loehle, the reason I did not recognize your bootstrap resampling method as such is because your resamples are not subject to random error. You randomly leave some out, but my bone of contention is with how much error there is in the proxies themselves. You might argue that this kind of approach to bootstrap resampling/confidence interval estimation is “beyond the scope of the study” and an Editor might agree, and I even empathize for the purposes of an EE publication. But it would be a very nice topic for a different journal where the editors & audience care deeply about methodological issues, sampling error, and robust statistical inference.
My advice would be, as I’ve said many times in other contexts, get a real statistican as a collaborator. Somebody like a Wegman. The guy pounds Team junk to pulp.
By the way, dating errors in the x-direction are not irrelevant if what you are interested in comparing are likely rates of warming during the lead-in to MWP, CWP. The greater the error, the greater the uncertainty in the slope and duration of those warming trends.
#20
Bender – so, could one say Dr. Loehle’s recent work may be significantly flawed because of the limited number of dates over such a short period and the potential errors in those dates? It has already been pointed out that there are few confirmed dates in the last 50 yrs. However, how can one compare eras if dating is not firm?
Related, what is range in error in the x-direction around each data point for each proxy? 10 yrs? 25 yrs? 50 yrs? 100 yrs?
Re: #21
Tree rings happen every year. They and there MXD cousin may not be good thermometers but they have the definite advantage of being good clocks/calendars.
Re #21/22
To a statistician* every study that does not report robustly estimated confidence intervals “may be significantly flawed”. Whether or not the conclusions in Loehle (2007) are supported by robust statistics, we’ll just have to wait and see. But please note that uncertainty is not always damning to a study’s conclusions. It’s just that it’s a nuisance when it isn’t handled correctly from the start. It means you must be patient until the re-analysis is done.
Nine years and several IPCC reports later, Li et al. (2007) have finally re-analyzed the MBH99 data in an honest effort to quantify the uncertainty. See what I mean about patience? Hopefully it is not 9 years before Dr Loehle’s set of proxies have been analyzed using a similar methodology.
*Policy-makers, on the other hand, seem to be less discerning as to what constitutes a “significant flaw”. So the answer depends on what you mean by “significantly flawed”.
But let’s not be too dismissive. Science is progressive. You don’t wait until you have the exact right answer before you publish. You publish when you’ve made significant progress that your peers could benefit from. The real problem is at the level of science-policy application: given you have limited scientific data, what is the best policy. You want to use the literature as a basis for decision-making, but you must recognize that it is full of minor defects. Over time, these get ironed out. But at any one time, it is a challenge to determine the actual state of knowledge. If policy-makers insisted on 100% correct science, they would be waiting forever.
I wouldn’t base policy solely on Loehle (2007). But I wouldn’t exclude it either. I would hope for a much-improved Loehle (2008), but I wouldn’t count on it either.
If I were a policy-maker I would insist on some formal estimate of the quality of the intelligence I received before acting on it. In the quantititive sciences, this is called a “confidence interval”. I think there are many cases where policy-makes are not asking that question. Maybe because they’re not used to thinking that way. But when you are facing trillion-dollar decisions how can you think otherwise? Big questions require solid uncertainty analysis, little questions less so.
Bender. any R2 number in Li et al.(2007)?
RE 20. bender. I understand also having error in the X direction, but what the heck
do you graph in the end.. and if the stuff is autocorrelated.. how do begin to untangle it?
#8. sod, Moberg’s low-frequency proxies almost entirely overlap with Loehle’s. So any criticisms of Loehle apply a fortiori to Moberg. I haven’t noticed you complaining about Moberg – why not?
27
Nice clear, incisive point, Steve. I’m looking forward to sod’s response.
Re #25/26
Maybe Steve M wants to set up a thread on the paper? JEG provided this url:
Click to access 2007-LNA-TeA.pdf
moshpit, when I can’t compute exact solutions, I simulate it.
As for autocorrelation, given the sparseness of the data points in the time domain, maybe the autocorrelation is very weak? If autocorrelation is strong enough to violate assumption of independence, why not sub-sample (and iteratively resample) the data so that they are independent?
In general, resampling seems to be under-utilized in climate science. But enough; my carbonic soup is boiling over. (Gunnar’s dinner.)
From Li et al (2007):
We assume that there is a linear relationship between the temperature and proxies, and that this relationship does not change throughout the entire time period. This is central to all team climate reconstructions
Fixed it.
More from Li et al. (2007), relevant to mosher’s question:
Precisely the approach advocated by bender for over two years.
Now, if only they would drop the active ingredient to which they are addicted and stretch it all back 200 years. There would lie your answer.
Steve M has advised us before to “watch the pea under the thimble” when it comes to team proactice and this appears to be another deft team manoeuvre. (Was a time I used to think he was cynical.) Li et al. (2007) is an interesting “methods paper”. But unlike most methods papers which focus strictly on a method, this one focuses on one specific application of the method: estimation of confidence intervals around the same old HS. Which makes me wonder: is this really about a new method, or is it just a clever way of dressing up that broken stick while managing to avoid substantive issues about the underlying data in the “case study”? That would be a slick way of keeping the icon visible. (Why do they make me feel like a sucker being sold a lemon by a used-car salesman?)
Two observations:
1. Despite the lack of discussion about the underlying data in Li et al 2007 (yes, some lip service), I didn’t hear JEG complaining the way he complained about Loehle’s paper.
2. Li et al 2007 were truly a methods paper, you’d think they’d be interested in getting that method out there so people could use it. And maybe they are. But no offers yet from JEG to look into this, despite an obvious application right here: Loehle’s proxy data set.
Any bets how long it takes before the ‘we’ve moved on’ HS-in-drag starts showing up in the policy arena?
#23
Bender says:
OK, so we must be patient with the latest approach but not with others? You point out that it took 9 yrs to analyze Mann but neglect to discuss progressive attempts by others at putting together a global reconstruction. If science is progressive, why focus primarily on the Mann paper? I’m confused.
This question is still not addressed: how are these proxies useful over such a short period if they have dating errors of at least 25-50 yrs [I’m assuming radiocarbon dating in many of these proxies] and few dates over a 2000 yr period in each proxy used. Related, aren’t there dating errors in a couple of places over the last 300 to 2000 yrs because of ocean-atmosphere reservoir effects that can making carbon dating errors up to +/- 100 yrs.
Are these proxies appropriate for the time period, especially when someone is trying to state that the MWP is warmer than the current era?
don t tell me, tell it Craig Loehle.
he is the one making claims that are completely unsuported by his data:
http://www.ncasi.org/publications/Detail.aspx?id=3025
how can he do this, when a significant part of his sources don t have any data for the “end of the 20th century”?
sod, you certainly are persistent in asking your question. I’d love to see you reply to some of the responses!
1) Proxies tend to have missing data. Is that a problem for you? If so, then you should be rejecting the other proxy studies as well, as they have missing data. If not, then why are you harping about this?
2) Dr Loehle’s study specifically excludes the proxy data most known for being in error. Which would you prefer: proven-wrong proxy data that “fills in the gap”, or missing proxy data?
3) You’ve suggested many times that the measured temperature record be inserted as another “proxy”. Since we do not have even 500 years of temp measurements, let alone 2000, why do you believe that would be a valid record for inclusion in this study?
4) Dr Loehle’s hypothesis, supported by the available proxy data in this paper, is that the MWP was significantly warmer than the 20th century, whether mid or late. What is valid proxy (not measured-temp) data do you wish to submit, that provides evidence that the mid and/or late 20th century is warmer than the MWP? For reasons extensively discussed here and elsewhere, you need to provide something other than tree rings.
Re #35 sod’s asked the same question multiple times in multiple threads. Maybe his mind is made up on the issue? If he would sit still and read he might learn something.
#35
1) Missing data are inevitable without inclusion criteria so strict that there would be few proxies available. Proper treatment of missing data greatly complicate the analysis, but it is not apparent from Loehle (2007) that so many of the proxies fall so far short of the end of the reconstruction, or how this was handled. Moberg et al (2005) is explicit both about the missing data, and how it was treated. If the hypothesis being tested is that centennial scale climate variability is large, then missing data is OK (Briffa and Osborn’s 2006 method copes fairly well). If the hypothesis being tested is that the MWP is warmer than the modern, it is a problem. One simple (and probably simplistic) test would be a paired t-test of modern against medieval temperatures from each proxy, but we only have half the number of proxies that it appeared that we had.
2) “excludes the proxy data most known for being in error” The word “know” should be replaced with “believed by some ClimateAudit readers”. The general agreement between Loehle’s curve and previous dendroclimate-only records argues that both types of proxy are reasonable. All types of proxy have occasional cases where, for some reason or another, they do not provide realistic reconstructions, but this is no reason to reject the entire field, unless you are interested only in promoting a political point of view, rather than engaging in the science.
4) The paper does not *test* the hypothesis that the MWP temperature is higher than the mid-20 Century.
#37
I’m prepared to debate that one, if you like.
As for (1) and (4) I think this is a good idea, as many people are asking the question specifically about differences between MWP vs CWP. And if it should turn out that the data are insufficient to answer the question, let it be known far and wide. Because the data are being torqued by both camps.
RE 29.
Ah I agree on the autocorrelation thing. Funny though, if the climate has a long memory
then maybe i reserve the right to say i was right.
For simulating x error what do you do? . monte carlo the X according to some distribution?
I would think that if there are errors in dating that they might be biased in a non
random fashion.. like every measurement is too young or too old..
or that you might have a bias factor and a noise term?
So, would you just jiggle x left and jiggle x right and do the hokey pokey or what?
Just curious not confrontational.
Re #39 That’s exactly what I would do.
29: Look at the references for a complete team roster. McIntyre isn’t listed, either. Wonder what Wegman would say.
Sod, for “the end of the 20th Century” one should be using either satellite or perhaps the ground-level instrumental records. Not proxies of any kind.
They’re inherently going to show the “blade” just fine. But there just is not very much dispute about how much the temperature may have climbed since, say, 1970.
Tacking any of the instrumental records on will give the delightful blade.
The question is, how relevant is the (not explicitly present in the paper) blade?
If the truth is as presented by Mann et al., then Europe had a couple decades of heat – but the MWP was a blip in global terms. And thus the current well documented blade is a vast worrying deviation from normality that is unprecedented in recent history -> panic now!
But, if the MWP was truly global, extended for 400 years, and was substantially farther from the mean than the current temperatures, then a phrase such as “looming catastrophe” is clearly Chicken Little speaking.
This is where we get wonderful quotes like: “We have to get rid of the Medieval Warm Period,” from practicing scientists.
Re #41: WWWD
Wegman would say “ah – a fresh young statistican as lead author. I wonder what this is about.” And he would read.
>> for the end of the 20th Century one should be using … Theyre inherently going to show the blade just fine
I think this misses the point about updating the proxies, and showing recent data for the proxy. The point is that it validates the proxy. If it doesn’t correctly match recent temperature measurements, then it most likely is not a good proxy for temperature. I think that Steve M’s recent tree ring work confirmed that they did not generally match, hence, bad proxy.
>> Missing proxies
One proxy that I just learned about from Jaworowski’s March 07 paper is direct ice core temperature. It clearly shows the MWP as warmer than today.
(I wanted to upload an image, but couldn’t see how to do that)
no. my problem is with making claims beyond what the proxies show. that is what Loehle does.
9 of the proxies used by Loehle have ZERO data in the 1965-1995 time interval.
how can he claim some insight, when half his proxies do not supply data?
this is a fatal flaw in the paper!
i m not sure about the “proven wrong” part.
this is NOT what i suggested. instead i simply pointed out, that applying the Loehle method to the hockey stick temperature data, we wouldn t get a hockey stick either. 30 years averages, up to 1995 only, using significant data from the early 20th or even 19th century can NOT produce a hockey stick form.
i would start with the Thompson ice cores.
Click to access Thompsonetal-climatic-change-2003.pdf
and you are playing with words there. the late 20th century is SIGNIFICANTLY warmer than the mid 20th century. and the article is talking about the end of the 20th century!
isn t that exactly what Mann did? didn t he sort of get attacked a LOT for doing this?
#45
And to complete the circle, on what basis to you find “Thompson ice cores” reliable? Why should we find them reliable?
Go ahead and apply that logic to MBH98.
First of all, keep in mind these ice cores have a very limited coverage (Andes and Tibet.
Secondly, looking at Fig 5, I see only one of three cores showing the temps at the end of the 20th century being warmer than during the MWP. Ditto for Fig 6.
Furthermore, four of the six cores show the beginning and/or middle of the 20th century being warmer than the recent decades you so dearly want included in Loehle’s proxy reconstruction!
Lastly, if you want to talk about the Thompson ice cores, search this site for Thompson.
sod: the data are what they are. It is not deception. All the data are public–would you like a copy? If you feel more comfortable comparing the MWP to the mid-twentieth century and then adding a few tenths to get to the 2000 levels, feel free. Repeating your accusations does not make them more true. Even if you stop your analysis in 1950, the paper shows that the MWP was a real fluctuation using widely dispersed data, and was not confined to Europe.
Look at RomanM in 478 old thread: he plots the weather station data closest to my sites, and compares it to the long term plot of temperature for globe and NH–get high corr. this shows that the sites are representative of global weather.
sod: a medical study with 12 people is still published even though it is not based on 20,000 and it is called “preliminary”–remember I said that my results were based on limited data.
#48
Did you test this, or is it just an unsupported assertion. What happens to your analysis when you leave out the north Atlantic samples?
my problem is NOT with your data, but with the claims you make without useful data.
and without giving the information about the lacking data.
i have no problems with your result about the MWP, but with the comparison to “the end of the 20th century”.
i did not bring up any argument about MWP being Europe only.
a very good plot, but it does not adress my point. at best it speaks for the GISS data.
i ve seen a LOT of medical statistical thesis in my life. i said it before: if we apply the standard that Steve is putting on the Mann team on medical science, we can bury the medical research of the last 50 years.
Steve: Don’t be ridiculous. Valid medical research passes relevant statistical tests.
sod,
Ever heard of the FDA? I’d be delighted if the “team” had to face the same rigor as any pharmaceutical company does to bring a drug to market.
And btw, if medical research was done a little more carefully, maybe we would be making progress, instead of one reports that says cell phones cause cancer, followed by another that says they don’t, followed by another that says they do, followed by another that says they don’t, followed by another that says they do, followed by another that says they don’t, followed by …
Re #52 Larry
If that rigour were not there, the company would be sued up, down and sideways.
Wouldn’t it be nice if the same were true for the Hockey Team …
55, theoretically, yes, but I strongly suspect the case law is against you.
Hogwash. Your lack of understanding of error bars on another thread, your loose use of the term significance on this thread in #34 (‘how can he do this, when a significant part of his sources don t have any data for the end of the 20th century?’), etc, suggests you have minimal exposure to statistics .