Several recent posts and hundreds of associated comments have focused on the subject of temperature adjustments. TOBS, homogeneity, scribal records, rural versus urban … it is enough to make one’s head spin. I understand the desire to adjust data, but I often wonder if the problem is simply intractable and the adjustments we do have in place are a bit naive. I often ask myself: can the rich historical record of a station overwhelm the well-meaning attempts to adjust for observation times, UHI, and other factors? How often were stations relocated? What were the surroundings like? How accurate were the instruments? Were the instruments properly calibrated? What happened when the curator became ill, or had pressing business matters to attend to, or overslept? Multiply this by a hundred, or five thousand … do the variations simply become noise we can filter out? I think when we are comparing years to an accuracy of hundreths of a degree, these questions become important.
Last summer I stumbled across a paper published January 21, 2005 by Stephen R. Doty and Dr. Lesley-Ann Dupigny-Giroux titled “THE HISTORY OF SURFACE WEATHER OBSERVING IN BURLINGTON, VERMONT, 1832-1973”. I posted a copy of it on surfacestations.org. One of the stated goals of this paper was to produce a document that future studies can use to evaluate the validity of the data that were collected here, judge the trustworthiness of the observers who collected them, and determine the climatological significance of the whatever variability may be discerned. I found the paper an interesting and revealing study of one of the many USHCN sites across the country, and it is the most complete historical description of any USHCN site I have run across to date. It describes in great detail how the Burlington station moved its way eastward from its original location in downtown Burlington to its present location at the airport. Along the way it was moved to rooftops, windows, close to ground level, close to porches, near parking lots and runways. I was particularly drawn to this history because I lived for nearly 20 years in the Burlington area beginning in 1982, and I am very familiar with the city and locations described throughout the paper.
I wrote this post not to prove a point for or against AGW. In fact, one should see that no conclusion can be made with respect to AGW by examining this station’s record (well, at least I don’t think a conclusion can be drawn). I wrote it really to point out that the surface record is a poor measure of climate change, at least when we are attempting to measure with sub-degree accuracy. Unless the complete station history for each station in the record is fully understood and compensated for, we are doing nothing more than guessing when comparing the present to the past.
The following image is taken from the paper, showing the various station locations between 1832 and 1973:
I have tried to summarize the changes this station has seen over its lifetime. Below are paraphrased descriptions of the station locations since 1880. I selected the years after 1880 since they are covered by the GISS record, although FILNET does go back to 1837. I also used an alphabetic label next to my descriptions for use on several plots. In a few cases I note additional thermometer information taken from the USHCN station history file, such as change in instrumentation and/or height.
(A) December 1878 – June 1883: Howard Opera House at the SW corner of Bank Street and Church Street (44° 29′ N 73° 12′ W, Elevation 213 feet). The type of thermometer is not indicated, but it’s height is recorded as 56 feet above the ground, placing it on the roof.
(B) The location of the station from July through September, 1883 is unclear. The address listed for October 1883 is City Hall Park, which is about a block from the Howard Opera House.
(C) November 1883 – November 1891: 55 Elmwood Avenue (44° 29′ N 73° 12′ W, Elevation unknown). The type of thermometer and its height above the gound is not indicated. Note that the USHCN station history file lists the height as five feet from 1883 to 1906.
(D) December 1891 – January 1906: 57 Elmwood Avenue (44° 29′ N 73° 12′ W, Elevation unknown). The thermometer is listed as a “Green’s max and min, and ordinary” mounted in a double blind (Weather Bureau pattern) shelter located on the west side of the house, 12 feet from the ground. This obviously differs from the USHCN station history file.
(E) February 1906 – March 1906: 301 South Willard Street (44° 29′ N 73° 12′ W, Elevation unknown). The shelter (with presumably the same thermometer) was listed as attached to north window of house about 1 foot above sod (basement window of house.) As reported in the paper, the relocation to South Willard Street represented a move to a higher elevation and a residential setting that was further removed from the shores of Lake Champlain.
(F) Late March 1906 – June 1943: Weather Bureau Building at 601 Main Street (44° 29′ N 73° 11′ W, Elevation 398 feet). The unspecified thermometer is described as being 12 feet from the ground. Figure 3 in the paper is of a postcard of the site showing the location of the weather station off the front porch. The location was 1 mile east southeast from the previous location, further from Lake Champlain and at the top of the hill occupied by the University of Vermont campus. It was recorded by Weather Bureau personnel that “The location is excellent for meteorological purposes but rather far out from the business portion of the city.”
According to the USHCN station history file, this move also resulted in a lowering of the thermometer height from 12ft to 6ft above the ground. However, note that for two months in 1906, the station was 1 ft above the ground.
The following image is taken from a 1906 USGS survey map of Burlington. I added a green dot to indicate the location of the station at the beginning of 1906 and a red dot to indicate the location at the end of 1906. To me, it looks like the station moved from n urban to almost a rural setting. But was urban in 1906 like urban today? What, for example was used to pave the streets?
(G) 1934 – February 1950: Administrative Building, Burlington Municipal Airport (44° 29′ N 73° 09′ W, Elevation 331 feet). Until March 1939 the station was operated by National Airways, Inc, and then by the U.S. Civil Aeronautics Authority until June 1943. At that time the Weather Bureau consolidated the two observing sites in Burlington at the airport location, closing the City Office. The Weather Bureau occupied the same office as the CAA had been using. (In my opinion, it is likely the temperature record reflects the readings from the 601 Main Street location until June, 1943.) A diagram of the Administrative Building indicates the thermometer was located in a CRS about 25 feet north of the building. It was mounted on a Townsend support. Maximum and minimum thermometers and a fan were installed.
I found the following passage from the entry quite interesting: In September 1943, the station inspector recorded the following, “Exposure only fair. Too close to runways, building, etc., and over sand soil. Maxima several degrees higher than City Office readings on sunny days; mimia lower on clear nights, due to radiation.”
The following image is taken from a 1948 USGS survey map of Burlington. I added a red dot to indicate the location of the station in 1943 and a blue dot to indicate the location in 1944.
(Gi) 1959 – according to the USHCN station history file, an H06x series Hygrothermometer was installed at the site.
(Gii) 1964 – according to the USHCN station history file, the thermometer was lowered from 6ft to 4ft above the ground.
(H) February 1950 – July 1973: New Administrative Building, Burlington Municipal Airport (44° 29′ N 73° 09′ W, Elevation 331 feet). This represented a move of 0.3 miles north from the previous location. A passage in the report says: A note on the Exposure and Installation of Instruments form dated May 16, 1955, reveals that the “Shelter is located between parking lot and ramp, both of which are blacktop.” The Weather Bureau maximum and minimum thermometers were housed in a “large shelter” 5 feet above the ground. The Figure 11 caption indicates the shelter was 30 feet north of the building. It appears to me that the shelter would be in the shade at noon for most of the year except the summer months. It would not be in the shade earlier in the morning and later in the afternoon.
(Hi) The final update in the USHCN station history file occurs in 1985, when the H06x is replaced with an H08x. No change in height is recorded.
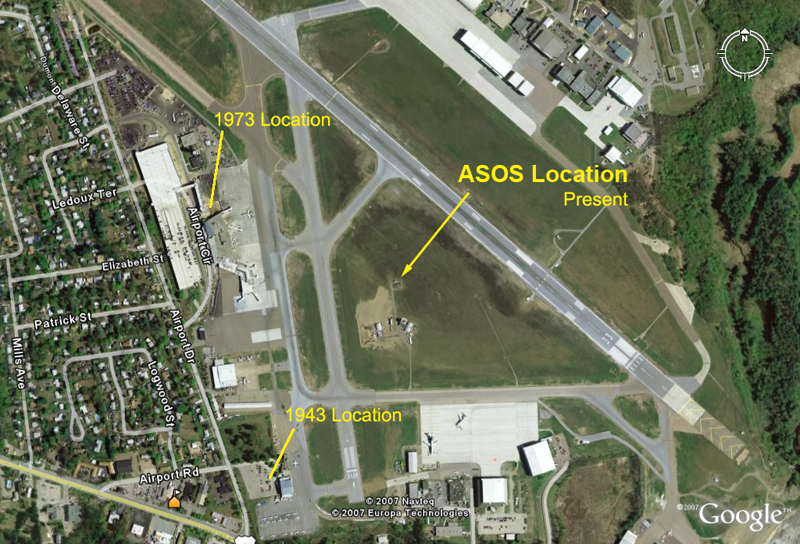
(I) From July 1973 on (which is not covered by the paper) it is unclear looking at MMS as to when the station was relocated and when further equipment changes were made. None of the location entries indicate that a relocation ocurred, although a slight GPS location change occurs in February, 1996. This may correspond to the change to an ASOS which we know is located today between runways, away from the terminals and control tower. I do know that when I lived in Burlington the 1973 location was completely paved over and used as a rental car parking lot. The number of actual location changes between 1973 and 1996 remains unclear.
If one looks at the USHCN station history file, however, there is an indication that an MMTS was put into service in 1973, at a height of 4ft above the ground. The H06x series Hygrothermometer is still listed as being in use.
The following is a recent satellite image from Google Earth which I originally placed on surfacestations.org. I added two additional labels showing the location of the station in 1943 and 1973. Because the site has undergone significant changes in the past 15+ years, what you see is not representative of what the area looked like 35 and 65 years ago.
I plotted the GISS raw and adjusted temperatures for the Burlington station, and added markers to indicate the points in time when the station was relocated. For example, the line marked “A” indicated the last year the station recorded data from “location A” as described above. Given we do not have a control to compare against, it is impossible to know how the station moves affected the record.
I also tried plotting the trends for each period of time the station was at a different location. While there are marked differences in the trend lines, I am not convinced they are meaningful because most of the time periods are short.

Finally, I plotted GISS adjusted minus GISS raw to see if there was any correlation to the station moves or instrument changes. Not surprising, there does not appear to be any such correlation, because GISS does not adjust for such changes. Instead, GISS made an adjustment based on nearby rural stations. Nearby means stations within 500km, or up to 8 hrs driving from Burlington.
What can one conclude from all of this? Looking at the raw Burlington data, nothing really stands out. The adjustments made to bring the station in-line with rural stations does not seem to make a lot of sense in that it does not correspond to any station move or instrument change. Yet common sense tells us that the location, height, and instrument changes all affected the record, and probably more than 0.6C. It is unlikely, however, that we will ever know the extent with which those parameters affected the record. Given that, is the Burlington record important? Can it give us the accuracy required to estimate global temperatures to 0.01 degrees?


32 Comments
No.
Nobody knows.
George M says:
February 22nd, 2008 at 10:52 pm
No.
I beg to differ… ” Is station history important?”….. Yes.
If I was building a cupboard and couldn’t find a ruler but instead spotted a flat straight stick with some marks on it and the word Millimeters…. I don’t think i’d be saying to my work mates… ” It’s cool guys. Stop lookin’ I’ve found a ruler.”… I’d want to know about the history of my measuring stick.
Seems a no brainer to me to ensure the record is valid… To do that you need to know the history…. Not assume one.
#3 careful, there are two questions being asked, the title, and the final sentence. I think #1 & #2 are answering the latter, and I’d suspect both based on the premise that the former is yes, which I think the post demonstrates well.
IanH says:
February 23rd, 2008 at 1:55 am
LOL… fair enough… My analogy is flawed, my premise wrong.
I keep assuming there is validity in surface records with such flawed collection criteria.
…. in otherwords. I missed the point. (sigh)
I struggle with the idea of a global average temperature that is meaningful, also…. But that’s another story. : )
No one is interested in quibbling about whether past temperatures ought to be a few hundreths of a degree in one directiion or another. That’s not the point. What a lot of us are concerned about is whether measuring stations, and the data they yield, are being moved around and manipulated to support some political agenda. How often do we hear of records being broken and told that it’s due to AGW, and then only to later find out that the data was slobby at best.
For me it’s clear: new instruments at new locations with new surrounding conditions yield completeley new data. Comparing today’s data with data from the 1940s is like comparing grapes and melons. The only conclusion that can be drawn is that the system for measuring and gathering temperature data has been so inconsistent and so plagued with gross inaccuracies that it’s impossible to draw any conclusions on trends.
I have relatives in Chittenden county and remember a couple of years ago visiting my sister in So. Burlington, where the temperatue was 92°F. Then I drove to Underhill 30 minutes away, at the base of the green Mountains, and the temperature was only 76°F…talk about a urban heat island effect! And this is only little Burlington VT. In my view much of today’s surface temperature data aint worth the ink it’s recorded in.
The current USA logic seems to be to eliminate as many shonky stations as possible using various criteria, some questionable.
I don’t have the means to do the following, but I would be fascinated to see an exercise where the top 100 quality USA stations of today were back plotted to see how this “high quality” history compared and contrasted with the multitude of other adjusted versions for the USA.
I’m not the only one who has written that the true error envelope is larger than the promoted trend that is being used to shape policy. USA or ROW, does not matter.
Also, I can’t say I’ve seen a clear statement, without qualifications, as to whether satellite temperatures are linked with surface station data to assist calibration. I’ve seen a lot of carefully chosen words, but no clear statement. More secrecy?
Geoff:
I think there was a clear statement about satellite calibration buried in the previous thread on Lampasas history. IIRC, it said that there are a large number of corrections which have to be determined after launch and then applied to raw data. Now, I submit, they never said calibrated against surface observations, but if not, what are they calibrated against? And the number of tweaks mentioned allows for a lot of magic to be applied. I know there are over 200 replies in that thread, and that is in there somewhere. Search against satellite and Lampasas, and perhaps it will pop out.
And in reference to my reply in #1, I was answering the final question in the essay. Sorry for the confusion.
I quickly scrolled through the 19 Versions paper, and a good starting place is reply # 115. The satellite measurements are made by microwave sounding units, called MSUs, which would be a better search term. D. Patterson seems to be the one who has some knowledge or at least provides good references in this subject area, so a search for his name would also likely be useful..
Two things.
One, how do you do stats on data after its been through all these adjustments? What is the meaning of one standard deviation if the spread has been calculated on a series of measurements some of which have been raised up or down in a non-linear way? What is it the standard deviation of?
Two, yes to #6. Its getting impossible to see how these data series can show anything about temperature over time. They are so totally unhomogenous.
Spoken as one who can see for himself that it has got warmer since 1950, if only because the lakes where he grew up no longer freeze. That much is obvious. But what the station record adds to that….?
Steve, sorry for the semi OT in advance,
Peter #10,
This is a subject which interests me, in that minus direct human intervention such as damming, lakes don’t change much, and I think a physicist can confirm that water still freezes at 0C. I have lived in one area, full of lakes for long enough to observe the same anecdotal evidence of which you speak. The lakes where I live froze less and less for several years until finally they stopped. The reason for this is to ask you if your area is the same as mine. Four years ago, those lakes froze again, a bit, then more the next year, last year we skated for two months, this year we’ve been on them for three months already and going to get an easy four, as guys are plowing them with half ton trucks for pick up hockey, so they’re pretty thick. As anecdotal as it seems, this does roughly track the “global” trends, I certainly don’t need anyone to tell me it is getting colder these days. Have lakes in your area started to freeze again?
Duh. /rhet
No, but the question seems to be temperature change over a long period, to what accuracy (deg/100 yr). Ans.=Maybe. Not too likely for this station given the huge changes in the measurement system combined with essentially no calibration. Walhalla, SC (and others) is likely better in this regard.
As one who has long worked in inexpensive, electronic real time control systems, this seems to be an issue poorly regarded by many. Data tend to be few and precious. They need to be gathered and treated with the greatest respect or they will either die or turn on and bite you.
John G, this was a terrific post.
I disagree with those readers whose response seems to be that we don’t know anything and that we should throw our hands in the air.
My instinct is that the station histories have to be assessed to find true “gold standard” stations – ones that have been in the same place with the same observation histories for a very long time. And work outwards from these stations.
USHCN, for all its warts, is a good start down this road. The problem seems to be that it may not be selective enough. GISS makes an effort to select out “good” stations but this effort seems extremely flawed, not least from a failure to examine station histories. Of course, they are relying on USHCN to have done this and on USHCN adjustments, but as this and other examples show, it would probably be better if USHCN produced its own 50- or 100- station gold standard subset, rather than leaving it up to the GISS code 1 criterion.
I’ve been thinking about station histories and adjustments for the last couple of days and the trend chart jumped out at me as what I was thinking about trying. I seem to remember SteveMc once made a comment about TOBS adjustments not always being necessary for trends. If trend is all you’re after and the site only took readings at the same time for its whole history, then to get the trend no adjustment should be necessary. The AGW argument relates to trend not actual temperatures. So for any stable situation the trend you measure is the trend for that time period (assuming non constant changes like UHI not are involved). The difference between the previous end point and the start of the next trend line approximates any bias that the change may have introduced. So if you took your chart of trends and pinned the first value and adjusted the start of each subsequent trend to the end of the last, I would think you would see at least a rough estimate of any overall trend. This wouldn’t require any guesstimates of the effect of the change nor reference to other sites which may or may not have their own biases.
@Peter (10)
Lakes not freezing over could, I suppose, indicate a warming trend, at least for the area where the lake is located. But this kind of evidence is anecdotal at best. Now to throw a little sand in the gears of calculating temp history…readers ought to be aware that Vermont 100-150 years ago was 80% DEFORESTED! Today it’s at most only 25% deforested.
Steve McI, I certainly sympathize with your comment about not throwing up our hands the dismissing all data as bad. Running this blog, and having to deal with all of the loose cannons that lurk around, must be a lot like herding cats.
However, as to the point at hand, I would like to ask a hypothetical question. If all of the current data tweaking and prodding were to be thrown away, and we could start with just the raw data, how would you proceed? What criteria would you use for tweaking and prodding the data into something useable?
The unadjusted versus adjusted graph above leaves me with a couple of questions:
1. What percipitated the changes/adjustments in the in-between move time intervals.
2. When were those adjustments made, i.e. I doubt the adjustments were made when noted on and applied to the time series graph. An adjustment made to the graph in the 1920s may have been performed in the 1990s. This being the case, brings up the question why?
If someone can give reasonable answers to those questions I would have more confidence that someone understands the adjustment schemes.
Hi John,
This is a superb writeup! If only every station had such rich history that we could graph as you’ve done. I had actually been thinking about the need to create a graphical timeline image for each station to illustrate moves much as you have done.
BTW I sent you an email couple of days ago, if you didn’t get it, please advise and I will resend.
Someone should write to the Idsos and see what criteria they use to select their “temperature of the week” records. Hopefully, it’s not just cherry-picking stations that show a decline in temperature.
To adjust or not to adjust, that is the question…
Let’s talk again the oldest Prague record, the Klementinum, in the very historical centre of the city.
The truth is, that the area about 1-2 miles around has been built over and nothing much changed there since 1780. The station itself has been moved from the tower of the college (higher than most of the rooftops around), to the first floor, where it now sits outside the window cca 6 meters over a paved inner yard. Concerning urbanization, however – Prague has grown from some 50 000 at the end of the 18th century to some 1.1 million inhabitants now.
And now for the yearly average temperatures: they make sort of a crescent or U with the highest points at the end of 18th century and at the end of 20th century.
So, should it be adjusted and how and what for? Do Prague concrete suburbs really influence the city center? What about the fact, that in time of the quick spreading of the city and its industrialization in 19th century, the temperatures were decreasing?
Every now and then I stumble across a detailed station history and find them interesting reads. In the case of Yorktown Heights, NY it appears that there was a lengthy period of overlap between the older Carmel station and the newer Yorktown station, so when the two were merged into a single record, Carmel’s was adjusted to match Yorktown. The thing that struck me with Burlington was the number of moves, changes in instrumentation, and changes in height above the ground. Intuitively I believe the changes impacted the record (and the station inspector in 1943 noted as much), yet when one looks at the record it appears rather unremarkable.
I believe a similar story can be told at most other stations around the country. Take Crawfordsville, IN, which in a comment to a previous post notes it as S1A. We have learned that GISS is using this station to adjust the trends of urban stations. The photos on surfacestations.org show the location to be clearly rural – probably a farm. But the history file tells another story. Notably, the station was located at a power plant from 1925 to 1982, then at a radio station for 10 years before finally being sent to the farm. If the station’s history were properly assessed it might not be deemed “rural” and used to adjust other stations.
Similar for Tekamah, NE where it was at a newspaper building in town, various homes in town and now in a rural backyard uphill and upwind from town.
The surfacestations.org database should likely have a station rating plot by year (monthly would be better) rather than just an “as visited” rating. (Note: the Norwalk, Ohio station was in the middle of a significant move the day it was visited. The instrument head was still wired to the data logger while it was sitting out of the way of the ongoing construction. With the rate of station moves these days, it’s not too unlikely to have the equivalent happen again.)
I’d suggest that one would try to identify the stations most likely to have had a constant microclimate in locations of the most interest/geographical spacing and use the daily raw data as a start. Annual means are hardly a good descriptor of climate for most earthly locations. Perhaps 25 for the US.
I’d also note that the USGS seem to have water temperature measurements at a number of its river flow measurement stations. Perhaps if those data are of better provenance than the air temperatures, continental climate change could be better measured.
“Is the Burlington record important? Can it give us the accuracy required to estimate global temperatures to 0.01 degrees?”
I would say the Burlington record is important if only because it illuminates difficulties in maintaining an accurate record over a long period of time, that is fairly comparable to other records over such time period.
I would restate the latter question slightly. Is it possible to obtain from this record and similar records evidence of change in global temperature over time to a level of accuracy that justifies an action being requested? That begs the next question, if not, how do we fix it?
I’m not looking for a conspiracy. I am most concerned about the level of certainty that we may derive from the data we have so far, and how do we make it better. In that regard I find the contributions to this blog fascinating. Thank you John Goetz, Anthony Watts and others and of course Steve McIntyre.
Re 15, applying the suggested approach to the Burlington trend lines posted, quick eye-ball method, moves the 1007 to present flat trend down just a little. If 1881 were representative of starting temperatures, the net trend over 120+ years would be about 0.2 degrees C. John could you give us a few prior years? Murray
Re 15, applying the suggested approach to the Burlington trend lines posted, quick eye-ball method, moves the 1997 to present flat trend down just a little. If 1881 were representative of starting temperatures, the net trend over 120+ years would be about 0.2 degrees C. John could you give us a few prior years? Murray
re 27
I did a calculation in excel using eyeballed endpoints from the graph and I get the same .2 value (7.5 to 7.7 deg at the end). My next question is what would the resulting trend line be if you readjusted all the points to the corrected trend lines and then did an overall trend calculation?
Have you looked across the lake at Plattsburgh, NY, the Air Force Base? The base is twenty miles away.
http://data.giss.nasa.gov/cgi-bin/gistemp/gistemp_station.py?id=425726170050&data_set=1&num_neighbors=1
Plattsburgh Air Force Base was an old Strategic Air Command base. It ramped up with several thousand new soldiers and camp followers (for lack of a better term) in the ’60s, then gradually declined in population.
Here is a map that shows relative population growth since the 1960, note that Plattsburgh has experienced negative population growth while Burlington’s growth is strongly positive.
http://data.giss.nasa.gov/cgi-bin/gistemp/gistemp_station.py?id=425726170050&data_set=1&num_neighbors=1
You may also note that Plattburgh’s temp history shows little if any warming since 1946, when it began. The Difference between it and Burlington varies over time, with Burlington warming since the 60s, but there is the fact that Burlington was also warmer than Plattsburgh in the 40′ and 50’s. Plattsburgh seemed to catch up right about the time the Air Force base was ramped up in the cold war.
re #19
Mr. Goetz (and Mr. Watts),
Have you seen this website yet. It contains a depository of station histories that seem to have all been done complementary with “THE HISTORY OF SURFACE WEATHER OBSERVING IN BURLINGTON, VERMONT, 1832-1973″ that you began this discussion with.
http://mrcc.sws.uiuc.edu/FORTS/histories/
#30 Bruce
Yes, the website you linked to was in fact where I found the paper last year. Thanks for reminding me where I found it!!
#29 yorick
I have looked at Plattsburgh, but only superficially. I did notice that it seemed to represent a dampened version of Burlington. Right now I am trying to understand how its temperature was homogenized for UHI effect.
#27 Murray Duffin
YEAR ANN
1837 5.45
1838 6.42
1839 6.98
1840 7.68
1841 6.64
1842 7.59
1843 5.79
1844 6.86
1845 7.52
1846 7.4
1847 6.54
1848 7.11
1849 7.01
1850 7.29
1851 6.76
1852 6.35
1853 7.48
1854 6.9
1855 6.98
1856 6.81
1857 5.46
1858 6.04
1859 5.98
1860 5.92
1861 5.62
1862 5.49
1863 5.53
1864 5.93
1865 7.03
1866 6.19
1867 6.05
1868 4.7
1869 5.82
1870 7.35
1871 6.56
1872 5.63
1873 4.53
1874 6.41
1875 4.68
1876 6.99
1877 7.1
1878 8.27
1879 6.58
1880 7.86
I think that Burlington – Plattsburgh or more precisely Northern New England – NY North Country is kind of fascinating because the Adirondack Park has frozen development in NY. I first noticed the whole thing because I live in the area, about an equal distance from both cities, but accross the lake from Plattsburgh, and Plattsburgh’s TV news temps always seem to match mine, and Burlinton’s are usually more than a couple degrees warmer. This is borne out by my car thermometer whenever I drive into Burlington, though there is some UHI in Plattsburgh, at least at the Wall Mart Lowes plaza compared to outlying rural areas too. I am not sure of the exact location of the AFB though.
If there is someplace I can drive and take pictures and notes for you in the area, let me know, I would be more than happy. I am also curious about Montreal, since those temps should track pretty closely too, and they are under a different regimen of adjustment, I assume.