A few days ago, I commented on the surprisingly large negative urban adjustments made by NASA at several Peruvian stations. I’ve now calculated the maximum negative and maximum positive urban adjustments at all NASA stations – something that I was able to do only because of my scraping of NASA data from their website (something that caused some controversy last year.) The results of these calculations have been added into the giss.info.dat (ASCII) data set at CA/giss data directory (The core of this is taken from the GISS station.inv file.)
While Hansen et al 1999 notes in passing that urban adjustments can be “of either sign”, neither it nor any other survey actually carries out a simple inventory. Indeed, a notable feature of the Hansen urban adjustment a a statistical method is that its efficacy is not actually demonstrated on a statistical data set of known properties, but is merely asserted and then implemented in an important practical setting – a practice that we’ve seen elsewhere in climate articles.
I’ve classified the 7364 stations in the GISS network into the following categories (with a cross-stratification to U.S. and ROW):
1. Positive urban adjustment (this is the Phoenix, Tokyo “expected” case, illustrated in Hansen et al 1999)
2. Negative urban adjustments (this is the counterintuitive case encountered at Puerto Maldonado and discussed recently)
3. “Bipolar” adjustments (this is an adjustment which is negative in one part and positive in another. These arise from the operation of the two-legged adjustment, but the interpretation of such cases is not discussed in Hansen et al 1999, 2001. In the inventory below, these occur in both the Positive and Negative stations and are deducted in making a total.)
4. Not used. (These are stations in the data base for which no adjusted version is calculated. In the U.S., their exclusion seems to result from the record being too short (under 20 years). I haven’t canvassed ROW exclusions in detail, but, in a quick look, shortness seems to be the predominant factor, but the methodology also provides for exclusion if there are not 3 rural comparanda – this doesn’t seem to be a big hurdle since 1000 km is a large radius and “rural” is, to say the least, loosely interpreted as discussed elsewhere.)
5. Unadjusted. (These are stations that are Code 1 in the U.S. and R in the ROW.)
I remind readers that there is a noticeable difference between U.S. and ROW temperature histories, which received much publicity last summer in connection with Hansen’s “Y2K” error – in which Hansen and NASA observed that the U.S. accounted for only 2.5% of the earth’s surface and re-ordering or errors in the U.S. data were immaterial to the world results.
First, here is a table showing the inventories – take a quick look at the table and I’ll comment below.
| U.S. | ROW | Total | |
| Negative | 740 (39%) | 1108 (20%) | 1848 (25%) |
| Positive | 1003 (52%) | 1233 (23%) | 2236 (30%) |
| “Bipolar”l | 324 (17%) | 335 (6%) | 659 (9%) |
| Subtotal: Adjusted | 1419 (74%) | 2006 (37%) | 3425 (47%) |
| No Adjustment | 353 (18%) | 2220 (41%) | 2573 (35%) |
| Not Used | 149 (8%) | 1217 (22%) | 1366 (19%) |
| Total | 1921 (100%) | 5443 (100%) | 7364 (100%) |
There are many striking aspects to the adjustment inventory.
First, 74% of all U.S. stations are adjusted, while only 37% of ROW stations are adjusted. This is a statistically significant difference by any measure. Is this because the ROW stations are, on average, located in more rural settings than in the US? Or is it because of a difference in methodology (or metadata)? While no one to my knowledge has carried out the engineering-quality investigations necessary to resolve the matter, my impression is that the US has made a fairly concerted effort to maintain weather stations in rural settings (Orland, Miles City etc.) and that many ROW stations are in cities and small towns (especially airports). Using a consistent apples-and-apples population classification, I would be very surprised if this very large difference between U.S. and ROW classifications held up.
Second, negative urban adjustments are not an exotic situation. In the ROW, there are almost the same number of negative adjustments as positive adjustments. In the U.S., there are about 50% more positive adjustments as negative adjustments – again a noticeable difference to the ROW. Some commenters on my Peruvian post seemed to think that negative urban adjustments were an oddball and very anomalous situation. In fact, that’s not the case, negative adjustments are nearly as common as positive adjustments. As such, extreme cases (such as Puerto Maldonado) need to be analyzed and explained.
Bipolar adjustments account for 17% of U.S. stations, but only 6% in the ROW. These can be either “cup” or “cap” shaped, one of each being shown below:

In my next post, I’ll discuss some very interesting obiter dicta in Hansen et al 1999 about negative urban adjustments.
In the meantime, I’ll illustrate the above tables by showing the locations of several classes of stations on a world map (apologies to Hu McCulloch for not implementing a Mollweide projection on this occasion.)
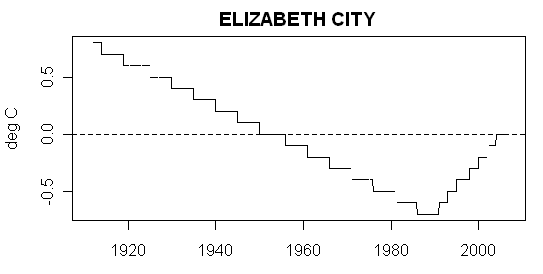
First, here is a location map for all GISS stations with negative urban adjustments. The color coding is: red: greater than 2 deg C; salmon – 1 to 2 deg C; pink – 0 to 1 deg C. Peru definitely has a noticeable number of extreme examples (Pucallpa, Puerto Maldonado, Cuzco plues Piura, which I’d not mentioned), so I guess I do sometimes have sharp eyes for picking anomalies out of large data sets. Other ROW cities with negative urban adjustments exceeding 2 deg C are : Asmara, Nouadhibou, Darbhanga, Krasnovodsk, Sancti Spiritu, Praha/Ruzyne (which will no doubt intrigue Luboš Motl) and Beirut/Beyrouth Airport.

Next here is a corresponding map for all stations with positive urban adjustments.

Third, here is a corresponding map for all (used) stations with no adjustments. This is an important map to consider, because readers need to keep squarely in mind that there are a LOT of stations which aren’t adjusted and that, even if you didn’t use any of the adjusted stations, there still would be a lot of stations in the index. Some readers have wondered why Hansen doesn’t simply use the “good” stations in his index – and I must say that this question certainly crosses my mind as well.

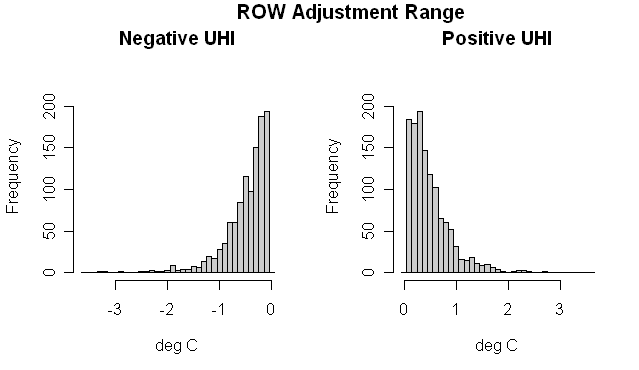
Here is a histogram of maximum positive and maximum negative adjustments for all adjusted ROW stations, showing somewhat similar distributions, though there is a very slight balance towards positive adjustments.
“Long” Stations
In discussions last summer about comparing the 1930s to the 2000s, NASA made the unarguable observation that the U.S. was only 2,5% of the world’s surface (6% land surface). I thought that it would be interesting to illustrate the population of stations which were present in 1930 and 2000 or later, stratifying the results by whether the stations were positive, negative and unadjusted. First here are the stations with negative adjustments:

Next here are the long stations with positive urban adjustments.

Finally, as before, here are the long stations with zero adjustments:
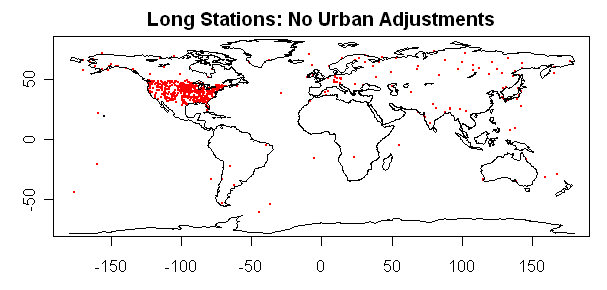
Obviously, while the U.S. is only a small fraction of the world’s land surface, it provides the vast majority of the long station records.


128 Comments
An uninformed question: What is “ROW”?
Ok, UHI adjusments are supposed to be because urban areas are likely to have had changes over time which result in higher temperatures. So how can the rest of the world find near as many places where temperatures have gone down as have gone up? (BTW, it’s confusing to call something a negative urban adjustement if the net result is that temperatures in areas are raised, which I think is what you mean. Correct me if I’m wrong).
ROW = Rest of the World
Thank you for putting these adjustments in perspective.
The near balance of +ve and -ve adjustments suggests to me that the algorithm had no net effect on the results and we would likely end up with a similar trend if only the unadjusted sites were included. Is this a reasonable conclusion?
Many posts have suggested it before, but this data is just begging for someone to put together an independent temperature history using only the best stations. Personally, I think it sounds like the perfect project for Anthony Watts, although it does seem like he has a lot on his plate. (Don’t you just love it when posters freely offer to add to someone else’s workload?). It would be fun to be able to debate the handling of station data in an open process to develop a more logical/consistent world temperature history. I see it following the open source software development model.
Not a lot of positive urban adjustments in the Rest of the World (with 6.2 billion people). I note the ROW has contributed the most to the global temperature increase (since the US does not show much of a trend.)
Are these adjustments versus the Raw data or is this the GISS adjustment of the GHCN data (which already has numerous adjustments built into it)?
Steve: For USHCN stations in the US (which is a large proportion), GISS begins with the USHCN-adjusted version, but removes USHCN interpolated values and does Hansen-method interpolation. This is different from the GHCN raw version for USHCN stations (which is the USHCN raw version). In the ROW, GISS starts with the GHCN raw version and does not use the GHCN adjustment. Everything clear?? (You need a program to keep track.)
Given that the US has so many stations with long records and no UHI adjustment, relative to the ROW, it is conceivable that maybe 25% of what we know about global temperature comes from the US, even if it is only 2.5% of the world’s surface.
The exact value depends on the covariance structure of the station readings — once a region is saturated with stations, additing additional stations doesn’t tell us much more — so the above is just a wild guess, not an actual estimate. But worth pursuing.
Steve writes,
What does “scraping” mean, and why would it be controversial? I’ve seen it used on CA a lot. Is it something like “hacking”?
It’s odd that Japan gets virtually zero negative adjustments, but lots of positive ones.
Steve,
Thank you for your work in this area. I was surprised by several of your findings. To be honest, I am not sure I understand exactly what is going on yet. I am surprised the negative and positive adjustments seem to be about equal. If I remember correctly, some of the station histories looked at before showed Hansen adjusting the 1930s to be cooler and the 1980s and 90s to be warmer. I do not understand what physical theory would call for adjustments on both ends of a time series like that. I would have expected growing populations and urban centers to be adjusted for a growing UHI effect. A “negative” UHI effect would seem to be very rare occurence in the real world.
Regarding the question of why the US is more commonly adjusted than the ROW, I would like to speculate. Perhaps it is simply that the greater station density in the US allows for greater oppotunity for adjustment in the US. Hansen’s use of 1200 km radius for adjusting stations is completely nonsensical and open to mischief. Such a wide radius can cross over several different regional climates, some of which may exhibit temperature trends in opposite directions.
Keep up the good work!
How about this simple rule for finding “Good Stations”:
If anyone felt it needed to be adjusted, chuck it.
This gets around bias-via-cherrypicking while still not requiring a station-by-station investigation. The “no adjustments” map looks relatively well spread out (though biased towards North America.)
ROW = Residual Over Warming?
Hu–
Scraping normally just means downloading information on the web in it’s entirety.
Scraping copyrighted sites (which is pretty much any site) and reposting the information on the web would be a copyright violation. NASA could issue a formal takedown notice if Steve did that.
I don’t know why scraping NASA GISS data, or that available from any government agency, disseminated to the public on the web should be controversial. Maybe there is a problem, but I was under the impression US government owns the copyright on data created at US government agencies, and the US government permits the public to use it. This should include copying the numbers down and saving them on your computer at home.
But, I guess a lawyer might know more about this.
I somewhat uncertain about the use of positive and negative. Does this just mean that some of the data was adjusted up (positive) or down (negative) with no implication that the trend itself was increased or decreased? It would be interesting if you could split each site data in half and identify whether the positive or negative change was in the earlier or later parts of the data (or both). In other words do the changes increase or decrease trends or are they neutral.
“17 U.S.C. 105:
Copyright protection under this title is not available for any work of the United States Government, but the United States Government is not precluded from receiving and holding copyrights transferred to it by assignment, bequest, or otherwise.”
A “work of the United States Gevernment” includes any work by a government employee in the course of his employment.
So far it seems that “positive adjustments compensate for UHI effect to some degree, and negative adjustments exacerbate it. Positive adjustments are based on “nearby” rural stations, which often are not rural and suffer from UHI effect themselves. Thus real urban positive adjustments are underadjusted. Combine that with negative adjustments, and for sure UHI effect is not fully compensated in the global average, and in fact may be somewhat exaggerated. Wow! And Hansen et al get paid to do this? Murray
OK, then, what are the aggregate trends in each of your six (3×2) categories and what portion of these trends in each category are a function of the adjustments?
And, then next, what fraction of the aggregate world total trend is accounted for by each of the six categories?
If you can answer these questions, then this is exactly where Waldo will be found.
For a look at the past ‘scraping’ discussion see
Bob
OOPS. Link is http://www.climateaudit.org/?p=1584
One wonders how the stations were selected? I notice that Sweden does not have a single “long” site, though there is a large number of stations with long, high-quality temperature series in Sweden.
Easily Confused Engineer writes:
I understand / misunderstand instrument corrections to be applied so the corrected reading represents the actual physical state of the thing measured. I picture in 1900 a wooden shelter on the lawn of the sewage treatment plant (far) out of town. I can imagine the sun heats the shelter and the LIG thermometers inside are warmer than the air so you would want to apply a negative correction to the instrumental readings to get the actual temperature of the air. But what circumstances would lead one to believe the thermometers were ever cooler than the ambient air? Can anyone explain the physics of this?
Did the scientists of 100 years ago realize their thermometers were not accurately measuring air temperatures? Did they correct data? In what year did thermometer corrections like these begin? Did someone place a “gold standard” instrument next to one of these shelters and find some sort sf systematic difference that would justify adjusting all of the temperatures for a whole year? Century?
I’d appreciate any answer. I remain,
Easily Confused in Texas
Re: #4
It seems that people have forgotten the excellent work that John V did on comparing the best rural stations temperature record with the standard GISS record. His results can be found in post #91 in
http://www.climateaudit.org/?p=2124. As expected, the differences were on the order of 0.1 degrees.
Steve: This post surely demonstrates beyond any doubt that there are material differences in how the ROW and US are adjusted. When we reviewed this last fall, we observed that Anthony Watts’ investigations indicated that NASA results could be objectively preferred to NOAA results, which showed a much stronger trend in the U.s. (NOAA was th frontrunner on most “warmest” U.S. year press releases. Given the material differences in how U.S. and ROW results are calculated, it seems to me very much a bait-and-switch operation to jump from U.S. results to ROW results. They have to be evaluated separately. The U.S. is also not a spot check of the methodology because their is a very large core of relatively QCed rural sites in the U.S., relative to the ROW. If you have some results confirming ROW methodology, please share them with us.
Exactly. Which is why you can use NASA space photos freely and for commercial work if you’re a US citizen. Not sure about outside the US.
Ok, so the controversy was that an IT person felt Steve was violating the robots.txt file, and stopped him from downloading for a while. Then SteveM had to jump through hoops, but eventually got it.
I think, legally, complying with robots.txt is voluntary in the first place. SteveM evidently didn’t even know to read it. But, it is true that IT people routinely monitor and block when a single IP starts to download loads and load of stuff.
So… in the end. SteveM got the data as he should be able to. It’s public data and it’s not copyright.
There was a bit of an issue as to how to do it, but the IT people didn’t set up better ways. Maybe they should. Or maybe not. How often is anyone else going to want scrape the site to get all the data?
Steve’s probably the only person who really wants to.
Easily Confused Engineer also
wonders if anyone has a physical, climatological or instrumental reason the measured / computed difference between the air and the thermometer should change linearly (and stepwise) with time?
If there is such a mechanism, did anyone notice it change sign in 1980?
Until my mysteries are explained, I remain –
.. Easily Confused in Texas
ejramberg says:
Hmm, 0.1 degC on a 0.8 degC range is an error of 12.5%! Hardly insignicant. More importantly, the unadjusted data shows that the 30s in the US were clearly hotter than the last 10 years. So much more ‘unprecendented warming’.
#23. Scraping should be unnecssary. GHCN and USHCN have zip files containing all the stations – that’s how data should be available to researchers. Even after GISS agreed to let me have the data, they wouldn’t provide me with a coherent zip file, but preferred to make me tie up my computer for hours scraping the stations one at a time. I just let my computer run all night when I do this. My downloading was criticized in the usual quarters – Rabett, Lambert, who accused me of making a DOS attack on NASA.
#19 Ramburg. The comparison was with GISS continental USA which doesn’t really show any warming over the 30’s period, not with the whole GISS record. Also it was done when very few stations had been researched by Mr Watts, Iexpect the subject will be returned to.
Isn’t negative UHI adjustment an oxymoron? Anybody has an example of a valid negative UHI adjustment situation? If a surrounding rural region has a warming trend, how can an urban environment have a less warming or even a cooling trend?
Were the down adjustments evenly spread or predominantly in the 30’s-40’s? Similarly were the up adjustments evenly spread?
one of the causes of bipolar adjustment is that the GISS algorithm cannot handle jumps:
Peter says:
Plant a bunch of trees around a station. Extra cooling if you do this in Nevada and use extensive irrigation to keep the trees alive. Possible – but not very probable.
Re: #23
Raven –
The true systematic error in averaging temperatures is certainly greater than the 0.1 degree we are discussing. Steve has proven that to my satisfaction.
Nonetheless, given that level of error, you are quite mistaken in thinking a 0.8 degree anomaly is not that significant. That would be an 8 sigma deviation, which has a probability of much less than 1 in a billion of occurring.
Erik
If Steve Mc can do all this auditing and dicing and slicing of the data, and find missing site records, etc. all by himself (ok, a few posters helped a little), what excuse does that leave for HadCru and NASA for why they haven’t checked their own data and filled in the missing site records? Pitiful really.
Peter et al.
I asked for examples of negative adjustments a year of so back.
About the only thing offered was a station in the middle of a field where spray irrigation is done every day. I boldly assert that doesn’t happen much. Such a field probably would be rural not urban anyway. Perhaps a NonUrban Heat Island, negative class.
Other ideas welcome. The fountain at Rockefeller Plaza? Or those in Chicago? DWP in Los Angeles?
ejramberg,
As noted last year, JohnV simply accepted the designation of the sites as rural or urban. As the recent thread on Peru has demonstrated, many “rural” stations aren’t. And many rural stations have non-trivial UHI contamination as well.
UHI is a log function. Since “rural” sites have smaller populations, it’s fairly easy for them to have greater warming trends than a nearby “urban” site.
JohnV demonstrated that up to 0.1 of the 0.8 warming may have been due to microsite contamination.
There’s still issues with whether rural sites really are rural and just how much UHI contamination do they have.
There’s still the issue of how much of the warming is due to the sun.
There’s still the issue of how much of the warming is due to land use changes.
Plus others.
Peter #26 writes,
If an urban area lost population, it could lose its UHI effect, and justify a negative adjustment. Think Palenque between 1000 and 1800 AD. But the historical trend has been for most cities to get bigger, not smaller.
A 50% negative UHI adjustment could result if all stations, urban and rural alike, were compared to all their neighbors, and “homogenized” to have trends like their neighbors. The cities and sewage plants would get adjusted down (“postive UHI adjustment”), while the well-sited rural stations would get adjusted up (“negative UHI adjustment”).
Is there a correlation between the sign of the UHI effect and indicators (lights on etc) of whether the station is urban or rural?
What is the average UHI (in degrees per year, I suppose) of the positive stations versus negative stations? Ie, do the positives clearly outweigh the negatives despite their approximately equal numbers, or do they roughly offset?
any averaging of records between 2 sits does nothing to remove UHI. It simply spreads it across two sites instead of one …
#36. There seems to be an element of this process in the USHCN SHAP-FILNET adjustment.
RE 26. I am trying to Find a study that indicates that an Urban AREA will exhibit a COOLING TREND
relative to the average of ALL its rural neighbors within a 1000km radius. Its the Jackalope of climate science.
So far I have this.
1. Within the entire urban extent one can find COOL PARKS. But these parks are COOL relative
to the surrounding URBAN area, not cool relative to the outlying ( 1000kn away) rural Zone.
2. Some Urban centers, like Vegas, with lots of concrete may see Cooler TMAX, but again
TMEAN TREND is lower in the outlying rural areas.
I’m just not finding any climate science that says a whole urban area EXHBITS A COOLING TREND
relative to its rural neighbors. I’m not seeing any climate science on this. If there were climate
science on the city planners and green city wackos would be all over it.
I’ll wager that when the RURAL shows a warming TREND that exceeds the Urban trend you have
a THRESHOLDED Urban area ( log like effects) and a developing rural area.
@21
I’ve “scrapped” all GISS stations twice with a 15 line R script (based on CA’s read.giss function). There is no downloading problem as long as you put pauses in the loop which is completed in half a day. I’ll do it from time to time for my own versionning to check if there are changes in PAST temperatures (I know there are changes made at CRU since temperatures in the 60s and 30s are different in TAR and FAR !).
BTW : The whole GISS archive for dset1&2 is just 26 Mb and it’s annoying that the GISS doesn’t give it in a zipped format like NOAA. In our days when multi Mb videos can be downloaded on many free websites, the denial of service excuse from Rabet & co is ridiculous.
What about the UHI affect in the arctic … why not talk about that?
I’d rather talk about the UHI effect in the Antarctic.
re 10
Copyright is on presentaton not data. Thre is no copyright on data
If GISS is using the raw GHCN data for the Rest of the World, then they have not adjusted for the UHI.
There is only 1 positive adjustment in all of China while there are 6 or 7 negative ones. There are only 7 or 8 positive adjustments in all of Europe yet there are 25 negative ones.
It looks to me that the US (which does not exhibit warming over the last 100 years) and Japan have the reasonable UHI adjustment done but the rest of the Rest of the World has gone the other way (which is where the 0.7C increase from 1900 to 2006 orginates from.)
Smoking gun number 46.
RE 34. YUP! The other day I started looking for the most pristine sites.. I came upon
this, after sorting and resorting data. The MOST pristine rural sites are DESERTS!!!!!
( not chocolate torts or strawberry lawsuits, but the big sandy places that Jae loves
and puzzles over)
Now, the reaction most people have is ” how can you measure the hot place and call that fair??”
Simple!
I do the anomaly dance. Its the TREND my friend. The best place to measure the CLIMATE TREND is in a location that has a low probability of seeing NONCLIMATIC SIGNALS.
Second best place to measure the climate TREND?????
Urban areas where the UHI signal is at saturation levels!!!
And now, Moshpit has suggested that the best place to measure the climate trend is
in the desert and in the city.
I duck out while the fruit flies.
To pelt Sir Mosh #46,
with a few date pits, the two sites Steve McI cites (in the next thread) with legitimate negative UHI’s are Dubai and Abu Dhabi:
http://www.isprs.org/commission8/workshop_urban/frey.pdf
Both urban and rural areas are affected by anthropogenic factors – UHI and land use changes. Nor is the size of the anthropogenic rural versus urban effect related to the number of people. A farmer is clearly going to have a potentially much larger local effect than someone who lives in an apartment.
At best all you are going to get by adjusting one with the other is some kind of average of the two. The only solution is to use data from locations remote from most human activity – lighthouses, islands with minimal population, relatively pristine parks, etc. This would at least give us a baseline to determine how large the urban and rural effects are.
Re 48. Did you cheat and get an advance copy of that? Still, I think my point holds. If you
want to measure the TREND, you have to pick places utterly pristine, or utterly saturated.
That’s my daily rant. Oh, Relative to another thing we chatted about. Using the rural to
adjust the Urban should buy you nothing. 10 rural sites adjusting 1 urban site, doesnt get you
11 independent sites.
RE 50
Could this be why the temps are dropping? We’ve reach saturation in the urban centers? :-^
K says:
They put so many of these stations next to air conditioner exhausts that its probable that at least one of the air conditioners has been installed back to front 🙂
Steven Mosher writes, # 50,
No, I hacked it fair and square. Steve’s link didn’t work, but had “http://climateaudit.org” before the other “http://…”, so I just erased the first part and got a valid site. This sometimes happens with WordPress — it’s safer just to write the HTML link yourself than to use the automatic tags.
But I would never lower myself to scraping, whatever that is!
Right — it just gets you 10 rural sites. Likewise, 1 rural site adjusting 10 urban sites just gets you 1 rural site.
All this obscures the fact that the UHI effect is a legitimate environmental problem. Since it has nothing to do with CO2, IPCC and CDIAC (Carbon Dioxide Information and Alarmism Center?) do not concern themselves with it, but someone should!
RE 53. I’m so glad you reinforced my intuition that this adjustment approach doesnt
really buy you anything from the statistical side of things. It’s been very fustratating trying to
communicate this to people.
As I’ve scanned the UHI literature this past few months I’m a bit puzzled at why hansen thinks
a categorical variable such as population less than 10k or nightlights = 0 can do any justice
to this phenomena that evolves over time and space.
Personally I would have just gone for the most pristine sample and lived with the big ass CI
hey maybe I will do a chart of the 18 desert stations in the US
re: cooling and the UHI.
I do remember a little more. Peterson (2003) concluded the UHI effect was not of consequence. (Of course it’s better to read it and decide for yourself what he concluded. Steve has a discussion indexed in UHI)
Anyway (and this was all conjecture) UHI heat caused air to rise about the city. That drew in cooler air at ground level from nearby areas. So not only was the UHI effect limited but the surrounding area might actually be cooled by the artifical wind flowing to the city.
Oh, the wind also cooled the city rapidly at night so there was mimimal elevation of nightly temperatures too.
I don’t buy it but what can be proved? That would take another study.
RE 48. Thats a nice paper. One thing I forgot to note is I would also exclude Coastal sites.
So desert coastal doesnt make it through my filter..
I find it interesting that Australia has several negative adjustments for inland towns (and squinting, maybe some positive adjustments on the SE coast). Steve, if it’s not difficult, could you ID the Australian sites with negative adjustments?
It’s also puzzling that there no or very few stations with “long” records. Australia has a relatively high quality network, and there are many sites that have records that go well back into the 19th century. Maybe Warwick Hughes could chime in?
re: 52
K,
I have not been impressed by Peterson’s papers. Roger Pielke refuted Peterson’s 2006 paper here. And Steve McIntyre pretty well debunks Peterson’s 2003 paper here.
Does UHI play any role in the warming observed in the arctic or over the seas?
Steve: No. We’re discussing Hansen’s paper here. We’re not discussing warming – it’s obviously warmer than the 19th century – we’re trying to understand exactly how the quantifications arise.
FWIW, I was on Open Mind and read this claim from one AtheistAcloyte
I responded with:
The reply:
A little bird tells me that the information would not be forthcoming. But, FWIW, if I can acquire his email I am willing to give it a shot.
re: 55. I wasn’t impressed either but lack the background or time to wade into Real Climate Science with a capital R.
One problem with the 2003 paper was which sites are Urban and which Rural. Peterson used information from Owens and Gasso. The same Urban/Rural question was also, I believe, the basis for objections to Peterson’s 2006 paper.
In #32 and #55 I was tossing ideas, some quite odd, back to Terry about why there might be negative UHI adjustments. I can’t even recall where I heard each.
#57. If someone is using a statistical methodology (as these adjustment methodologies are), then the statistical properties should be demonstrated independently of the data set where the methodology is to be used. We’re gradually pinning down exactly what GISS did – and because they’ve had to put their code online, eventually we’ll sort out exactly what they did and what its statistical properties are. Soon it will be time to try to figure out what CRU, NOAA, USHCN, GHCN do.
SCRAPE?! Sir! I do not “scrape”. I … copy from website into Word, convert to Normal, and paste into Excel in defense of the preservation of scientific data. (Glad we cleared THAT up!) #B^1
#54. James, happy to oblige. The extraction is easy since I’ve collated the adj_min and adj_max as fields in the giss.info.dat data set online at CA/data/giss. Here’s the extraction script below. There are 20 “bipolar sites” shown first, 23 negative non-bipolar and 29 positive non-bipolar sites.
BIPOLAR
temp=(giss.info$country==501) &(giss.info$adj_max>0)&!is.na(giss.info$adj_max)&(giss.info$adj_min<0)
sum(temp)#20
giss.info[temp,c(2:3,8,10,23:28)]
tempbipolar=temp
id site urban lights length_adj start_raw end_raw length_raw adj_min adj_max
5400 50194312000 PORT HEDLAND S A 60 1948 2008 61 -0.1 0.3
5450 50194403000 GERALDTON AIR S B 67 1941 2008 68 -0.1 0.1
5505 50194551000 TOOWOOMBA COM U C 62 1931 1992 62 -0.1 0.3
5570 50194637000 KALGOORLIE BO S C 68 1939 2008 69 -0.3 0.2
5584 50194660000 PORT LINCOLN S C 71 1922 1992 71 -0.1 0.2
5592 50194669000 PORT PIRIE S C 71 1922 1992 71 -0.5 0.2
5641 50194719000 DUBBO S B 112 1881 1992 112 -0.7 0.2
5647 50194726000 ORANGE AIRPOR S A 25 1968 1992 25 -0.1 0.2
5661 50194741000 LITHGOW S C 73 1912 1992 73 -0.3 0.9
5679 50194773000 ARMIDALE S C 109 1881 1992 109 -0.5 0.5
5686 50194784000 TAREE S C 75 1910 1992 75 -0.3 0.4
5692 50194791000 COFFS HARBOUR S C 57 1943 2008 59 -0.3 0.3
5695 50194802001 ALBANY (ALBANY TOWN) S C 85 1881 1965 85 -0.3 0.4
5746 50194865000 LAVERTON AERO U C 63 1943 2008 64 -0.4 0.1
5789 50194926001 QUEANBEYAN (BOWLING CLUB) U C 48 1909 1956 48 -0.3 0.5
5811 50194968000 LAUNCESTON AI S B 68 1939 2008 68 -0.3 0.3
5814 50194970001 HOBART REGIONAL OFFICE U C 110 1882 1992 110 -0.1 0.4
5818 50194975000 HOBART AIRPOR U B 50 1958 2008 51 -0.1 0.2
5862 50195678001 BELAIR (KALYRA) U C 68 1900 1992 68 -0.2 0.3
5892 50195871000 LEMNOS S B 26 1965 1992 26 -0.1 0.7
NEGATIVE
temp=(giss.info$country==501) &(giss.info$adj_min<0)&!is.na(giss.info$adj_min)&!tempbipolar
sum(temp)#23
giss.info[temp,c(2:3,8,10,23:28)]
id site urban lights length_adj start_raw end_raw length_raw adj_min adj_max
5386 50194287000 CAIRNS AIRPOR S C 101 1907 2008 102 -0.5 0
5412 50194326000 ALICE SPRINGS S A 61 1881 2008 128 -0.2 0
5415 50194332000 MT ISA AIRPOR S C 42 1966 2008 43 -0.3 0
5432 50194367000 MACKAY S C 55 1951 2008 56 -0.1 0
5433 50194367001 MACKAY SUGAR MILL STATION S B 74 1908 1992 74 -0.9 0
5516 50194568000 AMBERLEY AERO U C 52 1941 1992 52 -0.8 0
5524 50194578000 BRISBANE/EAGLE FARM AUSTRA U C 59 1949 2008 60 -0.6 0
5531 50194586000 LISMORE S B 86 1907 1992 86 -0.6 0
5587 50194664000 WHYALLA S C 38 1955 1992 38 -0.8 0
5589 50194666000 PORT AUGUSTA S B 31 1962 1992 31 -0.2 0
5596 50194672000 ADELAIDE AIRP U C 127 1881 2008 128 -1.0 0
5612 50194689000 BROKEN HILL S C 97 1891 1992 97 -0.7 0
5614 50194693000 MILDURA AIRPO S B 62 1946 2008 63 -0.3 0
5653 50194730000 BATHURST AGRI S C 74 1909 1992 74 -0.4 0
5668 50194748000 WOLLONGONG U C 23 1970 1992 23 -0.4 0
5670 50194750000 NOWRA RAN AIR S A 38 1955 1992 38 -0.2 0
5694 50194802000 ALBANY (ALBANY A.M.O.) S C 47 1961 2008 48 -0.6 0
5735 50194852000 BALLARAT S C 85 1908 1992 85 -0.8 0
5752 50194870000 MOORABBIN AIR U C 22 1971 1992 22 -0.1 0
5777 50194910000 WAGGA AIRPORT S B 66 1942 2008 67 -0.7 0
5860 50195676000 EDINBURGH M.O U C 21 1972 1992 21 -0.2 0
5861 50195677000 PARAFIELD AIR U C 38 1939 1992 38 -0.1 0
5878 50195762000 TAMWORTH AIRP S B 86 1907 1992 86 -0.7 0
POSITIVE
temp=(giss.info$country==501) &(giss.info$adj_max>0)&!is.na(giss.info$adj_max)&!tempbipolar
sum(temp)#29
giss.info[temp,c(2:3,8,10,23:28)]
id site urban lights length_adj start_raw end_raw length_raw adj_min adj_max
5332 50194120000 DARWIN AIRPOR U C 46 1882 2008 127 0 0.1
5390 50194294000 TOWNSVILLE AM U C 68 1940 2008 69 0 0.3
5436 50194374000 ROCKHAMPTON A U C 67 1939 2008 68 0 0.2
5445 50194387002 BUNDABERG POST OFFICE S C 84 1907 1990 84 0 0.5
5517 50194568001 IPSWICH COMPOSITE U C 69 1913 1992 69 0 0.8
5520 50194571000 GRAFTON S C 27 1966 1992 27 0 0.1
5523 50194575001 BRISBANE REGIONAL OFFICE ROOF U C 100 1887 1986 100 0 0.7
5525 50194578002 SANDGATE U C 55 1913 1976 56 0 0.7
5526 50194579001 ORMISTON (REDLANDS) H.R.S. U C 24 1953 1992 28 0 0.2
5527 50194580001 SOUTHPORT U C 54 1938 1991 54 0 0.4
5541 50194605001 MANDURAH (MANDURAH PARK) S C 78 1900 1985 78 0 1.0
5542 50194608001 PERTH (PERTH REGIONAL OFFICE) U C 96 1897 1992 96 0 0.9
5543 50194610000 PERTH AIRPORT U C 65 1944 2008 65 0 0.5
5673 50194764001 PROSPECT DAM SEE 56 U C 25 1965 1992 25 0 0.4
5674 50194765000 BANKSTOWN AIR U C 25 1968 1992 25 0 0.1
5675 50194767000 SYDNEY AIRPOR U C 69 1939 2008 70 0 0.9
5676 50194768000 SYDNEY U C 112 1881 1992 112 0 1.6
5681 50194774000 NEWCASTLE U C 112 1881 1992 112 0 0.3
5683 50194776000 WILLIAMTOWN U B 59 1942 2008 60 0 0.1
5688 50194787000 PORT MACQUARI S C 86 1907 1992 86 0 0.9
5708 50194821000 MT GAMBIER AI S A 66 1942 2008 67 0 0.6
5739 50194855001 BENDIGO PRISON S C 35 1957 1991 35 0 0.3
5740 50194856001 GEELONG (NORLANE) S C 23 1970 1992 23 0 0.4
5749 50194868000 MELBOURNE U C 112 1881 1992 112 0 1.4
5753 50194871001 MORNINGTON POST OFFICE U C 46 1919 1975 46 0 1.0
5775 50194907000 EAST SALE AER S B 63 1945 2008 64 0 0.1
5788 50194926000 CANBERRA AIRP U C 69 1939 2008 70 0 0.5
5805 50194958001 BURNIE (ROUND HILL) S B 45 1944 1992 45 0 0.8
5872 50195750000 LIVERPOOL U C 31 1962 1992 31 0 0.4
RE: #40 No need to duck out at all, Steven. Just go: http://www.john-daly.com, scroll down to “Station Temperature Data”. and find Death Valley as well as several other stations in the region. There are lots of desert stations in Australia with records starting before 1900 like Alice Springs.
Re # 54 James Lang and 61 Steve
The Australian Bureau of Meteorology sells a CD for a few tens of dollars that has daily max and min temps for all of the stations listed by Steve in # 61. (There are some 1200 stations on the CD.) The distribution of Steve’s long-term listed urban stations does not at all reflect the distribution of population. Many, like Ballarat, Mt Isa, Broken Hill, Kalgoorlie are old mining towns dating back to about the 1880s, barely making the 10,000 population cutoff in years of bad metal prices. The date of each record start is in the tables of #61. The date that each place changed from rural to urban is less documented.
The worrying part is that I can envisage no reason why there is a mixture of urban positive, urban negative and Nil. The Pos and Negs seem to have no rhyme nor reason – it is as if they are all in a large noise envelope and the toss of the dice throws them in one class or another. The near-coastal and land locations are about equal in number in the Neg class. Coastal outnumbers land by 2:1 in Pos class. Proximity to sea had got to have an effect on climate, yet it hardly shows in these figures.
Steven mosher at #110 in “Cobija, Then and Now” notes some snipping of Austraian stations, usually deleting records prior to about 1900. I suspect this is only because the data have large gaps in the early days, but I don’t know.
I have no idea which data is sent by Australia to CRU or GISS, etc. – whether it has already had some adjustments, whether meta data go with it, or whether it is raw. I have no idea if CRU and GISS make changes that have already been made, or apply algorithms with different factors – I have asked BoM and got no sensible reply. Therefore, I seldom quote Australian data because I do not know its origins, manipulations or reliability and I suspect few others do either.
A high quality set of stations has emerged for Australia, mainly based on isolation from obvious heat island effects. Many are at small airports and many are at lighthouses. In going for high quality, many of the long-term stations have been deleted and the record seems to start for practical purposes about 1950.
My polite recommendation would be to avoid spending too much analysis time on Australian temp data until there is a clear exposition of the adjustments that have been made to it.
You can get this data station by station if you send the BoM some money, as if they were private consultants engaged to traffic in it. Heck, it’s already paid for by the taxpayer. They act like they don’t want to be bothered by auditors.
1921 stations in the usa?
steven mosher says:
Perhaps the explanation is here:
http://data.giss.nasa.gov/gistemp/sources/gistemp.html
#64. Steve Mosh, in addition to the 1221 USHCN stations, GISS uses other sources for US data which have not received the same quality control (700 stations or so). These include stations in the MCDW network, the Summary of Day network and GHCN.
Steve McIntyre says:
Yet these sources are not listed on the GISS ‘sources’ webpage. Did they show up when you downloaded the raw data?
I’ve been able to track a probable source for the MCDW data but the Summary of the Day provenance and the reasons for station selection is stil unknown to me.
A couple of you have misstated the proportion of adjusted stations in the U.S. over at Tamino. There are 1221 USHCN stations, but GISS has 1921 stations. The proportion of adjusted stations shown here is the proportion of 1921. It has nothing to do with ROW.
ejramberg writes:
You should keep in mind:
* John V.’s validation applied to the USA48.
** It showed GISS to be more accurate than NOAA, which suggests in part that the lights methodology (applied only to the USA) is superior to the rural/suburban/urban designation.
** Does not validate the ROW trend. ROW trend is ~0.8C/century versus ~0.4C/century for the USA.
* Lights methodology may still be flawed because John V relies on existing metadata.
Steve McIntyre:
I think it is a mistake to think that, because a station doesn’t get adjusted, it is a “good” station. Think of the many isolated areas that cannot be properly adjusted because of a lack of other rural stations close enough, or the stations that are thought to be rural (like a couple in Peru) and really are not.
RE 19. Sadly eric JohnVs work was done before we figured out that Rural was not Rural
and that Nighlights ( Gisscode=1) designated Nasa’s view of the best stations.
There are two questions:
1. Do CRN12 show a smaller warming trend than CRN45
2. Is Gisstemp reasonably accurate.
two different Qs
re 69. I posted a correcttion, see if it gets through
Re: the urban cooling in Abu Dhabi and Dubai paper
The paper concludes the cooling results from urban vegetation (transpiration). Its an urban irrigation effect.
Bear in mind these places have very high per capita energy consumption. At least twice that of the USA and some sources say substantially higher.
The paper is interesting in that even in an urban area (at least hot arid urban areas) irrigation has a bigger impact on temperatures than albedo or energy dissipation as heat.
In Australia irrigation, both urban and rural, is very widespread and occurs in places perhaps you wouldn’t expect. For example, I was once in Wittenoom, a supposedly abandoned asbestos mining town in a remote location, and irrigation sprinklers were running at several locations. Further, in recent years most Australian cities have sharply reduced the amount of irrigation allowed. I suspect a large proportion of Australian sites are affected by this irrigation effect and the trend won’t be simple.
St. mosh, you can answer this one if anyone can.
What CRN-1 & 2 data did John V use? Did it have FILENET adjustments? What about SHAP?
I would guess that if any data had been filled in from nearby stations or if the data had been in any way homogenized, the whole deal is kaput. Because 6 out of 7 stations have severe site violations and any mixing or filling in would fatally compromise the data.
Outliers and TOBS are a different kettle of fish.
But your comment seems to imply that the USHCN version might have been used.
Was John V’s data semi-raw or was it “adjusted” in any way?
re 75. I’m not sure, I’m pretty sure it had TOBS. Filnet and shap both add warming as best I can recall. This whole point may become moot with USCHNv2
Well I think it’s a pretty big deal. FILENET and SHAP like so totally dumb down the difference between a station and its surrounding stations.
Maybe the whole equation is moot, but the whole AGW community adduces the John V study without fail every time CRN site violations are mentioned. So I’d at least like to know what datasets were used.
And I wonder what those results would have on Anthony Watts’ project. He posts the USHCN graphs. [snip]
If it weren’t, St. Mac wouldn’t have picked up the Y2K error in the first place. And if the Rev were using the semi-raw stuff to compare surface stations, I bet he’d get an even greater differential than he’s getting now.
I think we are missing a trick, here.
RE 77. The Issues I have with SHAP and FILNET are twofold.
ISSUE #1. We hear over and over that microsite issues are likely to be Positive and Negative
with Mean equals 0. In short, for every microsite warming issue there is a microsite cooling issue
and therefore it all evens out. Go away dont bother us. Lets call this EVEN STEVENS. If that’s true,
then shouldnt station moves be likewise distributed? Couldn’t I argue that station moves
should sometimes be positive and other times be negative and it should all just wash out?
But Station move adjustments add heating to the record. Doesnt that fly in the face of this
“microsite issues zero out” hypothesis? Doesnt the fact that SHAP adds heating to the record
give you pause WRT to the claims that “these microsite issues are both positive and negative
with mean zero”
Same issue with FILNET. I have no idea why these guys think that filling
in missing data actually gives them any more real information, REAL information. FILNET corrections
one would assume, under the EVEN STEVENS hypothesis would be Zero mean. Are they? IF not why not?
2. Issue 2. Filnet and shap and other adjustments are applied to one portion of raw data
based on another portion of raw data. The assumptions of independent sampling are destroyed
by this. ADjusting buys you nothing except an artificially low CI
sTeven moSher says:
Of course not. The models say we should be warming so any cooling bias must be agressively identified and corrected. Warming biases are not an issue because they are in line with what the models say.
You see the same attitude in the other datasets:
1) sea surface – buckets add a warming bias in older data – must correct agressively
2) MSU – dirunal drift adds a colling bias must use models to correct
3) ocean temp – sensors reporting cooling must be in error – remove from record
4) radiosonde – data does not match model – must correct cooling bias which is predicted by the models.
Are there any examples of data corrections that have the effect of reducing the reported warming?
Steve: Sure – adjustments to Phoenix and Tokyo by NASA.
If I say the errors the zero mean, then you prove me wrong!
Then you write a paper!
Shouting makes this true of course.
hehe
The question remains:
Was John V using USHCN adjusted data or not? This is an important question.
The JV study is about the differences in the CRN1 delta and the CRN5 delta. FILENET and SHAP minimize these differences. So we must know if JV used data that included those adjustments.
Yes or No?
re 82. Go to his site, download the stuff and figure it out. or send him an email.
There are dozens of ways of looking at the data. In fact, I could construct a method
that would show global Cooling in USA over the past century.
I’ve been away but I saw my name mentioned. I don’t have time to read the whole thread right now. If there are some pertinent questions for me, please re-post them and I’ll do my best to answer (between real-life commitments).
My USA48 temperature analyses were run with two data sets. The early ones used USHCN raw data. The later ones used USHCN TOBS data (time-of-observation adjustment). FILNET and SHAP data were not used. There was some confusion when I was accused (more than once) of actually using the adjusted data. (The name of the accuser is not important — it was not Steve McIntyre or Anthony Watts or any current regulars).
The rural stations for the CRN12 analysis were selected by me and verified by this community. My original list of ~25 rural stations was reduced to 17. (The other 8 were in towns or at airports). That is, the rural stations in the CRN12 analysis were and are truly rural. I did not rely solely on metadata to select them.
I believe I selected my list of CRN3 rural stations directly from the GISS ‘R/S/U’ ratings. They have not been verified.
At some point I would like to update the analysis with a larger set of “approved” rural stations with site quality ratings of 1 or 2. It would also be interesting to evaluate UHI and micro-site issues using the network of high quality sites identified by SurfaceStations.
As always, it should be noted that I only got as far as looking at USA lower-48.
Evan Jones said:
No tricks. (So please, no accusations of tricks).
My data and code are still available. Download them. Test them.
Let me know if there are problems and I’ll get them fixed.
steven mosher:
Thanks for attempting to answer in my absence.
John V:
Thank you for your answer.
BTW, the missing a trick comment was NOT directed at you. No accusations. You have always operated in the open, and I admire that. I hereby apologize if you took any offense; none was intended.
It was in reference to the fact that “we”, not you have been using the standard USHCN data that is adjusted, and that if we had been using semi-raw data the differences would have been greater.
BTW, it seems correct that TOBS errors and outliers should be removed.
John V:
BTW, I asked the same question over on Watts Up.
As you have answered, I have posted over there and made it very clear that you did NOT use SHAP or FILENET data.
Sam,
Under what scenario would heat measured at location X at 1.5m be transported and measured at site Y at 1.5m?
Evan Jones:
Thanks for clarifying the “trick comment”.
#33 MarkW:
See my clarification above re the stations used.
Conard; not sure what you mean.
Um, go out and measure at time spots 1 meter away from each other for 100 meters at .25 1.5 and 3 meters each. (Imagine some weird machine that measures them all at once)
Are all the readings the same?
#88 Evan Jones:
I appreciate that. Thanks.
I appreciate your openness. If all scientists on both sides of the debate operated in the manner that you do, I bet we would have all this cleared up in a jiffy one way or the other (or somewhere in between).
Assume there is a surface station downtown Chicago measuring air temperature at a height 1.5meters.
Assume there is a surface station 100k downwind measuring air temperature at a height of 1.5 meters.
Assume Chicago is adding additional heat to a volume of air.
What would the conditions have to be so that the heat in the volume of air measured in Chicago would reach the downwind station and effect its measurement at the same 1.5meter height. I am probably naive but I imagine the heat would tend to rise. Even assuming a perfectly horizontal motion it would seem that the temperature would diminish as a function of time and distance.
I am not suggesting that you are wrong. I am saying that I do not understand the details of your comments here #87.
http://www.msnbc.msn.com/id/7668511/
Several thoughts on this:
1. The fact that there is not much difference between the rural-only and the UHI adjusted GISS data is often said to show the success of the algorithm in removing UHI. But the nearly equal numbers of negative and positive adjustments leads to a very different conclusion … which is that the algorithm on average didn’t do much at all except distort the record.
2. Along with other posters, I question the logic. One of the reasons we are doing all this is to measure the trend. If we take a subset of the data and say “we don’t like your trend, it’s affected by other variables”, it seems to me that we can do one of two things:
a) Throw it out, or,
b) Correct it by some independent means.
If all we do is change the trend of the data to the trend of the neighbors, we actually lose ground, because we have not increased the amount of data but we have increased the amount of data points … which means that the information per point must decline.
I’m still very interested in the length of time the adjusted data do not have adjustments in recent years. I asked on the Tokyo thread and got nowhere … anyone know? In Tokyo, it appears there have been no adjustments in the last thirty years … is this common, rare, or what?
w.
Excuse me a couple of thoughts about UHI. First the anecdotal. A couple of years ago I was listening to a Sydney talk-back radio station and an interview with an “expert” talking about the grim consequences of global warming. The host invited callers with the question “how has Sydney’s climate changed”? To my amusement, numerous callers, to a man (or woman) agreed that Sydney used to be much hotter. Many of the callers were – ahem – senior citizens, in line with this radio station’s demographic.
It also made me wonder why people might have thought that Sydney used to be much hotter. If you look at landscape photos of Sydney from the 1920s – 1940s, one of the most striking features is how few trees there are compared to today. If you look at this painting from 1855 of Neutral Bay (the site of my apartment is in this view) there are no trees at all! Between the arrival of the First Fleet in 1788 and 1855 the landscape around the harbour had been completely deforested.
http://www.menziesartbrands.com/cgi/dmcat.cgi?rm=display_lot&item_id=6299
The same view today is crammed with trees. In fact, vegetation-wise, Sydney Harbour today probably more closely resembles pre-settlement Sydney than at any time since 1820, particularly the re-forested headlands.
I wonder if Sydney might have experienced a true negative UHI effect due to reforestation between say 1900 and 1970. The temperature record (station about 3km from the site of the painting) would support this view, but of course part of this period is a known time of global cooling.
The station of record is Observatory Hill, which is on the headland which “launches” the southern end of the Sydney Harbour Bridge. It’s a lovely park these days, shaded by massive fig trees:
http://allrite.net/webworld/node/635
As you can see, in 1871 the site was completely bare:
http://www.sydneyobservatory.com.au/exhibitions/history.asp
For anyone that’s still interested, Warwick Hughes has an interesting discussion of Phil Jones’ treatment of the Sydney temperature record, written in 2000. I’d note that Sydney Airport has developed substantially since then, and temperatures there today are almost always higher than Observatory Hill.
http://www.warwickhughes.com/climate/sydney.htm
Sorry for the long post, but I hope it illustrates some of the problems in evaluating urban temperature records.
Re # 95 Willis Eschenbach
What worries me more is that adjustments to trends initiated on pre-1990 data have continued to exert themselves to the present. Or will be applied automatically or uncritically as post-1990 data are added into upgrades.
I suspect that some of the hinge points to trend data calculated pre-1990 would look quite different now that later data are available, as per the page Cobijo, than and now, about Peru.
re 95:
That’s because population of Tokyo stopped growing in 1965. Population in downtown Vienna stopped growing in 1780. 😉
#98
Hans, do you mean it is reasonable to make such adjustments over the whole world without case to case analysis? Wouldn’t it be better to go through the rural station list, select the best in collaboration with local institutions (because there are or may be Theses done about local correlations, homogenizations or station histories influencing records) and use the urban ones only in case when they harbor a valuable long series and have truly rural local correlating stations? I suggested that much at Tamino’s blog, but got censored.
Thanks willis. I’ve tried to articulate why adjusting buys you nothing from an information
point of view. you did it better
conard: “What would the conditions have to be so that the heat in the volume of air measured in Chicago would reach the downwind station and effect its measurement at the same 1.5meter height. ”
There are two different issues here. I’m not saying the first is responsible for the second.
First is whatever heat is produced in the Chicago metro area is added to the atmosphere, which goes other places in the atmosphere. Or in other words, adds energy at various locations and heights other than just “in the bubble”.
Second is that point X and 100 or 1,000 or 10,000 meters (or whatever) away at point Y are probably different temperatures at any given single time. For whatever the reason (wind, rain, clouds, surface, site biases, sensor accuracy, etc).
I’m not saying the heat produced in a large metro area someplace causes the temp difference at a spot 1.5 meters off the ground elsewhere is directly affected by the first in some causal link.
I judge that it is important when using the USCHN data sets to be very much aware of what it is that they represent. I used the Urban, or most adjusted data set for my analyses of the CRN12345 station trends. As I recall, the Urban adjustment is small when comparing the Filenet data with the Urban adjusted. I would think that any basic analysis should start with the most corrected and work backwards until it can be shown that the adjustments were incorrect or inconsistent within the analysis.
The TOBS adjustment is large and could change an analysis result. The USCHN data sets that precede the Filenet and Urban progressive adjustments also are not compensated and adjusted fully for missing data and data that are obviously wrong or suspect.
The CRN station data used in the analyses going back to the time that A Watts first reported it had very sparse numbers of stations for CRN12 and therefore a CRN12 comparison with the other CRN stations rated by Watts and team made comparisons with any statistical significance problematic. I found that arbitrarily dividing the CRN ratings into CRN123 and CRN45 gave what I estimated to be statistical significance and showed a difference in trends within this station comparison.
As one looks at these station to station temperature trends one sees the large differences in stations even when compared with close-by and stations within the same CRN rating group. Also noteworthy is the change points in the trend differences between CRN123 and CRN45 that one can visualize with periods of relatively large differences and periods of little or no differences.
Even the most adjusted USCHN data set has progressively increasing amounts of missing data as one goes back in time which in my mind makes long term comparisons tenuous. Also with the large station to station variations, I find that a comparison of a few rural CRN12 stations to the entire data set a very problematic endeavor with regards to determining statistical significance.
As a disclaimer, I must note that my analyses were not on the level of that of one from a trained statistician. My Monte Carlo simulations to determine statistical significance did not take into consideration auto regression and I am not sure that that is a consideration for the way I did my analysis. The change points were done visually and would need to be performed with correct statistical procedures to be meaningful.
#102. Kenneth, I would strongly discourage the use of FILNET versions for this type of analysis. Whatever the stated purpose of FILNET, it appears to me to end up using lower quality stations to adjust higher quality stations and this defeats the purpose of identifying CRN1-2 stations in the first place.
Re: http://www.climateaudit.org/?p=2815#comment-220727
As a first effort in looking for differences between grouped CRN station ratings I used the fully adjusted data with the idea that if the effect you are noting here was large and I could see differences those differences had to be larger than any adjustments going against those trends.
I need to review my old analyses to be certain, but as I recall I also made similar comparisons with data sets adjusted through TOBS and they gave nearly the same differences between the CRN123 and CRN45 groupings. The problem that I saw with the TOBS data set was that it had missing data that was not filled-in in the progressively more adjusted data sets and it also had suspect data included that evidently were not used in the fully adjusted data sets. My point here is that given the questionable adjustment processes and the lack of adjustments I could not readily choose which data sets were the best and decided, therefore, in favor of the “official” set.
Why is the preferred comparison between one set of adjusted data (with CRN12) and another set of adjusted data?
This ties into the questions of Wills(96) and Steven(100).
Instead of treating this as something that has both a positive and a negative, what if we treat ‘adjustment’ as an absolute value quantity?
Sort the entire list of stations based on “total size of adjustment” aka the integral of the absolute value of the adjustment. Now plot the quality information as a scatterplot with categories as the x-axis.
What we should get, in a properly arranged adjustment scheme, is a zero adjustment for all the CRN1-rural stations. And a substantial adjustment for all the CRN5-urban stations.
A plot of this style would seem to tie all of the station oddities (except discontinuities) into a single plot. Outliers on that plot need attention. CRN1 with a high adjustment -> why? CRN5 with a low adjustment? Want to answer the question of whether rurals are adjusting urbans? Add the rurals, add the urbans. All values are positive, so you can tell which is getting adjusted more.
Switching from ‘difference from average’ to ‘absolute value of difference from average’ should allow some examinations on a whole-set basis.
Steve said:
Some readers have wondered why Hansen doesn’t simply use the “good” stations in his index – and I must say that this question certainly crosses my mind as well.
Well, can someone do this to see the magnitude of the difference of adjusted to unadjusted? Perhaps the adjustments are wrong, but do they change the answer?
If we don’t know the quality and quantity and the specifics of the adjustments, how could we tell if they were right or wrong or changed the answer or not (unless we already knew the answer).
In the lack of evidence to the contrary, it seems “wrong adjustments=wrong answer”.
So “unknown adjustments=unknown answer” at best.
Sam,
What I meant was is there a difference between the 2 answers (or a change from the published answer).
Re: http://www.climateaudit.org/?p=2815#comment-220799
Auto regression, auto regression!!! Should have been auto correlation — of course.
I plan to look at CRN12345 in the USCHN Urban data set versus the data set in the adjusting progression just before Filenet which is MMS, I believe.
I think it is time to bring out this USCHN adjustment graph again. The TOBS adjustment looms large on the graph as does the SHAP adjustment. I believe that it is the SHAP adjustment that is large and suspect in this discussion and therefore we need to make the comparison that I suggested between the MMTS progressively adjusted data set and the Urban data set for CRN12345 rated stations. I have MMTS data, but I must now go back and verify that it does not include adjustments beyond that stage.
jax; if I put out two different bits of information in formats that look the same but are not (lat/long in GPS 60ths of a minute vs decimal DMS, locations using different datum etc) then I could have two different numbers that are both correct.
I don’t know the answer to your question though, sadly. Even more sadly I don’t know that anyone does.
🙂
Not sure if this is correct thread, but could be linked vis-a-vis “land use”. On GISTEMP, station selector map, I clicked on China. Came up with list of 32 stations starting with Wanyuan and ending with Nanyang. Only two of these stations had data beyond 1990. Most started about 1950 and ended 1990. Most of the stations had a downward trend in temp. The two stations that went beyond 1990 started uptrends right about 1990. About half the stations on the list were rural and half cities below 100,000 population. One city, Chonqing, population 3,500,000. Anyone with thoughts on why China would buck the trend of the ROW? Largely agrarian society until recently, with little land use change except in major cities? Lots of particulate matter in the air from 2 billion cooking fires?
Cheers.
The graph below shows the long term trends with the progressively adjusted USCHN data sets that I should have included with the graph above showing the differences by data set.
The assumption made by hansen, peterson and jones is that microsite issues will zero out.
you will some that have heating effects and others cooling.
The same should be true for SHAP, but its not.
the same should be true for TOBS, but its not.
the same should be true for FILNET but its, not.
So why assume that microsite differences should even out.
The clear way to test this is by looking at CRN12 versus CRN5.
That will give you your most powerful test.
A secondary question is what happens to the trend of giss when you drop out the worst stations.
I expect you’re all aware that in the exciting world of accountancy we make use of Cooke’s Variable Constant
C = Ng – Nw where Ng is the number you’ve got and Nw is the number you want.
Clearly such a valuable information management tool also has important applications in climatology.
Steve Mc says in the para above the map CONTINUING STATIONS: NO URBAN ADJUSTMENTS:
…there are a LOT of stations which aren’t adjusted and that, even if you didn’t use any of the adjusted stations, there still would be a lot of stations in the index. Some readers have wondered why Hansen doesn’t simply use the “good” stations in his index – and I must say that this question certainly crosses my mind as well.
I wonder if someone could do what Steve mentions- create a temp graph in a similar manner that Hansen did for his published graph using only the unadjusted stations.
RE #110,
Kenneth Fritsch,
The NOAA image you show is very eye-opening. What would be quite interesting to me is a graph of FINAL – RAW. Any change such an image exists in the source material?
Below I have summarized my analysis of CRN123 and CRN45 rated stations using the USHCN Urban and USHCN MMTS data sets. Significantly more missing data exists in the MMTS data set than in the Urban data set. I designated a missing year of data if any months in that year were missing (normally several months were missing). Using this criteria for missing years’ data for the period of this analysis (1920-2000), I estimated that MMTS had approximately 22% missing while the Urban set had only 2.5% missing. I used the period 1920-2000 because this is the period that I could find data for the MMTS data set.
Recall that the MMTS data set has been progressively adjusted for TOBS and MMTS while the Urban data set has been progressively adjusted to completion with the additional steps that include SHAP (homogeneity), missing data and UHI effects.
Since I have not developed my own algorithm to fill in missing data or remove obviously incorrect data (as USHCN does), I had to deal with the large amounts of missing data in the MMTS data set. I did this by measuring trends by stations for the period 1920-2000 using both the Urban and MMTS data sets and then comparing the trends difference between the average CRN123 and CRN45 trends. I did the comparison using all the stations and then with only those stations that met a selected criteria for missing years of data. The comparisons are listed in the table below.
The table results show that by doing the comparisons in the manner described that only small differences arise between using all the stations (regardless of missing data) and part of the stations qualified by a missing data criteria. One can also see that the differences in CRN123 and CRN45 average trends are significantly different at p = 0.05 when using the Urban data set but not with the MMTS, although in both comparisons the CRN45 trends are always greater than those for the CRN123 group.
The final entry in the table shows that the trend differences between the groups CRN123 and CRN45 is much larger than the differences that would arise because of the data set (Urban versus MMTS) selected to make the comparison.
It should also be noted that time periods within the 1920-2000 overall period (this needs change point analysis to justify) can be selected that show more significant differences between the CRN123 and CRN45 trends (always with CRN45 greater than CRN123) than that calculated for the entire period – when using the Urban adjusted data set. With all the missing data using the MMTS data set, a comparison of a shorter period time with that data set could well be problematic.
While I make no claims of the statistical competence of this analysis, I judge that it shows that using the lesser adjusted USHCN data sets for analysis without some adjustments by the analyzer for missing and incorrect data could create problems and that in the case of the CRN123 versus CRN45 comparisons the trends differences are greater between groups than that that might arise from using the Urban or MMTS data sets.
Kenneth nice work.
Click to access 100694.pdf
seems to suggest a change point at 1964. Since Menne is one of the owners of USHCN
data…. also some references to other break point analysis and other years. I think One could
select one of these break points and be on some ground more solid than quicksand.
#118, Ken,
If I understand your table, all the trends are consistent with zero within one sigma and a typical trend is at most 1/2 to 1/3 of the error.
Re: http://www.climateaudit.org/?p=2815#comment-221372
My interest was in comparing the difference in trends between the CRN123 and CRN45 means and that was different than zero for the Urban data set using the 95% confidence interval. The point estimator s for that was determined by
s = ((s_crn123)^2/n_crn123) + (s_crn45)^2/n_crn45))^(1/2).
The point that I think you make is a valid one, however, in that the trend variations between stations are large and that means that it takes a lot of samples to see significant differences in those trends. That is why I used the division I did in this comparison, i.e. CRN123 versus CRN45, since it gives larger numbers (n_crn123 and n_crn45).
This large station to station variability also fits into my search for change points by statistical means since I can find changes in the trend differences between CRN123 and CRN45 visually (1950-1980) that gives a larger difference and one that is very significant. The only a prior justification I have for doing the change point search is that I think we can agree that the quality difference deteriorations could have been concentrated in a given period of time. Also we could reasonably assume that CRN45 stations and probably even CRN123 stations have not been at that quality rating for all time. I also think it is fair to assume that as a station goes bad that its year over year trend due to micro climate conditions can increase but that at some point the micro climate conditions will stabilize and so will the trend due to micro climte conditions.
RE: http://www.climateaudit.org/?p=2815#comment-221547
I have read that article and I have my change point macro for Excel. I want to attempt to do some analyses after I look at polar climate and modeling of it.
Opening post says:
How do you get 50%? I get 33%:
52%-39%=13%
13%/39%=33%
Regarding the UHI effect, from a layman’s point of view it would seem to me that the ideal place to look is China from the end of the cultural revolution in 1978. All the studies I have found show significant urban warming from that time to the present. Hong Kong is another with massive ongoing urban development and significant warming. You don`t have to go back beyond 1978 to prove UHI forms a substantial part of the present warming.
http://www.hko.gov.hk/climate_change/climate_change_hk_e.htm
http://www.chinadaily.com.cn/english/doc/2004-07/02/content_345038.htm
The error in calcuating the temperature average is much greater than the 0.1 degree. Steve is correct.
In Australia in recent years most Australian cities have sharply reduced the amount of irrigation allowed. Most Australian sites are affected by this irrigation effect and the trend won’t be simple.
bender #123:
I believe that Steve’s “50% greater” refers to the comparison you get after removing the 17% of ‘bipolar’ sites.
“Pure” positively adjusted sites = 52% – 17% = 35%.
“Pure” negatively adjusted sites = 39% – 17% = 22%.
And very roughly speaking, 35% is about 50% greater than 22%. [Actually, it’s more like 60% — maybe Steve was underestimating?]
5 Trackbacks
[…] adjustments outside the U.S. even begin to deal with the problem. Posts were here here here here here […]
[…] to the Darwin record in Australia. Oh and I know Steve McIntyre has detailed work on UHI, here at Climate Audit] Possibly related posts: (automatically generated)How useful is data?LOST DATA, PHONY […]
[…] Steve McIntyre says: August 11, 2010 at 10:19 pm Zeke. I took a look at GISS adjustments a couple of years ago, including a histogram of positive and negative UHI adjustments: https://climateaudit.org/2008/03/01/positive-and-negative-urban-adjustments/ […]
[…] Heat Island Effect. Detailed research by Steve McIntyre, shows Hansen has made Urban heat island adjustments that amplify the […]
[…] data and statistical problems, prompting in some cases corrections to the official records. See this post on urban heat island adjustments, and see these posts on temperature record errors and corrections, for example. (I covered some of […]