Tamino has recently re-iterated the climate science incantation that Mann’s results have been “verified”. He has done so in the face of the fact that one MBH98 claim after another has been shown to be false. In some cases, the claim has not only been shown to be false, but there is convincing evidence that adverse results were known and not reported.
Today I’m going to look at what constitutes verification of a relationship between proxies and temperature, assessing MBH results in such a context, trying as much as possible to emphasize agreed facts.
Verification
One thing that Tamino and I agree on is that a proposed reconstruction should “pass verification”. Tamino says:
… frankly, that’s the real test of whether or not a reconstruction may be valid or not. If it passes verification, that’s evidence that the relationship between proxies and temperature is a valid one, and that therefore the reconstruction may well reflect reality. If it fails verification, that’s evidence that the reconstruction does not reflect reality. It has the drawback that the data we set aside for verification we must omit from calibration; with less data, the calibration is less precise. But without verification, we can’t really test whether or not the reconstruction has a good chance of being correct.
and later
… it’s the verification statistics that are the real test of whether or not a reconstruction may be valid. Pass verification: probably valid. Fail verification: probably wrong.
While we strongly disagree on what constitutes “verification” and whether the MBH reconstruction “passes” verification, I’m prepared to stipulate to a verification standard.
If the MBH reconstruction can be shown to pass thorough verification testing, including, at a minimum, the steps described below, then, however implausible the notions may seem, I will advise readers to get used to the idea that bristlecones are magic trees, that their tune is a secret recording of world climate history and that Donald Graybill had a unique method of detecting their tune. However, these alleged magic properties should be subjected to (and withstand) scrupulous scientific investigation and verification and I do not agree with Tamino that these magic properties have been “verified”.
Without limiting the range of scientific investigation that any claim of a magical relationship might be subject to, the following verification tests seem to be to be a minimum that any scientist should require prior to grudgingly acquiescing in the view that a magical relationship exists between Graybill’s bristlecone ring width chronologies and world climate. (Similar considerations apply to any reconstruction heavily dependent on a very small number of “key” series.)
Failure in any one of these should result in Tamino rejecting the MBH reconstruction according to the verification standard. I submit that MBH has failed every one of these tests. Indeed, it’s hard to imagine a more dismal verification failure than what we’ve seen with MBH. Worse, efforts to verify their work have been contested and obstructed at every turn, leaving a very unsavory impression of the people involved.
Standard Verification Tests
First, the MBH AD1400 reconstruction failed standard dendroclimatic verification tests (Fritts 1976, 1991; Cook et al 1994; see NAS Panel Box 9.1): verification r2 (0.02 MM2005a; 0.018 Wahl and Ammann); CE ( -0.26 MM2005a; -0.21 Wahl and Ammann). These are not immaterial or irrelevant failures: for example, Eduardo Zorita said that his attitude towards the MBH reconstruction changed when he learned of the verification r2 failure.
Second, while Wahl and Ammann now (after the failure was exposed) argue that these failures don’t “matter”, that it’s all about low-frequency versus high-frequency, these are subtle issues where Wahl and Ammann hardly constitute high statistical authority (or even low authority). Readers are entitled to full disclosure of the adverse results and then judge for themselves whether they are persuaded by the Wahl and Ammann high frequency-low frequency argument. MBH readers were not given this alternative. MBH claimed that their reconstruction had “highly significant reconstructive skill”, not just in the RE statistic, but also in the verification r2 statistic, illustrating this claim in their Figure 3 excerpted below:
 |
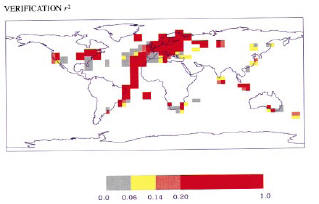 |
Figure 1: MBH98 Figure 3 panels b, c. The running text in MBH98 stated: “Figure 3 shows the spatial patterns of calibration β, and verification β and the squared correlation statistic r2, demonstrating highly significant reconstructive skill over widespread regions of the reconstructed spatial domain [emphasis added]” and later: “β [or RE] is a quite rigorous measure of the similarity between two variables … For comparison, correlation (r) and squared-correlation (r2) statistics are also determined. [emphasis added]”
These claims of statistical “skill” were not an idle puff by MBH, but were relevant to the widespread view that MBH methods represented a new level of sophistication, separating their work from Lamb’s prior work purporting to show a Medieval Warm Period. These claims of statistical skill were relied on by IPCC TAR, which made extensive use of the MBH reconstruction stating:
[MBH] estimated the Northern Hemisphere mean temperature back to AD 1400, a reconstruction which had significant skill in independent cross-validation tests.
The failure of important verification statistics should have been reported in MBH98, but wasn’t. It should have been reported in the 2004 Corrigendum wasn’t. Mann told Marcel Crok of Natuurwetenschap & Techniek that his reconstruction passed the verification r2 test,
Our reconstruction passes both RE and R^2 verification statistics if calculated correctly.
Later, Mann was reduced to telling a nonplussed NAS panel, well aware of Figure 3 shown above, that he had never calculated the verification r2 statistic, as that would be “foolish and incorrect reasoning”.
Perhaps Tamino can try, like Wahl and Ammann, to make a strained argument that the verification r2 (and CE) statistics don’t “matter”, but please – no more of this talk that MBH claims of statistical skill in the verification r2 statistic have been vindicated. They haven’t. And if you don’t believe me, look at Table 1S of Wahl and Ammann 2007 (which required a long and unsalubrious history prior to its inclusion in this article.

All of this discussion pertains to separation of in-sample calibration and verification periods – a separation which is complicated by the fact that you already know the results. The relevant test really comes from out-of-sample testing and verification scores, which I’ll discuss below.
“Robustness” to Dendroclimatic Indicators
Third, another important and untrue MBH claim has not been verified is its supposed “robustness” to the presence/absence of all dendroclimatic indicators. Various issues related to dendroclimatic indicators had been cited in IPCC Second Assessment Report; one of the main selling points of MBH was its multiproxy approach which seemed to offer some protection against potential dendro problems. MBH98 stated:
the long-term trend in NH is relatively robust to the inclusion of dendroclimatic indicators in the network, suggesting that potential tree growth trend biases are not influential in the multiproxy climate reconstructions. (p. 783, emphasis added.)
We have also verified that possible low-frequency bias due to non-climatic influences on dendroclimatic (tree-ring) indicators is not problematic in our temperature reconstructions…
These claims have been demonstrated to be untrue. If a sensitivity analysis is done in which the Graybill bristlecone chronologies are excluded from the AD1400 network, then a materially different reconstruction results – a point made originally in the MM articles, confirmed by Wahl and Ammann 2007 and noted by the NAS panel. In addition to failing the verification r2 test, a reconstruction without bristlecones fails even the RE test. Wahl and Ammann argue that this is evidence that the bristlecones should be included in the reconstruction; this argument has not been accepted by any third party statistician. However, for the present point, the issue is quite different and has never been confronted by Mannians: the discrepancy between reconstructions with bristlecones and without bristlecones means that the representation that the reconstruction was “robust” to the presence/absence of all dendroclimatic indicators is untrue. This recognition of non-robustness was recognized by the NAS panel which actually cited Wahl and Ammann on this point (STR, 111):
some reconstructions are not robust with respect to the removal of proxy records from individual regions (see, e.g., Wahl and Ammann in press)
There is convincing evidence that Mann et al knew of the impact of Graybill bristlecone chronologies on their reconstruction, as the notorious CENSORED directory shows the results of principal components calculations in which the Graybill chronologies have been “censored” from the network. Long before we identified the non-robustness to bristlecones, this non-robustness was known to Mann et al. While some comments in MBH99 can be construed as somewhat qualifying the robustness claims in MBH98, any such qualifications were undone in Mann et al 2000, which re-iterated the original robustness claims in even stronger terms than MBH98.
Some defenders of the Mann corpus have argued that the claims in Mann et al 2000 were narrowly constructed and referred only to the AD1730 network, which was the one illustrated in the graphic. In my opinion, the robustness claims were not limited to the AD1730 network, but included all networks [“our temperature reconstructions” is the phrase used.] But regardless, if Mann et al knew that the AD1400 network was not robust to the presence/absence of dendroclimatic indicators (which they did), then they had an obligation not to omit this fact (just as they had an obligation not to omit reporting the failed verification r2 statistics for networks prior to AD1820. )
Fifth, there is an important claim about the relative importance of the HS pattern in the North American network that not only has not been verified, but has been refuted. This particular issue has more resonance in terms of our personal experience than to others, but, as the people most directly involved, it was an extremely important matter. In response to MM2003, Mann et al argued that the HS shape of the North American PC1 represented the “dominant component of variance” or “leading component of variance” in the North American tree ring network and that the emulation in MM2003 had omitted this “dominant” component of variance. This was played out pretty loudly at the time. As readers will now recognize, this “dominant” or “leading” pattern was nothing of the sort. It was merely the shape of the Graybill bristlecone chronologies promoted into a far more prominent position in the PC rankings than they deserved, by reason of the erroneous Mann PC methodology.
In Mann’s first Nature reply, he was still holding to the “dominant component of variance” position. However, by the time of his revised Nature reply, he’d realized that the problem was deeper and conceded that the bristlecone shape had been demoted to the PC4 (an observation noted in MM 2005 (GRL, EE)). Instead of continuing to argue that the HS was the “dominant” or “leading” component of variance, he now argued that he could still “get” an HS shape with the bristlecones in the 4th PC if the number of retained PCs was increased to 5, invoking Preisendorfer’s Rule N as a rationale for expanding the roster to include the PC4. Of course, MBH98 had indicated a somewhat different rationale for PC retention in tree ring networks, but the description was vague.
My calculations indicate that it is impossible to obtain observed PC retention patterns using Rule N, with notable discrepancies in some networks. Was Rule N actually used in MBH98 or was it an after the fact effort to rationalize inclusion of the PC4? Wahl and Ammann didn’t touch the issue. With 20-20 hindsight, Mann et al might wish that they had used Rule N in MBH98, but no one’s verified that they did.
Graybill and Gaspé Chronologies
Given the acknowledged dependence of the MBH reconstruction on a very small number of tree ring chronologies, any engineering-quality verification for policy reliance, would inevitably include a close examination and assessment of the reliability of these chronologies, including re-sampling if necessary.
The key bristlecone chronologies were taken over 20 years ago. They were all taken by one researcher (Donald Graybill), who was trying to prove the existence of CO2 fertilization. Graybill may well have been eminent in his field but it is ludicrous that major conclusions should be drawn from unreplicated results from one researcher. TParticularly when there are also extremely important and unexplained differences in the behavior of Graybill’s chronologies from those of all other North American chronologies. The graphic on the left is a scatter plot compares the weights of the Graybill chronologies (red) in the MBH PC1 to those of all authors, relative to the difference between the 20th century mean and overall mean. You can tell visually that the Graybill chronologies have a far larger difference in mean than the majority of chronologies (unsurprisingly, this difference in mean is statistically significant under a t-test).
 |
 |
Figure 2. Comparison of MBH98 NOAMER PC1 weights to difference in mean, showing Graybill in red. Left – unquared; right – squared weights.
Aside from every other issue pertaining to MBH, any examination of this data requires an explanation of why the Graybill chronologies have a difference in mean that is not present in the other chronologies. This issue has nothing to do with PC1 or PC4. It’s really a question of whether there is an “instrumental drift” in the Graybill chronologies.
Let’s suppose that you have 70 satellites, using 8 different instruments, and that one instrument type has a drift relative to the others. If you do a Mannian pseudo-PC analysis on the network, the Mannian PC1 will pick out the instruments with the drift as a distinct pattern. Obviously, that would only be the beginning of the analysis, not the end of it. You then have to analyze the reasons for the drift of one set of instruments relative to the others – maybe the majority of instruments are wrong. But neither Spencer and Christy on the one hand nor Mears and Wentz on the other would simply say that Preisendorfer’s Rule N shows that the instrumental drift is a “distinct pattern” and terminate the analysis at that point. They’d get to the bottom of the problem.
Unfortunately, nothing like that has happened here. Mann and his supported have paralyzed the debate on esoteric issues like Preisendorfer’s Rule N and “proper” or “correct” or “standard” rules of PC retention and most climate scientists seem to be content with this and have failed to inquire as to the validity of the Graybill chronologies, both as tree ring chronologies and as tree-mometers capable of acting as unique antennae for world temperature.
Updating the Graybill Chronologies
An obvious way of shedding light on potential problems with the Graybill chronologies would simply be to bring them up-to-date, show that they are valid or not. Mann (and this argument is repeated by supporters) justified the failure to verify the Graybill chronologies on the basis that it is too “expensive” and that the sites are too “remote” – a justification conclusively refuted by our own “Starbucks Hypothesis” in Colorado.
Aside from our own efforts at Almagre in 2007, there is one other reported (but not archived) update, one which happened to be at the most important Graybill chronology – Sheep Mountain, a site which is not merely the most important in the AD1400 network, but one which becomes progressively more important in the longer PCs (especially the Mann and Jones 2003 PC1.) The Sheep Mt chronology was updated by Linah Ababneh, then a PhD student at the University of Arizona in 2003: see Ababneh 2006 (Ph. D. Thesis), 2007 (Quat Int). However, as previously reported at CA here (and related posts), Ababneh failed to replicate the distinctive HS shape of Graybill’s Sheep Mountain chronology, a shape that imprints the MBH reconstruction and, in particular, failed to verify the difference between the 20th century mean and long-term mean that led to the heavy weighting in the PC1. Her reconstruction was based on a far larger sample than Graybill’s. The differences are illustrated below:
Figure 3. Sheep Mountain Chronologies, Graybill versus Ababneh.
Linah Ababneh’s work has definitely not verified the most critical Graybill bristlecone chronology. Quite the contrary. Until the differences between her results and Graybill’s results are definitively reconciled, I do not see how any prudent person can use the Graybill chronologies, regardless of the multivariate method.
In our own work at Almagre, we identified issues related to ring widths in trees with strip bark that compromise statistical analysis, but have nothing to do with CO2 fertilization or previously identified issues. We found (See here here ) that strip bark forms can result in enormous (6-7 standard deviation) growth pulses in one portion of the core that are totally absent from other sections of the core, as illustrated below.

Figure 4. Almagre Tree 31 core samples, showing difference between cores taken only a few cm apart. Black (and red) show 2007 samples.
In a small collection (and “small” here can be as high as 30 or 50 cores), the presence/absence of a few such almost “cancerous” pulses would completely distort the average. The NAS panel said that “strip bark” forms should be “avoided” although they seem to have in mind the more traditional concerns of CO2 fertilization, than what seem to Pete Holzmann and myself as the problematic “mechanical” issues. Here there are some worrying aspects about the Graybill chronologies that should be of concern to more people than ourselves. Graybill and Idso (1993) said that cores were selected for the presence of strip bark so the possibility of a bias is latent in the original article. Second, at Almagre, we identified trees with tag numbers where cores had been taken and are located at the University of Arizona, but Graybill’s archiving was incomplete. Why were cores excluded from the archive? Given that the Graybill chronologies underpin the entire MBH enterprise, these missing invoices are, to say the least, disquieting, given Graybill’s seemingly unique ability to detect 20th century differences.
Gaspé
As noted elsewhere, there are issues about whether the Gaspé reconstruction has been included in the AD1400 netowrk only through ad hoc, undisclosed and unjustified accounting methods.
But aside from such issues, there is the important problem that, like Sheep Mountain, an update of the Gaspé chronology failed to yield the HS shape of the reconstruction used in MBH98. In this case, the authors of the update (Jacoby and d’Arrigo) failed to report or archive their update and it is through sheer chance that I even know about the update (which has not been reported anywhere other than CA). Again the “key” chronology used in MBH98 has not been verified.

The Bristlecone Divergence Problem
Ultimately the most relevant test of the “relationship between proxies and temperature” is whether updated proxies can reconstruct the temperature history of the 1980s, 1990s and 2000s. Here I mean the exact MBH98-99 proxies used in the AD1400 (and AD1000) networks; not a bait-and-switch. In the AD1400 (and AD1000) MBH case, a few key chronologies have been updated and so we have some insight on how the supposed “relationship” is holding up.
In our own sampling at Almagre, we found that ring widths in the 2000s were not at the record levels predicted by the Mannian relationship – and in fact had declined somewhat – one more instance of the prevalent “divergence problem”, but this example not limited to high latitudes and affecting one of the MBH PC1 proxies. Likewise, the Mann “relationship” at Sheep MT would call for record ring widths there, but not only did Ababneh not observe such records, as noted above, she raised serious questions about the original Graybill chronology in the first place.)
RE Statistic
In the face of all of this, how can Tamino (or anyone else) claim that the MBH reconstruction has been “verified”? Other than uncritical reliance on realclimate?
The main sleight of hand involves the RE statistic. The AD1400 reconstruction with old Sheep Mt and Gaspe chronologies has a high RE statistic. This appears to be the beginning and end of what Tamino (and realclimate) regards as “verification”. No need to verify the individual proxies. No need to pass other verification tests – even ones said to have been used in MBH98. No need to prove the validity of the relationship out-of-sample. All you need is one magic statistic – the RE statistic.
The trouble with the RE statistic, as we observed long ago, is that, meritorious or not, it’s not used in conventional statistics and little is known about its properties. In MM2005 (GRL) we showed that you could get high RE statistics using Mannian methodology on red noise. However, the problem with the RE statistic can be illustrated far more easily than occurred to us at the time. As noted on CA, I checked RE statistics for “reconstructions” using two of the most famous examples of spurious regression in econometrics: 1) Yule (1926) which shows a relationship between mortality and proportion of Church of England marriages; 2) Hendry (1980) which shows a relationship between cumulative U.K. rainfall and inflation). Both classic spurious regressions yield extremely high RE statistics – even higher than MBH98.
So although Mann characterizes the RE test as “rigorous”, it isn’t. It will fail with virtually any spurious regression (between co-trending unrelated series.) I’m not saying that the RE test shouldn’t be run: I see no harm in using this test, but it’s only one test and is not in itself anywhere near sufficient to constitute verification of a supposed relationship between proxies and temperature. For Mann, Wahl and Ammann or Tamino to argue that passing an RE test is some sort of accomplishment merely sounds goofy to anyone familiar with Yule 1926 or Hendry 1980. You’d think that third party climate scientists would catch onto this by now.
I don’t think that anything useful can be shown by more and more calculations on the MBH network. At this point, the only relevant testing is the out-of-sample re-sampling, showing that the supposed “relationships between proxies and temperature” can be confirmed. Available information on MBH proxies has not verified these relationships.
Anything Else?
Is there anything else that remotely constitutes verification of MBH? I’d be happy to consider and respond to any suggestions or inquiries.
In the above discussion, I haven’t talked about principal components very much and there’s a reason for that. In our articles, we observed that the Mannian pseudo-PC methodology was severely biased towards picking out HS-shaped series. In the critical NOAMER network, the relationship between the difference in 20th century mean and PC1 weighting is so strong that the MBH PC1 could be described as follows:
Construct the following linear combination of chronologies: assign a weight to each chronology equal to the difference between the 20th century mean and overall mean (with negative weights assigned to negative differences.)
This methodology will regularly deliver HS shaped series from red noise. Mannian pseudo-PC methodology is a poor methodology in that its efforts to locate a HS shape interfere with the operation of the PC algorithm. If there is a very strong “signal” or if the true signal actually is HS-shaped, then the poor methodology doesn’t matter much relative to conventional PC methodology. In the practical situation of the NOAMER network, the net result of the flawed methodology was to deliver a high weight to bristlecones.
If the bristlecones are magic trees, then the methodology might be flawed, but, at the end of the day, that wouldn’t “matter”.
If (1) bristlecones are not magic trees and/or the Graybill chronologies have sort of “instrumental drift” resulting in a spurious regression relationship to world temperature, (2) the Mannian pseudo-PC methodology is flawed and (3) there is some other methodology that avoids the grossest flaws of the Mannian pseudo-PC methodology, but is still inadequate to detect a spurious regression against the Graybill methodologies, then, in a bizarro-world, bizarro-scientists might argue that the flawed methodology didn’t “matter” because they were going to do the calculation incorrectly anyway. Leading bizarro-scientists would perhaps go futher, arguing, in addition that the fact that they could go on to make completely different errors meant that criticisms of the original errors were “wrong”.
At the end of the day, the issue, as the NAS panel realized, is about proxies and verification statistics. That doesn’t mean that the criticisms of the PC methodology are incorrect; they aren’t. Just that the PC issues could be coopered up without settling the key issues on proxies and verification.
Preisendorfer described PC methodology as “exploratory” and this is precisely how we (but not Mann) applied PC methodology. Mannian pseudo-PC methodology identified the most HS-shaped series quite effectively. We used this to explore the NOAMER network and found that its selections were not random – it picked out the Graybill bristlecones. The scientific issue is then whether these are valid proxies – and this is an issue that is not settled by Rule N, but one that requires scientific evidence. And in all the discussion to date, Mann et al have produced no such evidence.
So did the PC error “matter”? Well, it probably mattered in a different way than people think.
Consider what would have happened had MBH had not used an erroneous PC methodology. Let’s suppose that they used a centered PC calculation together Preisendorfer’s Rule N. So that they retained 5 PCs in the AD1400, including the bristlecones, and everything reconciled the first time. What would have happened? In 2003, I’d probably have more or less replicated their results and thought no more about it. I would probably not have peered beneath surface inquiring about the PC4 and bristlecones. verification r2 statistics and so on. I’d be making a handsome living in speculative mining stocks.
I followed the magic flute instead.


112 Comments
When can we expect a journal article? Virgil
I’m sure I just heard a “smack”. Can anyone else verify that sound?
Steve: In table 1S, what is the verification period for computing verification R2 & CE compared to the calibration period?
By the way, validation stats this low would prevent anything in my field from getting published (and I wouldn’t even submit it, personally).
I know I show my techiness here, but this is all just too funny (thanks steve)…except that it matters so much.
#1. Virgil, much of this is already in the published record.
Steve M, you really ought to publish a book. Your writing style is quite compelling, your analysis is unique, and the topic is quite hot 🙂 right now. You should hurry before cool weather makes the issue go away.
A journal article, where? A cheerleader gatekeeper publication?
I think the NAS panel and the Wegman report and the Barton hearing are published enough as it is. We know who’s watching here.
David: It’s the sound of the house of cards falling.
I’ve been glancing around at deltoid. They’ve been reduced to arguing that 10 years isn’t climate, it has to be 30. Not that the IPCC and Wikipedia say it can be as short as a month, you know, the first calculation of the anomaly mean? Oh, the irony.
Your old professors must be blushing in pride about it.
Mmmm….a maaagggic flute.
“Tamino and the Magic Flute”
This posting has a boy and his magical flute, alpine tree background and magical trees that tell us stuff?
How can I not think of H. R. Pufnstuf?
Exhibit 1 –
And Mann followed the magic trees.
Perhaps Tamino has a new definition of “verification.” Redefining terms is becoming quite common in certain circles.
@Sam
Hhmmm… why do you suppose they are claiming that? 🙂
I hadn’t really noticed it before, but I guess you have been saying it all along: it looks very possible, given the results of the resampling of the BCPs and Gaspe cedars (the “divergence” issue), that the original studies involved some serious cherry-picking. Thus, maybe we have the issue of cherry-picking cherry-picked studies. How many cherries can a cherry-picker pick, if….
Steve,
I can’t follow all the statistics as I would like and I imagine many others are in the same boat, but it has motivated to me to get up to speed on the statistical methods you discuss. Thank you for that.
What frustrates me is that there are important issues here that should become lessons learned at least for policy makers and, in a more perfect world, the public also.
Damn, if this isn’t Frontline material.
Pete
re: #13
Well, it’s like this. If you go to the store for cherries, you want only the best quality cherries. Therefore the name-brand canners will cherry-pick the best cherries and the rest will be canned as store-brand cherry-pie filling.
Now Mann came up with a canny program to cherry-pick the best cherries. As the old limerick says:
* presumably referring to bristle-cone pines.
# which is why it was so hard for Steve to get his canned procedure
Steve:
I would like to know what you have for breakfast in the morning (I would then want to know where I can get some of the same).
After seeing Rasmus’s reply to Shaviv, nothing that RealClimate says surprises me anymore.
Tamino wrote: “If it passes verification, that’s evidence that the relationship between proxies and temperature is a valid one…”
Tamino’s claim, that statistical verification establishes physical causality, is rife throughout proxy climatology and it couldn’t be more wrong.
In science, a relationship between tree ring proxies and temperature is established by physical theory. By itself, statistical correlation doesn’t mean a thing in science. Climate physicists have been grossly negligent (willfully incompetent?) allowing this claim, reiterated by Tamino, to have such a long unchallenged run. Statistical correlation between tree ring proxies and temperature is a causal crock. It always was a crock, scientifically, and will remain a crock until someone establishes a link by way of a quantitative physical theory.
Tree ring proxy thermometry is an illness. Belief in it is irrational. It has no valid basis in science.
Very nice summary, Steve.
You’ve got to wonder at Tamino thinking he can go head-to-head after you’ve delved deep into the murky depths of MBH98/99, whereas Tamino has maybe read a text book on PCA and read a few bits of RealClimate (which, by his own admission, is where he found most of his material).
Mind you, we haven’t even started on the confidence intervals yet. Maybe Tamino would like to have a stab at those for his next trick?
PS. Can’t help but chuckle at Wahl and Amman’s use of five decimal places for the 1700-1729 r-squared. Because 0.00003 is just sooo much more convincing than 0.000, isn’t it?
Re: #14 Pete F. says:
Yep, I’m sailing the ocean as you. The first few times I visited here I had to constantly flick between the acronym page, the articles, and wikipedia. I knew next to nothing about statistics and if I’d been asked I’d have said a PC1 was a PC with an 8086 processor, PC2 had an 80286…
Now a know a little more and every time I visit my understanding increases so a visit here is always worthwhile.
Thanks Steve.
*#&# ^ Flute, I hate that thing sometimes.
I am a mathematician and i still know nothing about statistics. But, from what i understand about math and programming it looks like Mann and Hansen know nothing about either of those topics
19 Pat Frank
The physical theory lies in the temperature dependence of biochemical kinetic rates in the plants.
Re #14:
I agree it is ample time to have this kind of audit made abundantly present on the table of policy makers, civil servants and first page of national newspapers. Moreover, now that policies are drafted because of these people and affect the public, when are bad faith and bad science going to be made accountable? Do we have to involve legal means? Sure scientists are not unfallible. But scientists have to be honorable and take responsibility if proven wrong, repeatedly and unmistakably. The persistent promotion to this day of science debunked by Steve (and Wegman et al.) shows none of these attributes. (Steve, please delete if you see fit but frustration is indeed growing…)
Unfortunately, the scientific method can’t be used to empirically verify an hypothesis. The scientific method is a tool to reject hypotheses. Most of the bad science in global warming results from the wrong belief that hypotheses can be verified.
18 (Pat Frank): Bullseye!
26 (me): Pat Frank, you just landed on Peyton Place. You get 1,000 quatloos.
Like Gunnar, I think the final write-up of this episode of climate science should be in book-form. Of course, it won’t recover its costs, but then most excellent science books don’t.
Are you kidding? It would end up being required reading in any masters level statistics course, as well as climatology.
O mighty warrior of great fighting stock
Might I enquire to ask, eh, what’s up doc??
I’m going to kill the rabbit!!
Oh mighty hunter t’will be quite a task
How will you do it, might I enquire to ask??
I will do it with my spear and magic helmet!
Your spear and magic helmet?
Spear & magic helmet!
Magic helmet?
Magic helmet!
Magic helmet
Yes, magic helmet and I’ll give you a sample
RE # 23 Jesper
Apart from this being bleeding ovbious and no contribution to the debate –
– do you have any comment about mathematical responses such as the “inverted U” where a biochemical kinetic rate can be affected similarly by either high or low temperatures? Quantity of new leaf growth on annuals is but a simple example. One might wish to set up a physical experiment to see if this was reflected in tree ring widths, but one would not set up a statistical experiment ab initio unless naive was the keyword of the day.
Similar U growth responses can be visually observed from under- or over- fertilization by a fair number of nutrients. Example – throw a tight fistfull of urea on the lawn, watch for the annulus of best growth surrounding the dead centre a month or so later.
I’m not familiar with this magic flute. Is it the one which plays startlingly out of tune yet everyone swears its a work of musical genius?
Ah John, just listen to Mozart’s operatic version Die Zauberflöte, as I’m sure you have. It is some of the most clever, lively, uplifting music one can find. Such unfortunate connotations as above.
From Act II – the grove of Palms
I’m quite new here too.
I am very impressed with your abilities and honesty.
Is it possible for you to produce a simplified summary (book?) so those of us who don’t quite follow the stats can get a clearer picture of whats going on?
Geoff Sherrington, 31:
When I worked in thin films for magnetic storage, we called the ‘inverted U’ curve a 747-curve, because it mimicked the flight path of an aircraft. It takes off, it reaches cruising altitude, then it lands. A normal U-shaped curve was called a bathtub curve, for obvious reasons.
Coercivity [in Oersteds] of magnetic recording films also exhibit a 747-type curve in response to increasing magnetic alloy deposition temperature. The reason being that there are actually two separate exponential physical mechanisms taking place, simultaneously – one with a positive temperature coefficient and a second with a negative temperature coefficient. In the case of magnetic films, high temp was required to allow chromium to diffuse to the boundary between individual cobalt grains, but high temp also caused individual cobalt grains to grow too large and eventually overwhelm the effect of increased segregation. The first effect maxed out at ~100% segregation, but the grain growth continued to increase unabated with higher temp. One effect counteracted the other, so films must be deposited at an optimal temperature.
So Jesper [23] probably is right about biokinetics being a ‘good’ effect that increases growth, but he needs another ‘bad’ effect to explain high temp response [or the fertilization effects you describe]. Could be excessive transpiration or one or more additional biokinetic effects. As in thin films, growth response to temp in plant cells probably maxes out at 100%, because there are limits to the amount of nutrients that can be supplied to a cell. Many negative effects tend to be unlimited, however.
I think it was a crack, the sound of a hockeystick shattering.
Not only there is a problem with the inverted-U-shaped response to temperatures. Most importantly, that shape only makes sense when considering rather constant temperatures, or should I say, generally high or low temperatures in a similar fashion during the whole year.
But the truth is that the temperature in autumn, early winter or even the summer is not very important. They could be higher or lower to quite an extent without really affecting plant growth. For the same optimal moisture, what mostly benefits plant growth is an early-finishing winter and a warmer spring. Just higher temperatures between March and May, which doesn’t necesarily mean a higher average temperature for the year. A colder summer and autumn would hardly affect the plant growth but would reduce the average temperature.
It is interesting to notice how, with the exception of 1998’s “El Niño” and 2001, all of the years in the last decade show stronger positive temperature anomalies in the erlier and later part of the year than in northern hemisphere’s summer. I would like to check the look of the anomaly in earlier years. Especially between 1940 and 1970. But as far as I’m concerned, and I would bet that also for most of the living creatures on Earth, it is wonderful to have hotter winters without so much hotter summers…
Perhaps, in the interest of brevity, we could have a post on what in MBH98 was actually correct?
;-P
#7
Sam I was posting at Deltoid for a while and defending Steve and Anthony but just got frustrated because there was no reasonable scientific discussion going on there.
Cleanthes:
They spelled their names correctly. After that, it gets a little shakey (or shonky as the Aussies would say).
Andy:
See http://www.climateaudit.org/index.php?p=166
The physical theory lies in the temperature dependence of biochemical kinetic rates in the plants.
What I’ve seen elsewhere as “progressive”, pseudo-scientific thinking is: “If something is possible, it’s actual, it’s an epidemic,” and, of course, “We’re all gonna die unless we do something [really crazy] now!”
Steve’s work helped me recently when a local government “natural resources” manager used the hockey stick to present the County’s views on AGW and by reference the County’s proposed response.
After presenting the graph as evidence of “unprecedented” warming, I took the fellow aside and explained the North and Wegman evidence to Congress (without mentioning M&M, since this would likely cause mental burnout) and brought to his attention the problem with using strip bark proxies. While not directly acknowledging that the hockey stick was flawed, he has since dropped it from his presentation, including the web site version of his presentation.
While perhaps not a great feat in truthing out the AGW hype, sometimes small victories can add up in the long run.
#37
The hockystick was shattered a long time ago by Steve and Ross. But the warmers keep trying to put the pieces back together with second-hand scotch tape. Their train has left the station and they are standing there forlornly waving the poor, broken thing.
Steve, this must be very frustrating for you to have to go over all this again – I admire your patience. Needless to say you are ‘running rings round’ him. I don’t know why he bothers. As others have said it would be worth writing a short paper incorporating some discussion of the newer results like Ababneh and your own.
Steve:
I am a professional mechanical engineer working in heavy industry (mining and milling). While my grasp of the more esoteric parts of your criticism is shaky, I appreciate following along, digging up the references, and a good chuckle.
Please, consider a few edits for emotional content. The urge to mock is overpowering, I know, but it detracts from your excellent and useful work. What is going to clobber this falsehood once and for all is young climate scientists checking those tree ring studies, re-sampling trees, doing actual experiments in greenhouses to see if trees actualy are thermomometers, and if so which ones are most reliabile. They will be driven to disprove your assertions with an actual experiment.
In short, actual science where you postulate a hypothesis and check it. How many undergrads spend quality time proving the gravitational constant? Lots, and for a good reasons. Same with climate science – eventually. When that happens they will be able to find the discrepancy themselves. And the inquisitive little buggers will start asking more awkward questions, and we all pretty much know where that leads.
Your detractors are reduced to ad-hominum, and your occasional cutting aside hands them ammo, tit for tat. It might actually lead to the odd person dismissing your work. I certainly hope that isn’t a young person studying climate science today.
Quick question—and I completely understand the argument against MBH98, I am just trying to piece a big part together from the Mann side—–how do they suppose to get the actual temperature average, and I mean down to a tenth of a degree, from these tree rings?
Not only does it not make any sense– the statistical jibberish which is employed to try to make these trees a proxy for temperature, but to actually deduce the temperature from the “proxy” to any level of confidence seems impossible—especially given that we can barely arrive (if at all) at satisifactory temperature measurements within our limited span of instrumental data– ~1880 to present.
Indeed, these instrumental temperature data are constantly being revised, up and down–for whatever reason.
That’s an issue that is rarely mentioned by the pro treemometer camp. IF, and I really mean IF, trees are a proxy for temperature, particularly BCPs, then they are a proxy for temperatures during the growing season, not the year.
Mark
That is an interesting statement. Bringing all this up again enables Steve to reach a much wider audience. I can see it in these comments. Tamino doesn’t seem to be helping the Team here, IMHO. This latest post provides a really clear concise summary of the major flaws in the HS studies.
Wm. Hughes@46
I made the same argument somewhere recently about hypotheses and experimentation. However, the current crop of (fill in the blank) scientists have been convinced that computer modeling is faster, cleaner and fool proof. Which is how we got in the AGW mess to begin with. Find a paper, or an article which does not have “To simplify, we assume………” right at the beginning, followed by page after page of computerized extrapolations. There are continuous comments on here and other blogs to the effect that “If the scientists would get out of their air conditioned labs and get their hands dirty like the old days….” As far as I have been able to ascertain, global warming exists only inside certain computers, and the brains of a few Enron style entrepreneurs who are going to make an initial killing off selling hot air “fixes”.
Wow. This may be the best summary I’ve seen on this issue. Excellent post Steve.
Regardless of all the statistical hand-waving and sleight-of-hand mathmatical trickery involved, the most damaging point to me is the updated chronologies. They’re not even remotely stick-shaped when updated. If it happens once, you might dismiss it as a simple data handling error. When it happens multiple times, the words “fraudulent science” come to mind. At first, I thought he had simply cherry-picked what he wanted and multiplied it’s effect (which he did), but now it seems the cherry-picked chronologies were just simply fabricated from the very beginning.
You do excellent work, Steve.
#39.. ok, a list of things right in MBH98… ummm….
hmmmm….
OH! I got it! All the sites used in the study did indeed have trees on them.
… they do, don’t they?
I think Tamino got suckered into it by Michael Mann. He has admitted that his initial post was largely based on Mann’s stuff; I suspect Tamino never really looked into this in detail.
Given the treatment Steve is giving him, it will be an interesting test of Tamino’s integrity to see if he can admit any error in his original position.
I’ll be the first to admit that I don’t understand nearly enough of the statistics – but I recognize quality work when I see it. And this article is it.
Let me post a couple of points here – I think they all have (at least) a minor relation to this post – and I feel like typing today.
1) As a former financial auditor (and someone currently subject to audit) I find it frustrating that there seem to be so few rules about what constitutes acceptable use of statistics and what does not. I liken this to ambulance chasing lawyers who will present cases to various judges in effort to verdict shop. Here the emphasis seems to be on “statistics shopping” – keep trying different methods of defining something as valid in the hopes that someone will buy it. Steve does a great job here in defining what validation should look like.
2) Computer models reflect only the assumptions that are programmed into them. I got a big kick out of a recent National Geographic article on water shortages in the southwest US when they stated that (or words to the effect) that the shortages were predicted by computer models and verified by other models. Of course they were! They all start with the same assumptions. To be fair, the article did lean heavily on the increases in water demand – but couldn’t help slipping in some references to global warming.
3) I propose that we refer to MBH as the “voodoo theory” – because as many times as Steve drives a stake through its heart it keeps coming back from the dead.
#52 Jryan
Who knows if there are any trees? Only few sites were updated and that not by the original authors 😉
I’m pretty sure they spelled the author’s name correctly.
@lucia
I don’t know 😀 Perhaps it’s because you’ve been “fisked by a professional statistician” on issues involving IPCC projections and recent observations? Something about you asking on your blog and Mr. F actually asking Rahmstorf. 😉
I do agree with him when he says things like this:
G seems much more reasonable since he became a bulldog.
Thanks JohnA #41, much appreciated.
@ Bob
I saw. I don’t post there, and it’s always struck me as a political blog anyway. Under GW they have “McKitrick, Monckton, bobcarter, patmichaels and timball.” Heck, there’s 8 topics under Lott (15 in the archives)!
Anyway.
@lucia
Sorry, that’s a quote from Open Mind, Recent Climate Observations Compared to (IPCC) Projections.
George M, (#50)
your post reminds me of about 15-20 years ago when a younger relative told me of what he called a “really weird” assignment in the first class of one of his engineering courses.
Later he told me it was the single most important thing he did in his university training and was a key element in his successful engineering career.
He had to write an essay on Convair’s attempt to leapfrog Boeing and Douglas by going from the drawing board (models) directly to the production line without a prototype for a test bed. The result of that decision was, of course, that many of us flew in 707’s and DC-9’s. Who can remember what the Convair was called. Did it, or could it, fly? (Or am I foggily recalling an urban legend?)
Re #61
It flew, called the Golden Arrow I believe, there was indeed no prototype. It failed commercially because they decided to make it smaller and faster than the 707 and DC-8, so it was more expensive to run. Believe it or not Elvis had one which I think is the only airworthy one left!
Golden Arrow it was, the fastest airliner ever built in the US. AKA Convair 600 and Convair 880 for its airspeed in mph and fps. There are four left. Yahoo is my friend.
=====================
Way off topic, but the Convair 770 / 880 program is discussed in a great book by James Gilbert: “The World’s Worst Aircraft”
I became quite disillusioned with this multi-proxy pseudo-science a while back. Steve you are right to highlight that verfication is needed for proxies but as you said yourself and as has been repeated this involves experimentation and study. On a more fundamental note what is not detailed here is the basic scientific method. And point number 1 in this method is:
1) State your assumptions about your methodology and the experiment to be done.
PCA analysis cannot be used without some knowledge of the experiment. Some may disagree with this but PCA is only a means of ordering measurement variation, ranking them in a linear fashion. It is not some crystal ball. It all depends on the data set used. Significance is related to what you believe to be the main dynamics behind variation in a measurement and what you have measured. It needs you to look at the data and get a feeling for it based on previous experience.
For example say I have a ball on a table and its connected to a spring. I don’t move the ball throughout the whole experiment but I measure as many variables as possible every minute. I measure humidity, temperature in the room, my average heart beat etc. Now PCA the lot and it may turn out that humidity and heartbeat have significant variation. Okay but you know the ball didn’t move so ignore these components. Then you may find that temperature varies less so correlates with ball position. This is an example of a trivial solution since variances that tend to zero correlate with the known zero scenario. But if you didn’t know that and in another scenario you actually moved the ball then you may find that humidty correlates with ball position better and hence using PCA alone you would say that humidity appears to affect ball position. And this is where rule number 1 steps in. You assume in PCA that dynamics are related to the most significant variances. Further work is then needed to better clarify the relationship between humidity and ball position and to see have you measured enough parameters and to start defining a repeatable relationship. If you just applied a cut-off rule you may end up missing valuable information. Of course you’ll end up knowing humidity has essentially nothing to do with ball position but your method does not provide you with this insight. You have to realise the method itself is not conclusive and continue the work.
To give Tamino some credit I believe he was trying to say something like this in his PC4 inclusion idea in that there is a signal there so somethign must be going on. However he misses your point Steve that how do you conclude which PC is significant or not? You can’t say PC1 is then find out you did the maths wrong and say ah but now you see its PC4. Personally I don’t use any statisitics beyond mean and standard deviation in my work (I’m a physicist/engineer/mathematican). I write out my methodology and state my assumptions. If I were to use a proxy then the first thing would be to show how it was defined.
The real question now is how do we make better proxies. Can we produce a multi-parameter data set for each proxy and individualy define the variation in the proxy as a function of measured parameters? Can this be generalised with an acceptable error and then used as a proxy relationship for temperature reconstruction? If not as there is insufficient data them don’t give me this PCA nonsense. Just say you don’t know.
Steve, RE statistic is not in your common acronyms list.
John Andrews, Knoxville, Tennessee
#54 Nat. Geo. Article on SW US water
I, too, am a statistically ignorant frequent visitor. The NGM reference prompted my intrusion. That article touched on the water-availability impact on tree ring growth, (while more-broadly worrying about AGW-induced drought, which worries us little.) That moisture issue conformed with my way-too-old understanding of desert tree growth physiology. Water rules. Hot/dry loses to cool/wet every time. I never did understand how Mann et al even got an initial hearing. Didn’t anyone else learn the same basic biology I did, fifty years ago?
Gaelan @ 47
Its OT — but the denros claim to be able to measure the width of a tree ring to within 1/10th the size of an individual cell. Such precision being necessary when using trees as thermometers precise to 0.01 census. Clearly what is happening when they measure the rings is that a human being is making a judgment of exactly where the boundary is. The boundary between rings is not perfect — and its certainly not uniform radially. And its certainly not possible for the core to be perfectly bored into the exact center, what ever that means for an object that is far from being perfectly circular. So I am struggling to reconcile the strange image of a guy standing on a cold wind swept hill side sticking what amounts to a hand drill into a craggy old tree and doing his best to find the center and the image of the measuring guy in a white walled clean room with a little green clean room hat on measuring things to 1/10 the size of a plant cell.
Steve has guided me before not to worry about this issue. But I had a part-time QA job in college where I measured stuff, and this is just bugging me.
This is yet another opportunity for bias to creep into the system. If you are responsible for measuring the rings and you have it in the back of your mind that the rings are supposed to become subtly bigger over time …
#65. Where Tamino misses the point is that the issue is not just “whether” something is going on in the PC$, but whether that something is a unique antennae to world temperature. If it is, then isolate it. But simply saying that something is going on doesn’t explain why Graybill is the only contributor to the PC4. Is that because bristlecones are themselves unique antennae? If so, why are bristlecones magic?
I’m also trying to re-emphasize that PCAs are only one way of cherry picking. Once you know that the bristlecones have a HS shape, you could just select them directly (excluding all other US trees) as, for example, Crowley and Lowery 2000 does.
@Sam–
Oddly, Tamino criticizes me for using the wrong time frame and wrong trends. The problem: I didn’t falsify the TAR. I falsified the AR4— which applies only after 2000. The idea of using 1990-2000 data would be silly even if models were “frozen” in 1990. And of course, one big reason the TAR doesn’t falsify is their ‘predictions’ are lower than the AR4!
So, while the claim that one must start falsifications on 1990 is silly, with regard to the TAR, it doesn’t matter. It really doesn’t matter when you start analysis, 1.5C/century from 1990-2005, as predicted by the TAR ain’t gonna’ falsify!
CONVAIR! Dont bring up Convair ! Stinking rat bastards.
http://www.f20a.com/f20hist1.htm
“Instead, in 1980, after a forty-year meander, the US government once again returned to the ultimate aircraft. For stealth reasons the design had to be fitted with a jagged trailing edge. But to make sure the point was not lost, Northrop engineers made sure the B-2 had the same wingspan, to the inch, as the B-35. Permission was obtained to show Jack Northrop the then highly secret B-2 just before he died. ”
TO THE INCH. we stuffed it up their nose.
Sorry,Dont get me started on Convair.
Re 69
Yes I agree Steve, if bristlecones are ‘good’ at predicting temperature and can be defined as such then there is no reason why they can’t be a valid proxy. Also if there is a valid correlation to temp from any PC it must also exist in the individual proxies themselves but alas I don’t see the proxy definitions appearing anywhere.
[snip]
Re #66, John Andrews
Have a look at http://climateaudit101.wikispot.org/Glossary_of_Acronyms
Steve, why don’t you put this one on the masthead? It’s much better than Willis’s old one that you link to.
Cheers — Pete Tillman
Steve M
Thank you for all your hard work. Like you and the rest of the bloggers here, I want the science done righ way.
Here is another group that agrees with your approch to science.
http://www.ncpa.org/pub/st/st308
“Violations of Forecasting Principles. Forty internationally-known experts on forecasting methods and 123 expert reviewers codified evidence from research on forecasting into 140 principles. The empirically-validated principles are available in the Principles of Forecasting handbook and at forecastingprinciples.com. These principles were designed to be applicable to making forecasts about diverse physical, social and economic phenomena, from weather to consumer sales, from the spread of nonnative species to investment strategy, and from decisions in war to egg-hatching rates. They were applied to predicting the 2004 U.S. presidential election outcome and provided the most accurate forecast of the two-party vote split of any published forecast, and did so well ahead of election day (see polyvote.com).
The authors of this study used these forecasting principles to audit the IPCC report. They found that:”
righ=right
RE: 38 Nylo
I live in the Minneapolis/St.Paul area which has large swings in the rate of ‘greenup’ in the spring all depending on what you described in your post. I being a 22yr meteorologist and part time phenologist I watch this stuff closely. Our trees can begin to leaf out as early as mid april or as late as the 3rd week of May, both of which have occurred in the past 10 years. However most of the past ten ’round here have been early…not this year the way it looks right now, but I find that interesting that ring width can be more strongly correlated with an early spring and I suppose there are studies that suggest this?
mosh,
Man, always loved the F20 – classic good looks and performance to match.
Tamino call to authority
Anthony Watts asks a question
Re 76 tom:
You don’t only need an early spring. In fact, the most terrible thing for plant growth is an aparently early spring, which triggers the growing season, followed by a very cold week that causes frost and damages the trees. The trees can resist almost any cold while “hibernating”, but are very sensitive to frost while growing. So you need an early spring which is NOT followed by any extreme weather in the opposite direction. It can be colder than usual but it mustn’t be damaging for the plants. I can remember, like 12 years ago, this happened in Madrid, the trees had already grown their leaves and started their growing season very early, and then a later cold blow and frosts made them lose again all their leaves, which took them very long to recover from. It’s like there had been 2 winters that year. It was a bad year for tree growth.
re 77. thank you. it was ajoy to work on.
#78 – THat is about as telling a statement as I think you will ever get from Tamino. When he starts talking about models and correlations and anything scientific or statistics related as “opinion” he has all but given up.
Seriously… that is a shocking statement.
To illustrate what is wrong with the whole PC and weighted regression procedure, consider a local area affected by the Pacific Decadal Oscillation (or AO, or monsoon cycles, etc). If it happens that this particular area is positively influenced by such a multi-decadal cycle during the calibration period (which is only a few decades), it will be highly correlated with the global rise in temperature during that period, and will be given a high PC score and a high regression weighting. BUT during the next set of decades or a previous set, the PDO will be in the opposite phase and the trees will be anticorrelated with world temperatures. Given an algorithm that picks sites from the world that are correlated with global trends, it is almost guaranteed to find any sites with a multidecadal good growing period that is only temporary and is therefore spurious. The resulting reconstruction will be meaningless. The cure for this (if the trees truly were treemometers, which I do not agree they are) is to calibrate each site to local data and then combine them (but not weighted times hundreds). The method Mann and others use is only valid if the local temperature trends during the calibration period are correlated across all sites and consistent over time, which is patently untrue.
Or, in other words, it would be like a study that tries to measure the annual summer cicada population but they only conduct the study for three years. No matter what happens in that three years, their numbers will be wrong because the cicada goes through a 7 and 17 year cycle. So they could do the study and wittness neither of those cycles, one, or both… and in all of scenarios they would come away with the wrong answer as the study was not long enough to incorporate enough cycles.
It seems to me that the only sensible way of combining several datasets is to assign any weights beforehand and not let them fall out of the data. Then calibrate each dataset individually, and finally computing the weighted average. This is straightforward.
84 (Leif): I forgot to mention that in solar physics we have the same problem, namely to produce a record of sunspot numbers from many different [and not always overlapping] observers.
You’re assuming here that all the datasets are measurements of sunspots. What if you had 4 data sets with sunspot measurements and 14 data sets with tree rings and 11 with gate receipts from NFL games? If you don’t use NFL gate receipts, are you “throwing out” data?
Do Graybill bristlecone chronologies measure temperature? One replication step is available here that is not available in the sunspot case: you can re-sample the Graybill sites and at least determine whether any problem arose with Graybill’s observations, aside from any problems with the bristlecones themselves. Ababneh’s failure to replicate the Graybill Sheep Mt series is really an insurmountable problem for people purporting to build histories on Graybill’s Sheep Mt chronology.
There’s an interesting backstory here – as was noted last fall, Ababneh has not archived her data and sought legal advice when approached for it; Hughes didn’t even mention her work at AGU last year when discussing bristlecones even though he was a thesis committee member for her.
Yikes.
I think the “opinion” refers to simply the issue of using centered vs non-centered PCA. I doubt Tamino has read anything about any of the statistical or proxy issues raised by Steve(and it should be clear that Tamino never read the M&M papers).
Lurk off.
Steve #86,
“Ababneh has not archived her data and sought legal advice when approached for it.”
I apologize if this has already been suggested, but why not pass the hat and send a posse back up to Sheep Mt. to see what frightened Ms. Ababneh into the arms of a lawyer? I’m in for a quid.
Lurk on.
#86, and 89
This goes to the heart of the issue. The trees are there. They can be resampled and checked against modern, instrumental data. What are they afraid of? This is unacceptable. We are not talking about intellectual property here. The data is what it is. The ring measurements are what they are. Lawyers? This is sad.
What is going to eventually come out of this is that trees are not thermometers, and reconstructions of past climate based on thier growth rings provides only limited actual temperature data, and certainly not temperature to tenths of a degree as has been put forth. There needs to be some perspective brought to the issue as to what these studys can actually tell us.
I’ve posted up Ababneh’s recent Quaternaty International article here. She doesn’t show the Graybill chronology, comparing her chronology instead to an even earlier version of Lamarche! This particular article is not directly about the Sheep Mt chronology but about archaeological settlements and she avoids confronting the Graybill discrepancy as follows:
Other chapters of thesis, which discussed the Sheep Mt chronolopgy more directly, have not been published so far, although they presumably were submitted somewhere.
Her thesis said that she would archive her data, but, when approached, the university refused to make any effort to contact her and require her to archive the data as she had undertaken to do. Despite her refusal to provide data, Hans Erren made an accurate digitization from the thesis pdf, so we are able to compare her results to Graybill’s even without her officially archiving data at ITRDB. It would be nice to have measurement data as well, but she’s far from unique in not having measurement data archived. Measurement data is unarchived for a number of the chronologies lllustrated in IPCC AR4 e,g, Yamal, the Tornetrask update,.. and for that matter, sample data from all of Lonnie Thompson’s ice core (which is the equivalent level of detail to tree ring measurement data) is unavailable. So no one should get the impression that Ababneh’s archiving practices are worse than (say) Esper’s or Briffa’s. It’s just that this is a contentious data set and the measurements are of particular interest.
Perhaps my earlier comment was too oblique. Mann’s basic hypothesis is that a wide tree ring evidences a hot year. This thread is focused on whether he recorded and reported data correctly. While this discussion proceeds, other researchers are using the same trees as water proxies – wide rings are evidence of wet years. Does wide equal wet or warm? The two hypotheses are probably, but not necessarily, in conflict. Someone needs to pursue definitive research to determine exactly what a wide ring is evidence of, and whether it means the same thing in high desert and river forests. I suspect that trees are neither thermometers nor hygrometers.
Steve: Nobody here is likely to disagree. These sorts of things have been discussed on many threads. Not every theme of the blog is summarized in this particular thread.
In grad school the professor next door had a poster that said “If you can’t dazzle them with briliance, baffle them with bull****”
This was supposed to be a joke, but it looks like certain hockey players thought it was career advice.
Personally, I’ve found that if you have to eat crow and admit a mistake, crow tastes better fresh than simply wearing it around your neck forever…
@lucia
Yes, I saw the TAR/FAR thing. I’ve always been under the impression this is more a misunderstanding or a discussion of merits (or relativly esoteric details, etc) of doing things. FWIW I think you have to use multiple data sets, the subject of climate being what it is.
As far as reported numbers, I would be shocked if those collecting data that turns out higher numbers didn’t think one way, and lower numbers didn’t think the other. I’d chalk it up to a certain trend gives a certain idea, then at some point, that perhaps starts to guide the observation bias, and you’re in a feedback loop.
On one level I agree with you that it’s warming, on the other I disagree that the anomaly trend reflects it and that greenhouse gas concentrations are the primary cause behind it. I applaud your efforts to falsify it, and being able to not falsify 1.5 when the actual number is 0 is something that all but the most fixated on AGW must recognize as being a valid point: You can’t flatly state the numbers are anything trustworthy.
@Michael Jankowski
I think it’s also obviously clear he never read the transcript of the Barton hearing. If everyone read that entire thing, they’d realize what this is all about, and who are the rational ones in the story.
My solar reconstruction passes verification RE test (1854:1901), http://www.climateaudit.org/?p=2304#comment-154698 , but then 1650:1700 is a disaster. There are many magic statistics in this world, and none of them should be used lightly.
The real scandal here, the more I think about it, is that an NAS panel was convened to look into this mess. They offered up mealy-mouthed words about errors in the statistics, and they said that the “conclusions” were basically correct. Not one of them commented on the multi-layered problems…no, wait…absurdities in the whole approach. It would be like an NAS panel reviewing a paper on astrology and mentioning errors in the statistics, and that the conclusions were correct, but neglecting to mention that the paper concerned astrology.
86ff (SteveM): in piecing together the sunspot record it is not assumed that every dataset is about sunspots. There are auroral counts, f10.7 radio flux, geomagnetic activity, etc. Each of these datasets can be individually calibrated in terms of sunspots and THEN assigned weights and combined into a sunspot record. So, the tree rings, etc, can be [and you have an easier job because things can be re-sampled] individually calibrated in terms of temperate [and if they cannot what good do they do as proxies?]. Then when all series have been so calibrated you combine them. I do not see the need for the overly complicated PC approach with its inherent dangers of having data ‘cross-talk’ between series.
Redo Sheep Mountain. As noted earlier, not only is there Starbucks in Bishop, there is also a really excellent bakery – grab sheep herders’ bread for the rugged journey. To be fair, they make you walk the last stretch of road to get to the trees. But it’s a day hike.
Re: #96
I like the quote from Ross McKitrick below where he politely concludes “they bury it in a lot of genteel and deferential prose”. I think that little bit of phraseology sums up an affliction of climate science that I see in it — or at least in some of it.
The M&M Project: Replication Analysis of the Mann et al. Hockey Stick
http://www.uoguelph.ca/~rmckitri/research/trc.html
#97. Leif,
That’s the problem. Tree ring chronologies go up and down. Most aren’t calibrated to temperature. Or the authors pick some and don’t use others that have no objective reason for exclusion other than that they don’t go up. Sometimes, the authors withhold the adverse data – e.g. Jacoby who only archived 10 treeline series that went up and discarded the 26 series that didn’t.
If they used all the treeline white spruce series (or other similarly defined class) in the world and averaged them, then the result would seem usable. But what seems to happen is that – after the fact – they pick the ones that go up as “temperature sensitive” and discard the others as non-temperature sensitive. Economic statisticians have gotten used to this sort of thing from stock market “systems” and learned to recognize and discard such studies. You can’t pick and choose after the fact. If you think that you’ve learned something, then you have to get fresh information to prove it.
Many readers here are familiar with this sort of problem, but it seems unfamiliar to climate scientists, who seem completely baffled by this sort of argument.
Great work Steve. Great work.
100 (SteveM): Attacking the finer details of PC and the ‘rules’ to use seems to be not a very productive way to go; to wit: the climate people and the AGW crowd don’t seem concerned or poised to change their ways. The sensible way to proceed is to look at a number of long proxies from trees [e.g.] that are still living in the locales where the proxies are from. Calibrate against the modern temperature record [I know it has been ‘adjusted’ and otherwise doctored], then proceed by simple weighting and averaging. What stands in the way of this? I just can’t believe that everyone in the dendro business is adverse to this.
Steve:
Something has been bothering me since the back story you referenced in #86 and discussed in #91 originally appeared. I’ve not set a foot in grad school for many years, but is it now common for grad students to have/need lawyers? Or is that an indication of just how contentious that data is?
I think this quote by Richard Muller just about sums it all up (Muller was an associate of the Alvarez group that discovered what killed the dinosaurs):
“Suddenly the hockey stick, the poster-child of the global warming community, turns out to be an artifact of poor mathematics.”
Regards,
Chris
They simply don’t understand the concept of proving assumptions, nor do they realize they’ve created a circular argument.
Mark
It has been thirty-two years since I was first exposed to the kind of analytical work ethic typified by many yuppie MBA-types who were hired to generate volumes of data and analysis so as to justify business decisions that had already been made.
MBH has all the look and feel of these kinds of analytical products — ones built to some predetermined outcome — except that the subject is climate reconstruction as opposed to business marketing analysis or business profitability analysis.
When all the layers of MBH are fully unwrapped and exposed, it has all the look and feel of an analysis product which has been constructed to a predetermined customer specification, in this case the requirement to discount the existence of the Medieval Warm Period.
It is my opinion that none of the climate scientists who produced MBH ever believed their work would be subjected to any kind of rigorous independent examination, one which could operate quite effectively outside of the peer review process they themselves tightly controlled.
Will the work Steve and Ross have performed, in revealing MBH for what it is, be of any practical near-term use in the realm of public policy debate?
Not yet… As far as the media is concerned, the science of AGW is settled. As much as I hate to say it, we will not see any serious notice taken of what Steve and Ross have accomplished until anti-carbon measures begin having a truly serious impact on people’s everyday way of life.
In all the discussion of RE and CE “verification” statistics, I have yet to see a mention of what their distribution is supposed to be when the reconstruction is in some sense valid.
The calibration period R^2, on the other hand, is easily transformed into a “regression F-test” of the hypothesis that all the regression coefficients are 0: With n calibration observations and k regressors (including the intercept), (R^2*(n-k))/((1-R^2)*(k-1)) is distributed F(k-1, n-k) if all the slopes are 0, so that a sufficiently big R^2 (as adjusted for sample size and number of regressors) indicates that at least some are non-zero.
Is there a similar theory for the verification RE and CE stats as defined by MBH98? If so, have MBH et al ever used this theory?
As a retired Christmas Tree Farmer, I can tell you that Cambium accretion occurs in less than thirty day periods depending on things including ambient temperature, but not limited to that. Bristlecones are unknown to me, but I have to say that for any group of people to assume so much precise information from such gross observations is ludicrous, even to an old Lumberjack.
The same kind of comment would apply in equal measure to the GCM’s; i.e. layers of assumptions built upon layers of assumptions built upon more layers of assumptions.
Likewise, if you are a funded AGW climate scientist pursuing MBH-like climate reconstructions from tree-ring proxies, it is easy to justify doing this kind of thing — generating precise information from a very limited sampling space while employing gross observation techniques and while making questionable assumptions about the physical processes and linkages.
You want to keep your job and your funding. Your customers — other climate scientists — want to discount the Medieval Warm Period. So you construct an edifice consisting of various analysis building blocks that in their sum total, support the customer’s larger need to discount the possibility that recent warming trends are within the boundaries of natural climate variation.
If you are a customer for these proxy edifices, and a Big Bad Analysis Wolf appears at the door driving a D9 Caterpillar bulldozer with the obvious intention of evaluating the structural integrity of your analysis building blocks — the ones you have just purchased at some expense with great confidence they will do the job — then the natural inclination is to shore them up as best you can, using whatever can be scraped together to keep those analysis building blocks stuck together.
This is what is happening now with Tamino and his ilk. (OK, maybe I’m a bit too harsh. Let me modify the term “ilk” by adding an “e” and rearranging the letters. “This is what is happening now with Tamino and his like.” )
“If you put tomfoolery into a computer, nothing comes out of it but tomfoolery. But this tomfoolery, having passed through a very expensive machine, is somehow ennobled and no-one dares criticize it.”
~ Pierre Gallois
#19
I get much higher r2, 0.0014 🙂
( http://signals.auditblogs.com/files/2008/03/ad1700.png )
And r2 for my versus Mann’s reconstruction (1700-1729) is 0.99996.
Really wonderful piece of information and I appreciate it that you share something so useful with the readers of this blog.
*
One Trackback
[…] post re-states points that I’ve discussed at length in the past. Here is a re-posting of a 2008 post on Tamino that deals with most of the issues in his realclimate […]