I’ve been re-visiting some proxy data; I noted last summer that Rob Wilson had archived a considerable amount of B.C. data in Aug 2007 and noticed that he subsequently archived the data versions as used in Wilson et al 2007 at NCDC here in Sept 2007. (Not all of Rob’s data is archived as he isn’t in control of all the data that he’s been involved with; for example, Brian Luckman of the University of Western Ontario is holding out on archiving data, notwithstanding commitments of the IAI program discussed here.
Wilson et al 2007 attempts to argue that the Divergence Problem is not necessarily as bad as it seems. They calculate a composite over the period 1750-2000 (so it’s relatively up-to-date) and, perhaps responding somewhat to criticisms from CA about the overuse of stereotypes, set as one of their criteria that the proxy not have been included in prior compilations.
There are many aspects of the methodological description that are better than has been traditional in the field, though the descriptions are far from perfect. Unfortunately, despite many promising features, efforts to replicate results using published descriptions and data quickly foundered.
Here are their criteria for selecting the 15 sites:
1. To ensure the independence of this study, only TR proxy series that had not been used in previous reconstructions of ENH temperatures would be considered.
2. As undertaken by D’Arrigo et al. [2006] each TR series must have acceptable replication (~10 series within each site chronology) from 1750 to present.
3. Nonpublished TR data must extend to 1995 or beyond.
4. The TR proxy series must correlate at >0.40 against an optimal seasonal parameter of ‘‘local’ gridded mean temperature data from the CRU3 [Brohan et al., 2006] land only data set. Even if a series correlates at <0.40, but the inferred association is significant at the 95% confidence limit, it was still rejected from further analysis.
5. No significant autocorrelation (as measured using the Durbin-Watson statistic) must be observed in the model residuals from regressing the TR proxy time series against the local seasonal temperature data. If a significant divergence exists between the TR data and local temperatures, this would be expressed as trend in the model residuals and hence they would be autocorrelated.
Unfortunately, they didn’t say how many series were examined to whittle down to the final 15: did they examine all the series at ITRDB? If not, how did they create a short list? In some cases, it sounds as though there was some sort of pre-screening. For example, they say of the Mongolia data used:
These two series were chosen from data presented by D’Arrigo et al. [2000] as they expressed the strongest response to summer temperatures.
Without knowing how the population was originally established, it’s hard to test the selection from first principles.
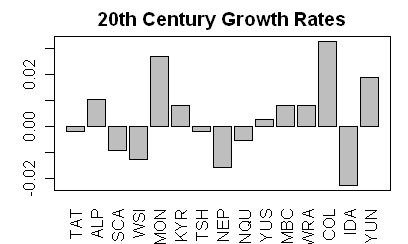
I thought that it would be interesting to look at the 20th century (1920-2000) trends for all 15 series in the network, which could be done easily using the data archived at NCDC here. This resulted in the following barplot of trends for each of the 15 sites. 7 of 15 sites showed a decreasing trend in the 1920-2000 period; there was certainly not a consistent pattern of 20th century increase.
To the extent that there was an overall increase, this was obviously strongly impacted by the two series marked here as “COL” and “MON”. “COL” is a bristlecone series from San Francisco Peaks, Arizona collected by students of Malcolm Hughes and “MON” is a composite of two Mongolian series collected by Jacoby (but not from the Sol Dav site used over and over again.)
The “COL” site (San Francisco PEaks AZ) was based on data from Salzer and Kipfmueller, discussed passim at CA in the past; it had also been collected by Graybill and is in included in Mann’s PC1 – to which, however, it was not one of the stronger contributors. Salzer and Kipfmueller’s article is new, but my guess is that they incorporated the earlier Graybill data, so strictly speaking, it may not be completely “independent” of the Graybill data. I’ll return to this on another occasion after I find out a little more about this site. Examination of this site is also hampered by the fact that Salzer and Kipfmueller have not archived measurement data, though they have archived their temperature reconstruction (which matches the Wilson et al 2007 version for the period after 1750 up to re-scaling and re-centering.)
Today I’ll discuss the Mongolian data, the site which showed the second-largest increase. Again, Mongolian data has been discussed here in the past, but not the two series in this study. Wilson et al describe their handling of this data :
This record was derived from combining two temperature-sensitive elevational tree line RW records from Mongolia–Khalzan Khamar (Larix sibirica; ITRDB code: MONG009, 49.55N, 91.34E [2500 m]) and Horin Bugatyin Davaa (Pinus sibirica; MONG009 [MONG008], 49.22N, 94.53E [2229 m]). These two series were chosen from data presented by D’Arrigo et al. [2000] as they expressed the strongest response to summer temperatures. The chronologies were detrended using standard methods, and after normalizing to the common period, averaged to derive a mean series. The period replicated with >10 series is 1636–1998. This composite record is independent of the Solongotyin Davaa record used in D’Arrigo et al. [2006] and correlates well (r = 0.70) with gridded June–July temperatures (Table 1).
There is a typo here as Horin Bugatyin Davaa is MONG008, rather than MONG009, but this is easily spotted. Site chronologies are archived at NCDC. I had previously downloaded these series and made time series from them. Following the above recipe, I determined the “common period” (1641-1998), calculated the mean and standard deviation for each series over the “common period” and used these to standardize the series, then averaged them using the following garden-variety script:
load(“d:/climate/data/tree/chronologies/r/asia/mong009.crn.tab”)
mong1=chron.crn
load(“d:/climate/data/tree/chronologies/r/asia/mong008.crn.tab”)
mong2=chron.crn
mong=ts.union(mong1,mong2)
count=apply(!is.na(mong),1,sum);temp=(count==2)
m0=apply(mong[temp,],2,mean);sd0=apply(mong[temp,],2,sd);c(m0,sd0)
mong=scale(mong,center=m0,scale=sd0)
mong=ts(apply(mong,1,mean,na.rm=T),start=tsp(mong)[1])
#this is the composite for use in calculations
I also excerpted the HAdCRU3 gridcell for 47.5N, 92.5W, calculating the Jul-Aug Jun-Jul average, according to the information in Table 1 ( using the NetCDF version of HadCRU3 that I downloaded last summer) as follows:
tmong=read.hadcru3(lat=49, long= 92)
seasavg=function(x,index) round(ts(apply( array(x,dim=c(12,length(x)/12))[index,],2,mean),start=floor(tsp(x)[1]) ),2)
tmong=seasavg(tmong,7:8)
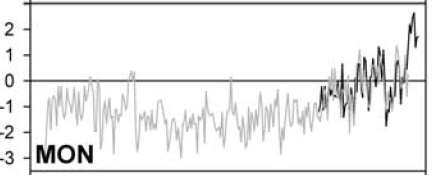
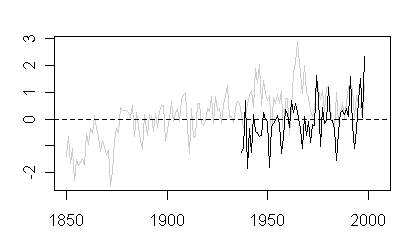
[Note: This paragraph has been revised to reflect comments by Rob Wilson below as my original calculations were done on July-August instead of June-July.] I calculated the correlation between the Mongolia tree ring composite and the gridcell series, hoping to replicate the reported value of r= 0.70. I obtained a value of 0.47, above the cut-off of 0.40 but much lower than the reported 0.70. Using July-August temperatures, I obtained a correlation of only 0.20. Here is the re-plotted graphic:
Here is my simple calculation:
Z=ts.union(mong,tmong);
cor(Z,use=use0)
# 0.467527 # was 0.1995141 for Jul-Aug
Here is a comparison of the plot in Wilson et al 2007 and my replication of their figure, plotted as follows:
temp=(time(Z)>=1850)&(time(Z)< =1998)
ts.plot(ts(Z[temp,],start=1850),col=c("grey80","black"),xlim=c(1850,2005))
Obviously, the versions plotted in Wilson et al 2007 differ from the versions that I calculated, especially for the tree ring data, but even for the temperature data. I did a regression attempting to relate the Mongolian version used in Wilson against the two archived chronologies; this should yield a perfect match, but didn’t. The 20th century (1920-2000) trend in the RW data in this calculation is negligible – it’s about the same as YUS.
  |
 |
Figure 1. The right panel shows my replication using June-July temperatures. My first effort used July-August and is shown at the foot of the post.
It’s possible that Wilson did not actually use the chronologies archived by Jacoby as MONG008 and MONG009, but instead re-processed the measurement data to produce his own chronologies. [Update: Wilson says below that he used chronologies supplied by D’Arrigo and he is in the process of investigating.] The methodology only says:
The chronologies were detrended using standard methods…
Presumably Jacoby’s archived chronology was also produced using “standard methods” – however, the results are obviously different. If, as seems to be the case, there are a number of different “standard methods”, referees in this field should not accept this sort of uninformative statement and should instead require authors to state what they did in terms that enable replication.
But regardless of the replication issue, the procedure that I used – which seems like a garden variety implementation of the described methodology – ended up with a different looking series, so the methodology is obviously not very “robust”.
In the selection protocols, they report the calculation of a Durbin-Watson statistic of 1.69, safely within the safe range of 1.5-2. In my calculation using a standard package as shown below, the DW statistic was 1.26, outside the minimum of 1.5, well into the danger zone and also outside acceptance criteria. The adjusted r2 statistic for this fit was 0.22 (0.024 relative to the Jul-Aug average).
library(lmtest)
Z=data.frame(Z)
fm=lm(mong~tmong,data=Z);summary(fm) #adj r2 #0.2055 #was 0.024 for Jul-Aug
dwtest(fm) #DW =1.26 #was 1.3181 for Jul-Aug
I’ve only done this gridcell so far. I’ll spot check a few others, including the Colorado one and see what happens.
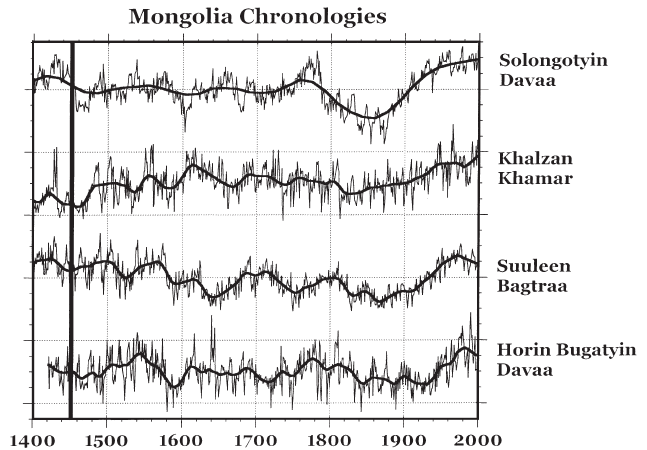
Update: Here is a figure from D’Arrigo et al 2000 illustrating one version of the Horin Bugatyin Davaa series.
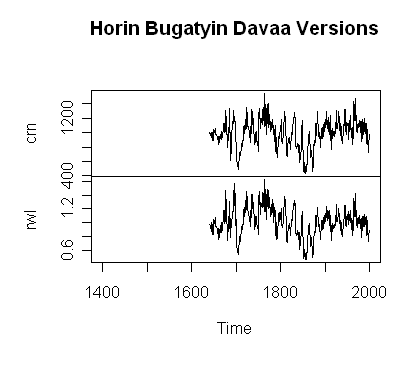
Here is a plot showing (top panel) the archived Horin Bugatyin Davaa chronology at ITRDB (mong008.crn). To double-check this, I calculated the chronology using a Jacoby-style using the measurement data archived for HBD (mong008.rwl) and obtained a very close match to the archived crn chronology. So whatever the screw-up is, the screw-up is not just the crn version, but the measurement data as well. Rob notes that the ITRDB version is shorter than the version illustrated in D’Arrigo et al 2000. The problem here is that the ITRDB version was archived in April 2004, some time after the original publication.
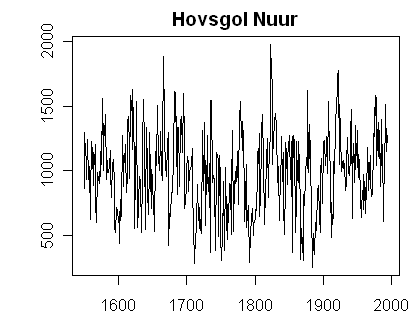
For comparison, I also examined the Mongolian sites at ITRDB for any other sites higher than the 2240 m of the HBD site. The mong001 site (Hovsgol Nuur) did not have any trend. For some reason, it wasn’t mentioned in the D’Arrigo et al 2000 study or Wilson et al 2007 study.
Reference:
Wilson, R., D’Arrigo. R., Buckley, B., Büntgen, U., Esper, J., Frank, D., Luckman, B., Payette, S. Vose, R. and Youngblut, D. 2007. A matter of divergence – tracking recent warming at hemispheric scales using tree-ring data. JGR – Atmospheres. VOL. 112, D17103, doi:10.1029/2006JD008318 pdf data
Note: This was the original graphic using July-August temperatures.


48 Comments
If I get an R^2 of less than 0.5 in my studies
my opponents claim it is not good enough.
Reported only because I’m currently studying FACE and ORNL carbon isotope tracer work, but relevant to above in findings:
http://warming.ornl.gov/TACIT.html
(My bolds) The first is similar to what I have often written on CA.
The second speaks for itself.
This work was reported to 1997. It does not contain the obligatory CO2 global warming statement, so it might have had its funds cut off by now.
Chuckle….!
Trying to drag me out of the woodwork again.
There are a couple of issues here:
1. Your analysis is against the wrong season. The optimal season in my analysis is June-July
2. The difference in the proxy records is more worrying and certainly there does seem to be some disagreement in our series. Of the two chronologies used, Khalzan Khamar (Larix sibirica; ITRDB code: MONG009) is the same data (you could use this on its own and the final results would not change much although the local r value will be weaker). However, we appear to have different chronologies for Horin Bugatyin Davaa. I used the version that was detailed in:
D’Arrigo, R. D., G. Jacoby, N. Pederson, D. Frank, B. Buckley, N. Baatarbileg, R. Mijiddorj, and C. Dugarjav (2000), Mongolian tree rings, temperature sensitivity and reconstructions of northern hemisphere temperature, Holocene, 10, 669– 672.
…..which is clearly longer than the archived version in the ITRDB. These data were provided to me by Rosanne D’Arrigo and I will check with her.
Rob
To Rob Wilson,
The only way to resolve the differences between global warming skeptics and global warming deniers is a true scientific dialog. Publish you results and let us take potshots at it. When you repair the holes (i.e. do the reanalysis necessary) all will have a better understanding of the problem. I personally do not think that tree ring data is useful unless it is destructive obtained. By this I mean full trunk slices at vary heights to eliminate anomalies in growth. I also think that to determine temperature reconstructions much more data most be obtained from the site and that is historically not available. That is not to say not to do them, just recognize that many other factors besides temperature result in tree ring growth.
[snip – OT about sun]
Steve: Larry, Rob is very industrious and has a commendable publication record. Nothing has ever stopped you from “taking potshots” at it. Rob has archived many tree ring series. He is not king of the world and cannot force non-compliant scientists to archive their data, but he’s doing what he can to set a good example with his own data.
#3. Rob, thanks for checking in on this.
The “wrong season” in this case was July-August as opposed to June-July. In any event, I concede that Table 1 reported June-July and my calcs were on July-August. I re-did the calcs using June-July. This recovered a temperature series that tracks Rob’s and yields a correlation of 0.47 to gridded temperature – which is above the cut-off but below the reported 0.70.
Clearly, the main difference is between the composite of the two ITRDB chronologies as compared to the chronologies that Rob used (supplied by D’Arrigo). There is a negligible 20th century trend in the ITRDB composite, but the composite of the unarchived versions supplied by D’Arrigo to Rob has a more pronounced trend.
That is certainly not wasted effort to do June-July and July-August regressions when one wants to look at sensitivties for selected months.
Why were June-July selected for the Wilson analysis? Any a priors or was the correlation merely better? In the end I would think that one would want to relate the TR growing season months to annual temperatures or forever be limited to talking about temperature trends for 2 monmths out of the year. If one sees a large difference between June-July and July-August correlations what does that say about June-July and JFMAMJJASOND?
Why use r and not r^2 when r^2 tells us the portion of temperature that the TR reconstruction explains?
My comment to Rob Wilson was not to criticize him but to congratulate him for participating in the process that is necessary to understanding it. Those of us [snip – with opposing views] ] also need to look at criticisms of our own work also. To me it is scientific method at its best
#7. The issues here are technical. Let’s restrict discussion to technical points and not to general discussion.
Rob, or someone, can you explain how it is KNOWN that one series is temperature sensitive, while another series is moisture sensitive, while another is insensitive to anything?
Steve: jae, let’s keep to specific issues raised by this paper. The general problem is sitting out there, but it’s a larger issue than is sensible to discuss in terms of the issues here.
Probably because that’s when the bulk of the growth occurs, and correlations SHOULD be better for this time period. But just what does a warm June-July have to do with the annual average temperature?
jae, d’Arrigo et al 2000 provide the following argument to support temperature as a limiting factor:
Jacoby et al 1996 says only:
This is all too typical of many articles – both articles do little more than make an assertion. The link to the prior assertion really adds nothing.
Re: #10
Perhaps my recollection is poor, but I believe I remember seeing other months selected in the same general geographic/elevation domains and not always limited to two months. I have never seen the differences for these selections explained.
Steve: For the most part, summer months are used, with some play between 1-2 months and some using 4 or so months. There are occasional departures from this – Salzer and Kipfmueller correlate to prior year’s annual temperature.
When I was looking up the above reference in Jacoby et al 1996 [discussing the Sol Dav site], I noticed the following very interesting comment about strip bark in Mongolia:
This mention is for Sol Dav, not for KK, but one can reasonably wonder whether strip bark forms occurred there as well.
Jacoby 1996 also mentions that Sol Dav is on the north side of the mountains; the aspect of the other sites is not mentioned in D’Arrigo et al 2000, but I suspect that all will prove to be north-facing : doesn’t that seem a little odd for sites where temperature is the main limiting factor? That seems more characteristic of trees that are trying to keep out of the direct sun.
Noted from a Rob Wilson quote from here:
http://www.climateaudit.org/?p=3007
This series correlates with mean May–September gridded temperatures at 0.43 (Table 1)…
So there you have it. Why is sometimes June-July and sometimes June-July-August and sometimes May-June-July-August-September and sometimes other months?
IMHO, better growth on north-facing slopes is a sure indication that moisture is the limiting variable. One can see that effect in any semi-arid location, but never in moist locations.
In fact, 1.5 is not a universal cutoff for the DW stat. The actual values depend on the sample size, the number of regressors, and the serial correlation of the regressors themselves. See, eg, http://eprob.math.nsysu.edu.tw/LomnWeb/homepage/class/92/DurbinWatsonTest.pdf. In a simple regression, with 1 regressor in addition to the constant, 1.26 is unambiguously significant at the 5% level (1-tailed test) for n %le; 25, but only because it is %le; 1.29, not because it is %le; 1.5. Conversely, 1.69 is only just barely in the “indeterminate” range for n %ge; 100. (In the “indeterminate” range, there is an exact critical value, but it depends on the serial correlation of the regressors themselves.)
Generally, if DW is near or above 2 and well above 1.5, you’re OK, while if it’s well below 1.5, you’re probably in trouble, but this is only a very approximate rule of thumb.
I guess I was supposed to use $ le ; ($le;) etc, rather than % le ;!
Steve, in your intro you give a list of tree selection criteria. Do I read correctly an absence of a criterion like “The trees are known to have tree ring patterns that are caused by temperature variation”?
If this criterion is indeed absent, the studies should be reported as gathering experimental data. If this precondition has been studied and is supportable, then and only then can the papers be used for reconstructive and projective thermometry.
In a nutshell, I believe that this cart-before-horse approach gives rise to a large part of the criticism of general climate science.
Steve quietly mentions:
Assertions which never seem to be proven anywhere except by circular arguments. Then Geoff adds:
And thus, why waste major effort disproving their statistics, given the vapour upon which ALL the data rests? I must agree with Geoff further about this being a major shortcoming of almost all GCS.
18:
And they do it unabashedly, as though it is normal practice in science! It is really strange.
I guess I’m just old school. Old, for sure… I still remember (I think) from my statistics classes, a long time ago, that you first define the population, then you sample it RANDOMLY. These treemometer guys do neither, in my understanding. You cannot define the population as “those tree series that show a temperature signal.” That is not a legitimate population description, because you have biased everything. There is no randomness, and NONE of the statistical theorems apply to the methodology. Is that now wrong in 2008?
Also, you are not allowed to define the population as, say, “all trees at their altitudinal or elevational limit,” and then cherry pick only those groves that meet the criteria for your pre-conceived hypothesis. Unbelievably and incredibly, that is just what is happening in some climate studies.
(Checking in briefly from on the road taking care of urgent Real World business 😉 )
I find these justifications for temp-limited growth quite fascinating. Raises curiousness about things like: to what extent is the “lush” vegetation observed over lengthy periods? California, Colorado and more have “lush” areas of vegetation in incredibly low-precip locations. All it takes is appropriate species, and the right kind of annual gully-washer rainstorm. Everything greens right up, produces lush greenery, seeds, etc… and then eventually bakes back to “golden” brown.
Bottom line: a few “green” observations may have little bearing on the temp/precip question…
Let me see if I understand what these spaghetti graphs are trying to prove. Is it:
“The tree ring data tracks within (pick a correlation number) back during some carefully selected period in the past, so therefore the recent data where the treemometers show rising temperatures trumps thermometer data which is ambiguous or maybe falling.”
This is science?????
What am I missing?
Steve: They don’t say this.
#18 Welcome aboard, Geoff. I’ve been criticizing exactly that problem here for years. 🙂 In my opinion, proxy dendrothermograms are physically meaningless, for that reason among others.
Rob’s comment in #3 makes me nervous. Why didn’t Rob used the data set that was archived? He says he got his data from Rosanne D’Arrigo rather than from the data bank. What is Roseanne thinking? What is the point of archiving data if you are going to provide researchers with a data set that differs from the archived data set?
I do not want to jump to conclusions here, but this kind type of thing is certainly open to mischief. After reading about the shenanigans Michael Mann pulled, it makes me suspicious. My apologies to both Rob and Roseanne if there is some logical explanation for this. But at this point climate scientists, especially dendros, need to be like Caesar’s wife.
Steve: The article Wilson et al 2007 certainly leaves the impression that he got the data from the ITRDB data bank as a specific ID number is mentioned. In my opinion, if the article says that he used ITRDB data, then he should have used ITRDB data in the first place. The trade really has to get away from these grey versions and AGU journals really have to start enforcing long-standing AGU policies on use of archived data on these recalcitrant dendros.
Greetings,
Looks like the archived chronology is spruce and the one I used was an unarchived Larch chronology.
The LDEO lab are looking into it.
Rob
#27. Rob, as I’m sure you well understand, this is exactly the sort of ludicrous situation that LDEO’s policy of selective archiving creates. This sort of stuff would be illegal in mining promotions and I don’t know why your trade puts up with it.
One can reasonably surmise that they intended only to report and archive the HBD chronology that went up (larch, I guess) and to withhold the HBD chronology that didn’t go up (spruce). D’Arrigo et al 2000 did not breathe a word that there were a second HBD chronology – one that did not go up. Obviously there is a lengthy precedent at LDEO for selective archiving, dating back at least to Jacoby’s “few good men” excuse for selectively archiving only 10 of the 36 treeline series considered in Jacoby and D’Arrigo 1989. Or their withholding of the updated Gaspe series that does not have the HS pattern beloved of Mann et al.
So it continues.
In this case, it looks like they made a “mistake” by archiving the “wrong” chronology; otherwise no one would have had any idea that there were two chronologies from the HBD site with different stories. What a crock. Rob, I know that you’re not king of the world but you really have to do what you can to read the riot act to these folks. If I were in your shoes, I would find this sort of stuff completely humiliating.
If it doesn’t “matter”, then why withhold the adverse data? Put it out there and argue why it doesn’t “matter”.
Rob, there’s also an issue for you in that, statistically, if you’re picking the series after they have already been pre-screened, any tests for statistical significance are completely screwed up – a point that seems obvious to econometricians but completely opaque to climate scientists and a point that you and I are at loggerheads on.
Keep it up guys. This site makes damn good reading.
There something to be said for a good detective novel. : )
Shades of the “Monty Hall” problem [which, incidentally, was reprised in a “Science Times” piece in the Tuesday NY Times two weeks ago, April 8th]. Statistical probabilities demand a random selection criteria for the tests to be valid. Biases introduced by pre-screening should not be ignored.
Agree. The study seems to start from this premise, which itself seems “vaporous”. Unlike some, I want to keep believing that the component(s) of trees registering sensitivity to tsi or warmth can be found, but there’s enough disagreement over which component(s) those are, or which trees, or when to sample them, to make further conclusions sound presumptuous.
Maybe I’m confused, but I thought (from previos exchange on this site), that Rob Wilson explicitly stated that they do only look for trees that correlate to temp and then use those data sets.
Regardless, mega kudos to Rob for his participation…this is the type of thread that makes this blog so important, IMO. Mr McIntyre, I can almost feel your blood pressure spiking in #28…and I agree that it (as appears) is very upsetting.
Also, Mr McIntye, I would have to think that perhaps at this point with your vast study of the dendro work you may be one of the leading world experts in this field. I hope we soon see more of your contributions in the peer reviewed literature.
Thanks
Re #31, I believe the general case is that many dendros recognize that trees respond to a range of stimuli (water, temperature, soil, co2) as a first order response. The concern is to what level any of these stimuli represent THE limiting factor for growth. Rob Wilson’s methodology merely selects those trees which respond best to temperature during the calibration period. Of course, it is no guarantee that the response to temperature remains consistent throughout the entire observation period. At least in Rob Wilson’s case, it appears that any and all trees which had a significant response to temperature during the calibration phase are indeed included in the study regardless of where that data may lead.
jae, you ask, “But just what does a warm June-July have to do with the annual average temperature?”
Globally quite a bit (HadCRUT3 data), a correlation of 0.87, p less than .000001).
Locally, seems like not much (only looked at a couple of Siberian temperature datasets, correlation 0.15 and 0.17 between July/Aug and annual temps.)
w.
Jedwards says:
But a true dendro would be looking at the reason spruce and larch respond differently when compared to the same temp and CO2 records. Are they trying to learn something about the trees, or just support other useless proxies?
Willis: thanks, that is amazing. Maybe we can just use those two months from now on 🙂
Re #35 I would agree with you, but then how much of the total body of dendro work are we actually looking at on this website. I certainly have not done an exhaustive search on the total corpus of dendro publications, but I would venture that there are many studies on various aspects of tree growth. If the particular one you recommend hasn’t been done, then perhaps an enterprising grad student in search of a dissertation topic will take it up. If the Abneh thesis is any indicator, I would say that the next 4 years may start seeing an upsurge of varying viewpoints within the field.
re: #37 Jedwards
Somewhere on this site there’s a link to one of the dendrochronology journals from early times which posted all their early issues on line a year or two ago. There are lots of good articles there which can be read by anyone interested. Maybe someone has the link handy to repost?
Re: #34
I have posted the correlations for seasonal versus annual temperature trends for most of the USHCN stations in the US over long time spans and found a wide range of correlations with the average correlation not being very impressive. I will repost it when I locate it.
It goes to my point also on obtaining an answer to why a wide range of different months and numbers of months are selected for the TR versus temperature calibrations in papers reporting temperature reconstructions.
Can we assume that it is the local temperatures that are critical to TR growth? I cannot see the global correlation using the average of all global stations for 2 months versus annual even being relevant.
Re # 33 Jedwards
Here you refer to the first order response, but plants are somewhat more tricky than that. My first post-grad job was on factorial experiments with pots given a wide variety of controlled combinations of postulated controlling influences. The findings were commonly that yields of leaves, stems and roots (we were doing grasses and legumes) were a complex outcome of interactive factors, as virtually all experimenters find. Then, change the conditions of one variable and another set of complex interactions emerges. I hate to be knocking dendro all the time, but I find it fanciful to think that non-isotope dendrothermometry can work at all.
With nutrients, the leaky bucket analogy is often used. The bucket with many holes will empty to the lowest hole (c.f. yield). Patch that and it levels higher, etc. I do not think it can be assumed that there is prior evidence that CO2 as a nutrient equates to the top, a mid or the highest hole at any location, indeed with any tree. To continue the analogy, when you patch one hole in the bucket, others can “change position” so to speak, with higher order interactions.
It’s rather sad to read of the provisos that have to be put on past work of this type to justify more. A bit like the last breath of a dying man.
The stats are fascinating, but the stories I am reading are as much of human frailty as the growth of plants. The last breath again. It makes one appreciate the honest realists.
Steve,
Your response to my #26 really caps it for me. If Rob’s article identifies by number the particular ITRDB data set used and he did not use it, well… geez. What can one say to that? [Steve: snip – far too strident]
I suppose this means you are going to publish a Corrigendum and thank Steve McIntyre for pointing out your error. You certainly need to set the record straight.
Steve: Ron, errors happen. But this sort of error shouldn’t happen. It only happens because of the pernicious use of grey data that so infects the dendro field.
When there’s a lot to keep up with, sometimes things get missed. Assumptions made that turn out to be incorrect, something gets switched when it shouldn’t and it’s not noticed, bunches of things to go wrong trying to deal with a lot of data. It happens in every field.
re:42
Sam,
I am sure you are a very nice man and understanding guy. Actually, my employees would tell you I’m a very understanding guy as well. But if Rob was working for me, a mistake like that would really piss me off. In fact, I’m still pissed off. If I understand this correctly, it changes the conclusions of the paper.
Steve,
Thank you for snipping me. Some tongue-lashings should not be given in public. Can you please restore the line that shows the second part of my comment was directed to Rob?
Ron: I just thought you were being a bit too outraged at one person for the sorts of things that happen in an entire field. So what Steve said, ” pernicious use of grey data “. Hardly the same as putting an engine into a car backwards. 🙂
It looks like LDEO archiving one HDB and giving out a different one rather ruined the statistical signficance tests by being pre-screened. For everything or just that series? How ruined? Sure seems a mess.
Maybe this episode will help to get the problem fixed.
Re: #39
I calculated the correlations of the summer months to annual temperatures for 1189 USHCN stations from 1920-2005 using the Urban Calc. Mean data set. I excluded 32 stations that had more than 20 data points missing. The histogram below shows the distribution of correlations for these 1189 stations. The data indicate that on average the 3 summer months’ temperature only explain 30% of the annual temperature (mean correlation = 0.55) for the USHCN stations scattered across the lower 48 states of the US.
re 45. you should select only those thermometers that are temperature senstive
Dave:
If there’s more than one journal with a free Dendrochronology archive in the States, I don’t know about it. The Tree Ring Bulletin starts in 1934 while AE Douglas was still editor. It’s a great resource. I wish you much pleasure, and clearer understanding than mine, in reading.
Bill
Curses! That one went into the rough. I’ll repost, and perhaps Steve will kindly delete the incorrect address above.
Dave D. asked for a link to a dendro journal with a historical archive. I believe there’s only one with free access, and it is quite interesting, starting with A.E. Douglas Editorship in 1930’s:
One Trackback
[…] et al 2007 (previously discussed here) considers a Kyrgyzstan series that has numerous issues – the usual provenance problems […]