On previous occasions, we’ve noticed some strange appearances of the Mann hockey stick under different disguises. In Inconvenient Truth, a splice of Mann’s hockey stick and CRU instrumental data is described as “Dr Thompson’s thermometer”. Today, I noticed another peculiar incident, where Esper and Frank (Clim Chg 2008), who one would think would know better, identify Mann’s PC1 as originating from Lloyd and Graumlich 1997.
Esper and Frank 2008, entitled The IPCC on a heterogeneous Medieval Warm Period, is fairly critical of IPCC conclusions. They discuss the proxies in IPCC AR4 Box 6.4 Figure 1 (interested readers may also look at my Erice presentation where this figure is discussed.) They list the proxies as follows:
Proxies shown in the AR4 include an ice core record from W Greenland (Fisher et al. 1996), a multi-proxy record from E Asia (Yang et al. 2002), and six treering records representing: SW Canada (Luckman and Wilson 2005), W USA (Lloyd and Graumlich 1997), N Sweden (Grudd et al. 2002), NW Russia (Hantemirov and Shiyatov 2002), N Russia (Naurzbaev et al. 2002), and Mongolia (D’Arrigo et al. 2001)…. Importantly, all tree-ring records shown in AR4 were detrended using a method known as ‘Regional Curve Standardization’ (RCS; Esper et al. 2003).
Now Esper himself produced a chronology from Graumlich foxtail measurements, which is actually quite similar to nearby Sheep Mountain bristlecone measurements and which I’ll discuss briefly below. First I simply want to show that IPCC used Mann’s PC1 and not the Graumlich series.
IPCC AR4 Second Draft
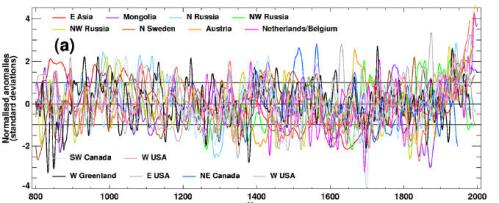
First here is the figure from the IPCC second draft. The Mann PC1 is not labelled as such, but is the orange series (“WUSA”) with one of the most distinctive closing uptrends. The Graumlich series (light purple), also labeled “WUSA”, also has a closing uptrend, but does turn down a little at the end. The data is noted as coming from the Osborn and Briffa 2006 collation (which I’ve used in my plots below).

SOD Legend: Box 6.4, Figure 1. (a) The heterogeneous nature of climate during the MWP is illustrated by the wide spread of values exhibited by the individual records that have been used to reconstruct NH-mean temperature. Individual, or small regional averages of, proxy records used in various studies (see Osborn and Briffa, 2006), (collated from those used by Mann and Jones (2003), Esper et al. (2002) and Luckman and Wilson (2005) but excluding shorter series or those with an ambiguous relationship to local temperature).
To highlight the differences between the two series, I’ve replotted them below, Mann PC1 in red, Graumlich in light grey.

In Review Comments on the Second Draft, I objected to the inclusion of both Mann’s PC1 and foxtails. Here’s the comment on the PC1 (see the source for the next comment criticizing the foxtails):
6-1143 B 29:14 29:14 One of the most prominent series on the right hand side of Box 6.4 Figure 1 is Mann’s PC1, which uses his biased PC methodology. It is so weighted that the series is virtually indistinguishable from the Sheep Mountain bristlecone series discussed in Lamarche, Fritts, Graybill and Rose (1984). These authors compared growth to gridcell temperature and concluded that the bristlecone growth pulse could not be accounted for by temperature, hypothesizing CO2 fertilization. Graybill and Idso (1993) also stated this. One of the MBH coauthors Hughes in Biondi et al 1999 said that bristlecones were not a reliable temperature proxy in the 20th century. IPCC Second Assessment Report expressed cautions about the effect of CO2 fertilization on tree ring proxies, which were not over-ruled in IPCc Third Assessment Report. At a minimum, the relationship is “ambiguous”. In addition, I tested the correlation of this series with HadCRU2 gridcell temperature and obtained a correlation of 0.0. Osborn and Briffa say that they themselves did not verify the temperature relationship for this data. Why not? At any rate, in this example, the authors have not excluded an important series with a well-known “ambiguous” relation to temperature. [Stephen McIntyre (Reviewer’s comment ID #: 309-39)]
This comment was rejected as follows (but the rejection acknowledges the use of the Mann PC1):
Rejected – the purpose of this Figure is to illustrate in a simple fashion, the variability of numerous records that have been used in published reconstructions of large-scale temperature changes. The text is not intended to give a very detailed account of the specific limitations in data or interpretation for each. Furthermore though there is an ambiguity in the time-dependent strength of the response of Bristlecone Pine trees to temperature variability, there is other evidence that these trees do display a temperature response . Right or wrong, Mann and colleagues do apply an adjustment to the western trees PC1 in their (1999) analysis to account for possible CO2 fertilization. Other authors ( Graumlich et al ., 1991) assert that the recent rise in some high elevation conifers in the western U.S. could be explained as a temperature response (she can not confirm the LaMarche et al findings). The issue is clearly complex , as will be noted in a new papragraph on tree-ring problems that will be added to the text
IPCC AR4 Final Draft
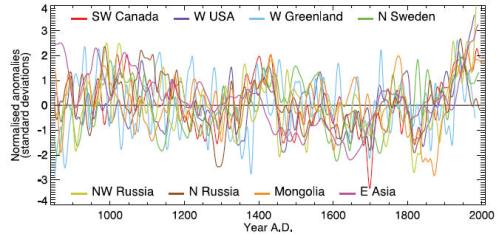
In the final draft, the number of illustrated proxies was pared down, with the Graumlich foxtails being dropped. Here’s the graphic with the caption. Comparing captions, one notes two interesting changes. First the attribution of versions to Osborn and Briffa 2006 is deleted. This is unfortunate as the versions illustrated here can at least be traced in Osborn and Briffa 2006, but cannot necessarily be spotted in the citations provided here. Second, notice the change in criterion – the earlier version used an “ambiguous” relationship to temperature, this one uses “no” relationship.
Looking at the form of the one remaining WUSA series, it clearly has the shape of the Mann PC1 going up at the end, rather than the foxtail series, which is similar but with a slight downtick at the end. So we can safely conclude that the series illustrated in the IPCC document is definitely the Mann PC1 (Sheep Mountain) and not the Graumlich series.

Box 6.4, Figure 1. The heterogeneous nature of climate during the ‘Medieval Warm Period’ is illustrated by the wide spread of values exhibited by the individual records that have been used to reconstruct NH mean temperature. These consist of individual, or small regional averages of, proxy records collated from those used by Mann and Jones (2003), Esper et al. (2002) and Luckman and Wilson (2005), but exclude shorter series or those with no evidence of sensitivity to local temperature. These records have not been calibrated here, but each has been smoothed with a 20-year filter and scaled to have zero mean and unit standard deviation over the period 1001 to 1980.
Although the foxtail series is attributed to Llloyd and Graumlich 1997, neither this chronology nor any similar chronology appears in that article, which I’ve placed online here. Nor does Lloyd and Graumlich even say that their foxtail series records medieval temperatures; quite the opposite. They conclude that their foxtails were limited in growth by medieval drought.
The period from 950 to 550 BP illustrates the extent to which water balance can reverse treeline response to temperature. Whereas climate appears to have been warm when treeline forests expanded, warmth does not necessarily lead in subalpine forest expansion.
Graumlich reported a number of other treeline sites, which did not have HS shapes. Indeed, she opposed Graybill’s CO2 theory largely on the basis that she could not replicate his results.
I discussed strip bark at these foxtail sites here, obtaining confirmation from Andrea Lloyd on a concordance of names. She also provided an interesting confirmation from Andrea Lloyd about Pete Holzmann and my strip bark theory. I identified several trees whose growth patterns looked a lot like Almagre strip bark and asked her to check if these trees were strip bark in her notebooks. Bingo. They were.
There is one other notable mis-identification of provenance in Esper and Frank – one which is endemic. Briffa’s Yamal version is attributed to Hantemirov and Shiyatov 2002, which actually has a non-HS chronology from that site. Juckes made the same incorrect identification.


12 Comments
The link to the presentation does not work.
Re: Stan Palmer (#1),
Try http://data.climateaudit.org/pdf/mcintyre.2008.erice.pdf .
“Why,” he asked with a raised eyebrow, “does this not surprise me?”
If you go back to the orginal “bender on Gaspé” thread from two years ago you will find the very same conclusion applies to Canadian eastern white cedars. And in my annotated bibliography in “unthreaded #36” you will see the very same conclusion applies for treeline white spruce in Yukon and Alaska. So now you have three cases of a diminished MWP in North American coniferous tree ring proxies. I think these observations may be ripe for a review article.
Wow.
Just wow.
Learning more every day.
How can you tell a strip bark proxy from the others? It’s a bit amazing that the experts making the papers can’t pick them out.
BTW, I back calculated coefficients for the Mann 08 paper and recreated the graph using only 131 proxies.
Why is it called a hockey stick and not a Hydra?
Jeff,
Nice work on “Less than 11 Percent.” Another fascinating Cherry Picker Depicter. If a reader has not gone over to see this, they should. Good topic for separate post here.
I can’t see the problem. We know all temperature readings are teleconnected, so all papers on them must be as well. So it doesn’t really matter whose you put upon the list, ‘cos they’ll none of them desist, from repeating Mann’s mist….
Sorry, I’ll get my coat…
Will the real hockeystick please stand up, or can we officially say there isn’t one?
Esper and Frank (Clim Chg 2008) is
Esper, Jan, and David Frank, 2008. The IPCC on a heterogeneous Medieval Warm Period. Climatic Change, published online before print September 17, 2008, and it is available at
Click to access Esper_2008_CC_online.pdf
I copy as follows:
“6 Conclusions
The debate on MWP heterogeneity started over a decade ago, when Hughes and
Diaz (1994) compared several long-term climate reconstructions available that time. This early analysis, however, suffered from comparing tree-ring records where the low-frequency climate variability was preserved (i.e., RCS detrended) with non-RCS chronologies, and overlooking sample replication issues. These factors helped in reaching the conclusion that the MWP was heterogeneous. Since then, several large-scale studies have been published demonstrating that data sparseness and low replication before about 1200 introduce random variations in the single records and increase uncertainty in any subsequent hemispheric scale average (Cook et al. 2004; D’Arrigo et al. 2006; Frank et al. 2007b). This evidence should not be confused with spatially heterogeneous temperatures during MWP. Given the wide acceptance of the AR4 and the notion of a more chaotic climate towards the Dark Ages, it thus seems relevant to recall that we currently do not have sufficient widespread, high-resolution proxy data to soundly conclude on the spatial extent of warmth during MWP.”
Re: Timo Hämeranta (#11),
The experts are starting to get it!
One Trackback
[…] tentou completar sua tarefa, apresentando uma coleção bem escolhida de dados que mostravam que, enquanto algumas reconstruções históricas de temperaturas mostram um […]