Here are the ocean proxies used in Trouet et al. As usual in Team studies, it is a total mystery how they are selected. Trouet et al is a bit different from usual Team studies in that it argues for a MWP-LIA global reorganization, something that I’ll get to soon.
Today, I want to chat some more about the proxies themselves. I’ve already reviewed the Cape Ghir alkenones (an SST proxy inverted in the Trouet graphic) and the Palmyra coral proxies. I’ll quickly review the other proxies.
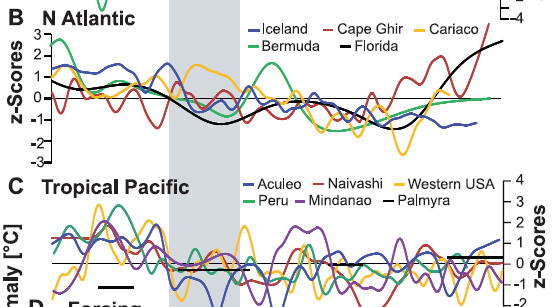
Sicre Iceland Ocean Sediment
Sicre et al 2008 is the temperature reconstruction from alkenones (MD99-2275). The smoothed graphic shows an elevated MWP offshore Iceland – which is consistent with both regional and global MWP. I’m unaware of any digital version of this data; Trouet seem to have used “grey” data of the type that all too often floats around the Team. [Update – a CA reader sent me this data which I’ve placed online. See link in Refs. Update 2- this is now at NOAA.]
This has a very big MWP as shown in the plot – similar to but the spline doesn’t quite match Trouet)

Bermuda
This is Keigwin’s Sargasso Sea d18O data often used as evidence of an MWP. It is digitally available online. A detailed discussion at CA here here .
Florida
I haven’t posted on this data, though it’s mentioned here . Lund et al 2006 archived data, but the thing that’s shown in the Trouet figure doesn’t appear to occur in any of the digital information. It looks to me like Trouet have illustrated the Lund et al estimates of Florida Current transport (their Figure 3 is shown below – oriented here with AD2000 at the right to match the Trouet figure.)

Lund et al 2006 Figure 3. Transport reconstruction for the Florida Current. b, Estimated total transport 0–1100 yr BP. The most probable transport values (thick black line) are based on mean densities in Fig. 2. The grey circles represent transport estimates based on density values randomly sampled from within the error envelopes in Fig. 2, while the dashed lines represent the 95% confidence limit for the transport calculation (see Methods).
Cariaco
I’ve had a few posts on Cariaco, most recently in connection with David Black’s 2007 study (a very high resolution study that was promptly archived) – see here here, but also elsewhere.
Trouet don’t use Black’s data, but an earlier 2001 data set by Haug showing Ti content – a very widely cited data set BTW, that has been said to show north-south movements of the ITCZ, a topic that I’ve discussed from time to time.
Aculeo
They cite Jenny et al 2002 for this series. I’ve examined the article online here and I am unable to even guess what series is being represented in Trouet et al. as there is nothing remotely close to the Trouet illustration in the article.
Naivasha
This is Vershuren’s sediment series (estimating past lake levels), mentioned in passing in connection with Mann et al 2008 here , also here. The data set was also used in the discussion of a warm Warm Pool MWP by Newton et al 2006 (See CA here). I’ll discuss whether there is a relevant difference between the viewpoint of Newton et al and Trouet on another occasion.
Western USA (Cook PDSI)
This is Cook’s PDSI. This was discussed in a couple of early CA posts – here in connection with Mann’s claim at RC that Cook stood as authority for exclusive use of an RE statistic – an untrue claim, since Cook claimed verification RE and CE as well. Also here in connection with replication issues, but I haven’t considered recently. I’ve discussed medieval drought on a number of occasions, including a discussion of submerged timber here, a topic also visited by Trouet coauthor Nick Graham.
Peru
This is Rein’s lithics data, which is available online, and which I’ve used in the past as an example of a non-European series with a pronounced medieval anomaly. See for example my AGU 2006 presentation speech notes PPT. It’s also used in Newton et al 2006.
Mindanao
This is one of Lowell Stott’s Mg-Ca series showing a warm Warm Pool MWP (discussed previously at CA on a number of occasions – here and here ) with related data used in Newton et al. Data is available online, but I haven’t figured out which series is embodied in the Trouet version yet. Again I used this series in my 2006 AGU presentation as an example of a series with a MWP anomaly. Alicia Newton presented at the same session and charmingly put down Mann and Hughes who attacked her presentation.
As a general comment, I’m familiar with nearly all of these series. The only “new” ones are the Sicre Iceland series (which has an elevated MWP) and the Aculeo series (which I can’t make head nor tail of right now). Many of the other series are ones that I’ve cited as showing a MWP anomaly and/or have been used by studies such as Newton to argue a more northerly ITCZ in the medieval period – a concept that Willie Soon would not oppose. So it becomes increasingly hard to see what in Trouet et al “scuppers” the skeptics. Tomorrow, I’ll compare their circulation ideas to William Gray’s.
References:
- Cook, E. R., C. A. Woodhouse, C. M. Eakin, D. M. Meko, and D. W. Stahle. 2004. Long-Term Aridity Changes in the Western United States. Science 306: 1015-1018. http://tomix.homelinux.org/~thomas/eth/7_semester/large-scale_climate_variability_WS_2006_2007/unterlagen/edit/droughts_cook.pdf
- Haug, G. H., K. A. Hughen, D. M. Sigman, L. C. Peterson, and U. Rohl. 2001. Southward migration of the intertropical convergence zone through the Holocene. Science 293: 1304-1308.
- Jenny, B., B. L. Valero-Garcés, R. Villa-Marti´nez, R. Urrutia, M. Geyh, and H. Veit. 2002. Early to mid-Holocene aridity in Central Chile and the southern westerlies: The Laguna Aculeo record (34 S). Quaternary Research 58, no. 2: 160-170.
- Keigwin, L. D. 1996. The Little Ice Age and Medieval Warm Period in the Sargasso Sea. Science 274, no. 5292: 1503.
- Lund, D. C., J. Lynch-Stieglitz, and W. B. Curry. 2006. Gulf Stream density structure and transport during the past millennium. Nature 444: 601-604.
- Sicre, M. A., J. Jacob, U. Ezat, S. Rousse, C. Kissel, P. Yiou, J. Eiríksson, K. L. Knudsen, E. Jansen, and J. L. Turon. 2008. Decadal variability of sea surface temperatures off North Iceland over the last 2000 years. Earth and Planetary Science Letters 268, no. 1-2: 137-142. Data
- Verschuren, D., K. R. Laird, and B. F. Cumming. 2000. Rainfall and drought in equatorial east Africa during the past 1, 100 years. Nature(London) 403, no. 6768: 410-414.
![Reblog this post [with Zemanta]](https://i0.wp.com/img.zemanta.com/reblog_e.png)


12 Comments
re: Cariaco
Black’s data ends in 1990. Does Haug’s stop c. 1900 as per the appearance of the yellow spaghetto in the N Atlantic graph?
The skuppering notion appears to lie exclusively in the idea expressed by Truet that “Since the NAO is no longer predominantly positive, it cannot be the cause of recent higher temperatures”. However if you only look at one of the oscillationa then you are perhaps missing something. There is a fine juxtaposition here:
http://climateresearchnews.com/2009/04/et-tu-trouet/
with the recent paper by Wang, Swanson and Tsonis, GRL (2009): ‘The pacemaker of major climate shifts.’
who consider the “network of North Atlantic Oscillation (NAO), Pacific Decadal Oscillation (PDO), El Nino/Southern Oscillation (ENSO) and North Pacific Index (NPI)” and conclude rather differently from Trouet. ie they say the entire 20th century anomaly can be explained by the collective behaviours of all cycles and that we are in for a period of cooling, then warming, then cooling again.
But the unscientific, rush-to-judgment statements of Trouet and Mann ignore that realists have been saying all along that the oceans were more important than had been assumed. Far from being skuppered, we are vindicated. The Trouet’s of this world are, in reality, being forced bit by bit towards the realist side, fighting a rearguard action all the way.
Am I the only one who sees the Lund chart backwards?
Re: Harold Morris (#3), It’s been flipped because the “years before present” notation is confusing when comparing with “year AD-BC” notation.
Re: Andrew (#4),
I t’ndid neve eciton
Re: Jeff Alberts (#5), The really funny part is that your word order is right, but the reverse letter order makes you read like Yoda. “notice even didn’t I”. 😀
You know, I wonder if I should ask my relatives if they have noticed a “transport increase”-we live in Florida. It might also be worth noting another study by Lund and Curry in 2006 showing the MWP in the Straits of Florida:
Lund, D.C. and Curry, W. 2006. Florida Current surface temperature and salinity variability during the last millennium. Paleoceanography 21: 10.1029/2005PA001218.
Re: Andrew (#7),
So certain are you?
Re: Jeff Alberts (#11), Alright, knock it off or we’ll get snipped.
Here is the graph from the paper I mentioned in 7:
Now, the peak is obviously earlier than the usual Mannian time period, but still-interesting, isn’t it? Compare with the above “current transport” proxy.
Thanks Andrew…I read right through the word “oriented” and did not catch it. Then, I was so fascinated with the effect that I thought I was caught in a Linux mirror.
I’ve plotted the Sicre Iceland data which has a very pronounced MWP – not surprising since Iceland is the heart of the conceded MWP, but still a very pronounced result in a high-resolution series.
What is Trouet saying about NZ and Aussie speleotherms now?
BTW I love the smackdown of MWP record after MWP record from all these regions. This is the part of the drama where the serial killer suspect is in interrogation and the cop slaps down photo after photo, evidence after evidence….
So when do we see a pilot show for CSI: Global Warming?
Re: Mike Lorrey (#9), The problem is, where would you find an unbiased jury?
2 Trackbacks
[…] alkenone series as it was used in a multiproxy study by Trouet et al 2009 – see CA discussion here. Trouet “solved” the divergence problem in best Mann et al 2008 style: by turning the […]
[…] Cape Ghir (used inverted), it was one of the proxies in Trouet et al 2009 discussed at CA here. Here is a figure showing the updated Sicre version against the Trouet et al illustration. The […]