As it happens, the image Gore presented actually was Mann’s Hockey Stock, spliced together with the post-1850 instrumental record as if they were a single series, and not Thompson’s ice core data at all. See Al Gore and “Dr. Thompson’s Thermometer”.
In fact, Thompson and co-authors really had published an admittedly similar-looking series in Climate Change in 2003, that was supposed to have been the source of the Gore image. (See Gore Science “Advisor” Says That He Has No “Responsibility” for AIT Errors.) But despite Gore’s claim that it measured temperature, Thompson had made no attempt to calibrate it to temperature. Instead, it was an uncalibrated composite Z-score series based on oxygen isotope ratios for 6 ice cores, going back to 1000 AD.
In 2006, Thompson and co-authors published what should have been an even better series, based an additional seventh series and going back 2000 years, in the prestigious Proceedings of the National Academy of Sciences. This “Tropical Composite” Z-score series (TCZ) is shown below. Although again it is not actually calibrated to temperature, it does have the distinctive “Hockey Stick” shape, with only a faint Little Ice Age, and only a trace of a Medieval Warm Period. (Click on images for larger view.)

Figure 1
Limited data for Thompson’s article was posted at the time of its publication on the PNAS website. Although TCZ and two regional sub-indices go back 2000 years as decadal averages, data on the component ice core data only go back to 1600 AD, as 5-year averages. Nevertheless, this data should be adequate to determine how TCZ was constructed from the underlying series, and then to determine if it can be validly calibrated to temperature, and if so what the significance of the relationship is and what the confidence interval is for the reconstruction, if only back to 1600AD.
Figure 2 below shows Thompson’s posted data for the 4 Himalayan cores that were used, and Figure 3 shows his data for the 3 Andean cores. In both figures, the posted 5-year averages of δ18O isotope depletions have been aggregated to decadal averages for comparison to TCZ. Surprisingly, the raw data does not suggest the distinctive “Hockey Stick” shape of TCZ in Figure 1, with its record high in the decade of the 1990s. In particular, only two of the series extend completely into this decade, and of these only Quelccaya ends on a record high.

- Figure 2


Figure 3
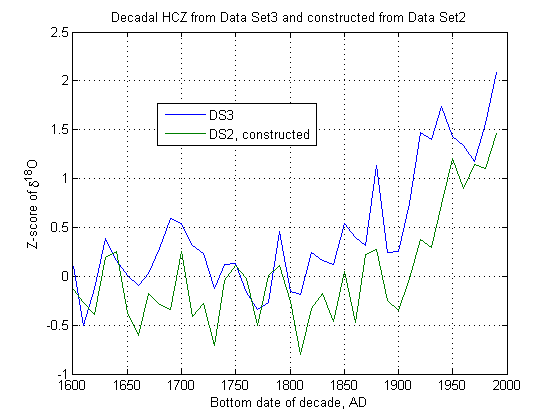
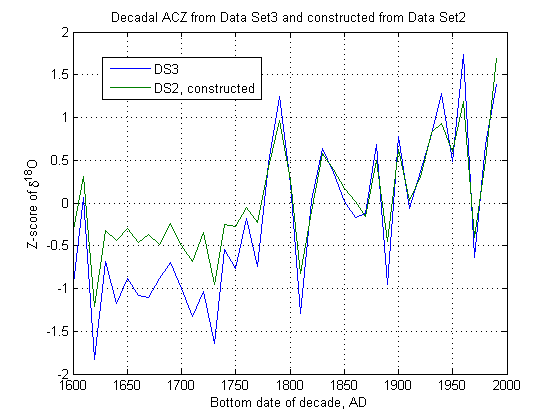
Thompson’s data on the PNAS website does include decadal data for the past 2000 years on two regional sub-indices, a Himalayan Composite Z-score index (HCZ) presumably based on the 4 Himalyan cores, and an Andean Composite Z-score index (ACZ) presumably based on the 3 Andean cores. These are shown in Figure 4 below, for 1600-2000 for comparison to Figures 2 and 3.

Figure 4
Thompson et al. (2006) do not indicate how TCZ was derived from the underlying data, but it should be possible to back whatever formula was used out from the published data and sub-series.
In my EE paper, I first regress TCZ on a constant, HCZ and ACZ, and find that the constant is essentially zero, while the weights on HCZ and ACZ are both essentially 0.5. The t-statistics on the HCZ and ACZ coefficients were an off-the-charts 567.49 and 805.64, respectively. The R2 is 0.999985, or essentially unity, while the standard deviation of the regression errors is 0.0028. Since the three indices are only tabulated to 2 decimal places, rounding error alone could account for a standard deviation of s = 0.01/sqrt(12) = 0.0029, so the regression is essentially a perfect fit to within rounding error.
The formula for TCZ was therefore simply TCZ = (HCZ + ACZ)/2. It is not clear why one would want to average Z-scores in this manner, but at least it is a well-defined and replicable formula.
If HCZ and ACZ were any linear function of their component series, it should similarly be possible to use a linear regression to back these relationships out of the data with comparable R2 and s.
In a regression of HCZ on Guliya, Puruogangri, Dunde and Dasuopu, R2 was only 0.7673, far less than expected, and s was 0.2897, or 100-fold larger than it could have been due to rounding error alone. Two of the series, Guliya and Dunde, were insignificantly different from zero (t = 0.41 and 1.14, resp.), and so may as well not have been used at all. The other two, Puruogangri and Dasuopu were significant (t = 3.29 and 6.90, resp.), but their t-stats fall far short of those that should have been obtained with any exact linear relationship.
If the individual isotope ratio series were calibrated to temperature before aggregation into the regional indices, one would expect unequal, and possibly even zero, coefficients on the series, so that there is nothing per se wrong with not using Guliya and Dunde. Nevertheless, if the index really was based on these series, whatever coefficients were used should have come through in this regression.
In order to check if time-varying coefficients were used, I split the full sample of 37 decades for which all series were available into four subperiods of size 10, 9, 9, and 9. I found that even Puruogangri was not significant at any level worth mentioning, except in the last subperiod (1890-1979). In the third subperiod (1800-1879), not a single one of the four slope coefficients had a t-statistic greater than 1 in absolute value, and the hypothesis that all four were zero could not be rejected with an F-test (p = 0.399).
The results for the Andean composite ACZ were less incoherent, but still unacceptable. R2 was 0.9871, which is big for an ordinary regression, but far less than expected for what should have been an exact fit. The error standard deviation s was 0.1032, which is still 30-fold larger than can be explained by rounding error alone. Although the t-statistics were not close to those in the first regression, a clear pattern emerged that Quelccaya and Huascaran received approximately equal weights, while Sajama received about half their common value.
I naturally first attempted to clear up this apparent discrepancy informally, by e-mailing Lonnie Thompson and most of his coauthors on Jan. 23, Jan 26, and again on Feb. 6, 2008, but received no reply from any of them. An abstract of my note, with details in an online Supplementary Information, was then submitted as a letter to PNAS, but was rejected on the grounds that PNAS does not publish corrections to articles more than three months old! Energy and Environment kindly agreed to publish my comment instead.
It is conceivable that TCZ in the posted data was constructed from an already obsolete or less reliable version of the ice core data. If so, Thompson et al. should provide PNAS a corrected version of TCZ, HCZ and ACZ that is actually based on the posted ice core data. Or, if the posted ice core data was already obsolete or considered less reliable when TCZ was constructed from better data, they should instead provide a corrected verion of it, so that the relationship of TCZ to its actual component series can be confirmed. In either case, the ice core data should be extended back to 0AD to include all the data that was used in constructing TCZ, in order to permit replication of the pre-1600 portion of this now-questionable series, as well as its calibration to instrumental global temperature.
It should be noted that already in 2007 Steve McIntyre appealed to PNAS to ask Thompson to post complete data for this paper, but with no success. See “More Evasion by Thompson” and preceding threads. Thompson’s ice core data is a potentially valuable source of information about pre-instrumental global climate. It is most unfortunate for science that he has not posted complete and consistent versions of all his data. [See, in particular, “More on Guliya” and “IPCC and the Dunde Variations” and preceding posts. — HM]
Until Thompson either corrects the TCZ series or provides corrected ice core data that is consistent with it, no credence can be placed in this supposedly improved version of “Dr. Thompson’s Thermometer”. And until PNAS insists that he post consistent and complete data, it can have no more credibility than that famous science humor publication, The Journal of Irreproducible Results.
Update based on May 1, 2009 Comment #123 below:
It turns out that the root of the problem is that the decadal average Z-scores shown in Thompson's Figure 6 and my Figure 1 above, and tabulated back to year 0 in Data Set 3, are not the decadal averages of the 5-year average Z-scores shown back to 1600 in Thompson's Figure 5 and in his Data Set 2:

Evidently different data was used for Figure 6 (which Thompson compares approvingly to the MBH99 HS) than for Figure 5, even though the article and SI give no indication that this was the case.
The problem is not isolated to the data for just one region, since the two regional indices have the same problem:
It turns out that the Data Set 2 composite scores really can be constructed as linear combinations of the Data Set 2 core data, with all coefficients for the appropriate regions highly significant as if from an exact fit to within rounding error. The included coefficients are similar but unequal, as if z-scores were computed from the d18O data and then averaged for each region.
However, the problem cannot just be that Figure 6 was computed from the same data but using standard errors for the 2000-year period instead of the 400-year period of Figure 5, since then there would still be an exact (though different) linear relation between the Figure 6 composites and decadal averages of the Figure 5 core data. As I show in my EE paper, no such linear relation exists.
So the problem still persists — which is the right data to use to construct an ice core temperature proxy? The data of Figure 5 (which at least is identified by core number in DS2), or the (unspecified) data of Figure 6?
Since Figure 5 is not representative of the data that was used to construct Figure 6, Thompson has failed to provide, as required by the PNAS data policy, sufficient data to replicate his results. At a minimum he should identify the archived cores that were used to construct Figure 6, and provide detailed data for any unarchived cores that were used.
![Reblog this post [with Zemanta]](https://i0.wp.com/img.zemanta.com/reblog_e.png)


148 Comments
Why should we be surprised by lack of reproducibility in paleoclimatology? Isn’t that the norm?
So, will Al Gore be brought up on charges for lying to Congress?
RE Jeff Alberts, #2,
Probably not. For one thing, it was not Gore himself, but rather Rep. Jan Schakowsky who wrongly affirmed to the House Energy and Commerce Subcommittee that Gore’s graph was not Mann’s Hockey Stick. See Schakowsky: ‘a different source which our staff had confirmed with Al Gore'”.
This was admittedly on Gore’s say-so via her staff, but Gore himself was not under oath. In any event he probably sincerely believed that the graph was Thompson’s, and therefore would not have been lying even if he had testified to this effect.
The true blame for the perpetuation of the error lies with Gore’s official science advisor Thompson, who noticed the error right away, but has never published so much as a press release on his Byrd Center website to correct the record. See “Gore Scientific ‘Advisor’ says that he has no ‘responsiblity’ for AIT errors”.
Thanks, Hu.
So because no one was under oath, it can all be safely ignored by Congress, apparently.
May I make a slight detour before asking a question about Thompson’s work? Forgive me if I am simply displaying a beginner’s error. Remember the Ian Jolliffe comment about Mann98 on Tamino’s blog:
This seems to me to be classic English understatement. Is it not pretty basic in Econometrics that you can obtain apparently significant but spurious results from unrelated data if the series are non-stationary (i.e. their mean and variance are not constant over time)?
I was surprised that more was not made of this comment, because it appears to undermine totally the whole Mann enterprise. If spurious regressions are a danger when doing regression on a single non-stationary series then how much worse must the situation be when you do PCA on a whole bunch of them? The more I have learned about Econometrics the more doubtful I am of the merit of Mann’s use of PCA.
It is not clear from the discussion above whether the data found from each of Thompson’s ice-cores is stationary over the time series – but from my less than great understanding of the physics of the formation of ice-cores my guess is that this seems pretty unlikely. So my questions is this – to what extent has analysis of Thompson’s data (such as it is) tested for and (if it were found) taken into account non-stationarity?
Hysterical! Truly an example of what Kuhn called “scientists behaving strangely”.
Excellent bit of statistical forensics Hu. Simple and inventive. I’ll add it to my list of ‘errors of AGW science’. One question. You found TropicalCZ is the average of HimalyanCZ and AndeanCZ, but why are there Himalyan cores in a Tropical index at all? I didn’t see you express any surprise at this, only that the indices were averaged. If not averaged, how should the Z series be treated?
Question: Do these glacial ice core data sets get corrected for the fact that the locations the cores are taken from, the lower ice was created typically at a higher altitude and thus colder climate, than the higher newer ice that was created at lower altitudes and warmer temperatures, due to glacial migration? It stands to reason that the newest ice in any ice core is going to exhibit atmospheric isotopes in it typical of the lowest and warmest altitude.
Re: Mike Lorrey (#8),
This seems a most significant point. I am not well versed in glaciers (Australia has none) so I cannot answer the question, which caught my attention as logical.
I raise it here again in the hope that someone can say “Yes, we routinely correct for this effect” or “No, but we need to examine it”. Any expert commentators?
BTW, welcome back, Steve. Hope all is well, I’m pleased to see the fire in the belly still burning bright. Hu has stepped up magnificently.
Re: Geoff Sherrington (#135),
Ooooh Geoff
Tasmanian alps have many small glaciers.
Re: ianl (#136),
Do these Tasmanian glaciers have names and are they listed on world databases? You’re not getting mixed up with New Zealand are you? Or with the heavy frosts of late?
Re David Stockwell, #7,
Good question. Although I didn’t mention it in the post, in the paper I observed,
So if Thompson wants to call mid-latitude Tibetan sites “tropical,” that’s his call, as far as I’m concerned. He’s the climate scientist.
It is admittedly a huge stretch to call the TCZ index, even if it can be calibrated, a global temperature index, because it only represents two regions. Craig Loehle’s 18 widely-dispersed temperature proxies (see http://www.econ.ohio-state.edu/jhm/AGW/Loehle/) have a far better claim to represent global temperature.
But still, Thompson’s two regional indices, if appropriately calibrated to temperature, might be a useful addition to such any future update of his reconstruction — The map shows that Craig has no S. Am. proxies at all, and that Tibet and vicinity is only indirectly represented through the Chinese composite proxies.
What I originally suspected was that Thompson had simply selected his underlying weights so as to maximize the overall fit to the MBH Hockey Stick. But the fact there are no well-defined weights at all is a more fundamental problem.
Incredible.
Re: John A (#10), Yes well that is a good point and one I have run up against, with Science and Nature too. If there is going to be a sunset clause it should be 2 years after publication IMHO. And thanks for the clarification Hu.
Re: David Stockwell (#11),
It looks and smells like censorship to me. Can you imagine GRL trying to pull that one with the responses to Steve and Ross’ papers?
“Gore … says that it provides independent evidence for the validity of the “Hockey Stick” temperature reconstruction of Michael Mann and coauthors.”
He does not say that at all. He doesn’t mention Michael Mann at any point in the film.
Why publish in Energy & Environment? It has zero impact and is not taken seriously.
Re: RW (#12),
No he doesn’t mention Mann by name in the film, but he certainly mentions the Hockey Stick both in the film and the book:
The graphic that accompanies these statements in the book is the same as the film:
Why Energy & Environment? Because its a journal that doesn’t hide behind spurious bureaucratic rules in order to defend the indefensible through censorship.
There certainly is no mention of the so-called hockey stick in the film.
What you say about Energy & Environment may even be true. But it doesn’t change the fact that the journal has no impact and is not taken seriously.
Re: RW (#15),
Postmodern philosophers are strongly criticized by physical scientists when they say science is socially constructed. The statement above demonstrates the worth of their insights. Science as science is practiced is a social enterprise. The “hockey stick” is a social construct. Publication in Science or Nature is a social and not a scientific act.
Re: TAG (#17),
It would indeed appear that publishing something climate related in Nature or Science is a “social” rather than a “scientific” act as papers on that subject matter are now predominantly referenced by the accompanying press releases which contain the “message” rather than their abstract which presumably contains the findings.
The press release accompanying the recent Steig, Mann et. al. paper on temperatures in Antarctica is a useful example of this phenomenon.
In my humble opinion an r squared of 0.999985 is not compatible with oxygen isotope methods in earth sciences, no matter what the application.
Hu, you would seem to have recited the essentials in an eminently readable manner that would be hard to refute. (The Tropic of Cancer is currently 23 degrees 26 minutes and 22 seconds North).
The words ‘hockey stick’ do not appear in the film An Inconvenient Truth.
What you say about this blog may even be true. But it still doesn’t change the fact that Energy & Environment has no impact and is not taken seriously.
Re: RW (#19),
“…Energy & Environment has no impact and is not taken seriously.” Yet, An Inconvenient Truth is? Nice.
Re: RW (#19),
I have checked the transcript and what you say is trivially true. Nevertheless the temperature reconstruction presented in the film is the Mann Hockey Stick overlaid with the surface temperature record compiled by the CRU.
What Gore says is:
He’s pointing to the Hockey Stick.
The book of the film calls it Dr Thompson’s thermometer, but its the Hockey Stick nevertheless.
By whom? You? Al Gore? Michael Mann? Who cares? Whether or not it is taken seriously depends on who you ask. I could argue with considerable justification that most tier-1 journals have no impact at all. Journals publish. Resumes get longer. Academic life goes on.
This blog has considerable and demonstrable impact. Ross and Steve have published articles in E&E that had considerable impact in piercing the obstructive behaviour of certain key scientists. Questions were asked in Congress about those articles. Some of those individuals availed themselves to write rebuttals of articles written in E&E. If E&E had no impact and was not taken seriously those things would never have happened.
Are you going to give us chapter and verse on what impact is, or is this just an attempt to bore us all into submission?
Re: RW (#19),
There’s an old saying…A picture is worth a thousand words.
Re: RW (#19),
In logic this sort of statement is known as the fallacy of Poisoning the Well. It attempts to discredit an argument on a basis not related to the argument itself. It is, of course, closely related to the ad hominum fallacy, except that it doesn’t directly attack the person making an argument but instead attacking something related to the person.
Thus if I say that anyone who hides behind initials in attacking someone, isn’t worthy of being listening to, it might be considered either an ad hom or a poisoning the well, depending on what one thinks about posting anonymously, but it clearly would be logically invalid.
Re: Dave Dardinger (#40), Dave, can you point me to a list of principal fallacies with definitions? It would be most helpful to be able to name the beasts by such descriptive names, when they appear.
Re: Lucy Skywalker (#42),
Hmmm. I haven’t gone searching online. I suspect there are such lists and probably even Wikipedia would have a good list… yest a quick check there produces a useful list which has a decent definition of the poisoning the well fallacy
The particular version RW used, where he dismisses an argument due to the supposed lack of impact of the journal where it was published, fits, assuming you are the sort of person who accepts appeals to authority:
which is a sort of sine qua non of being a alarmist warmer. In this particular case it’s actually asserting something to be false because of an appeal to lack of authority and attributed to a journal.
Re: Dave Dardinger (#54), thanks, I forget wiki sometimes. This list of prime argument types is nice, and it has this example for argumentum ad ignorantiam :
This is the fallacy of assuming something is true simply because it hasn’t been proven false. For example, someone might argue that global warming is certainly occurring because nobody has demonstrated conclusively that it is not. But failing to prove the global warming theory false is not the same as proving it true.
Modern day ethics have undergone a transition from previous generations. It is no longer a question of what is right or correct or true. When something is published, be it false or illegitimate or fraudulent, it carries enormous weight regarding “truth” and “acceptance” UNLESS it is challenged by a subsequent publication. If the former is not challenged, it eventually becomes fact — because most people are only interested in the results and do not bother with “details” like methods, data, assumptions, etc.
RE Jim Hill, #5,
While unit roots can cause special problems with PCA, that is irrelevant to Thompson’s work, since he is not using PCA.
They can also cause special problems for regressions if not taken into account. If one were to try to calibrate Thompson’s data to temperature (which he never attempted to do, but which should have been done), it makes a difference whether or not temperature and/or the regression residuals have unit roots.
However, in a new working paper, at
http://www.econ.ohio-state.edu/jhm/papers/MomentRatioEstimator.pdf, I argue that although a unit root in regression residuals substantially increases the uncertainty of the coefficients, it does not necessarily mean an OLS regression is “spurious”, nor that valid se’s cannot be computed for the coefficients.
The absence or presence of a unit root in temperature can affect how one would run a calibration regression. If temperature has a unit root (or virtually a unit root), then one’s prior for distant past temperature is essentially uniform, and it’s appropriate to regress the proxy on temperature, as in UC’s “CCE” (Classical Calibration Estimation). But if temperature is clearly stationary, then one’s prior for distant past temperature is the distribution of historical temperatures, and one may as well just regress temperature on the proxy, UC’s “ICE” (Inverse Calibration Estimation, though some would think of this as the more “direct” approach). Either way a unit root proxy will give a unit root reconstruction, but the reconstruction will be much more attenuated using ICE, with its implicit prior of stationarity, than using CCE, with its implicit uninformative prior.
Hu, thank you very much for your reply to my question and for the link to your working paper. I am at present taking a course in Econometrics, and your paper is just the sort of stuff I should now be able to understand. I promise to work carefully through it.
Before I read the Jolliffe’s comment in September last year I do not think that had come across the problem of non-stationary series in MBH98 PCA. Now I know a bit more about it, (although I have not yet studied PCA in any detail), it does seem to identify a devastating weakness with MBH98 and its successors. So I am therefore a bit puzzled that people, like yourself, who know a great deal more than I do about this have not followed it up in any articles or blogs I have seen.
John A: the claim was made that “In Al Gore’s movie… [he] says that it [Mann’s hockey stick] provides independent evidence for the validity of the “Hockey Stick” temperature reconstruction”. That claim is false.
The impact of scholarly journals can easily be quantified. However, the organisation which maintains a comprehensive database of science journal impact factors only includes those which meet certain basic standards. Energy & Environment is not one of them.
Re: RW (#25), All that matters is that Hu is later cited by a paper in one of the journals with “impact”. Regardless, it is more important to publish than not to publish. The former has a chance to have an impact; the latter has none.
Re: RW (#25),
You’re right. He doesn’t say it. But his presentation in the film implies ice core records in the context of Lonnie Thompson’s work was the basis of the graph presented and the words in his book clearly imply that the graph is an independent verification of Mann’s Hockey Stick when its nothing of the kind. Both claims by Gore are easily refuted.
Now you’re moving the goalposts to suit your argument. Your argument against E&E was “the journal has no impact and is not taken seriously”. You’re now claiming that an organization which compiles “impact factors” does not include E&E, which isn’t the same thing at all as whether the journal “has impact”. It also doesn’t establish what “being taken seriously” means (if that means anything at all).
It could imply that you don’t take Hu’s work seriously because well, life’s too short to consider the work when you can simply dismiss the journal instead, even though the reason why it ended up in E&E was the strange application of a rule in PNAS that no-one had ever heard of before. So Hu’s work may well have been published in PNAS had the editor wanted to – because censorship means never having to say you’re sorry.
Re: John A (#28),
And that reminds me that a fourth option for the author and/or his supporters is to dismiss the journal’s prestige as a reason for not replying to the paper’s content. That option, I suspect, would only be employed when a direct question arose as to why the author might be ignoring the Hu M paper.
Anyway I want to commend Hu M for his efforts. In my view, he is handling this situation in a logical manner to best get at truth. Are not Hu M and Lonnie T both at Ohio State Univ?
Re: RW (#25),
No doubt, a number can be calculated, but to say the “impact can be easily quantified” is a bit of a stretch.
I’m afraid this fits into the Einstein quote (perhaps paraphrased): “Not everything that can be counted counts, and not everything that counts can be counted.”
For those who believe Wikipedia, this gives a summary of some of the problems with “impact factor”.
http://en.wikipedia.org/wiki/Impact_factor
The history of science is replete with “low impact” publications. Perhaps a lesson for both “sides” can be found in the example of J. Willard Gibbs, the father of thermodynamics:
http://www.chemistryexplained.com/Ge-Hy/Gibbs-Josiah-Willard.html
Woops. OK, so maybe Gibbs is the father of modern thermodynamics.
I guss my “Carnot knowledge” isn’t what it ought to be. 🙂
Gore, Smore. Should we really care, in the context of this thread, what a politician with an agenda has to say about this proxy or any others for that matter? To me the important point of what Hu M has done here is to look at the individual proxies from a statistical and forensic perspective and conclude you cannot get there from here.
He has left the door open for the author(s) to provide an explanation for the apparent contradiction that he has revealed in this paper. That is what I think we should be discussing here. The true test will be the reaction of the author(s) to Hu’s paper. Answer by revealing all the source data used and methods of weighting. Answer, but without revealing the critical information (the most difficult option to pull off in my view) or ignore the paper all together.
RW is missing an important point about the impact of E&E. If it publishes legitimate corrections ignored by the original journal, it will soon have an impact. RW seems to arguing for the inertia of ignorance.
He argues similarly about the graph in ‘A Convenient Untruth’. Is RW unconcerned about the misrepresentation by Gore of what he is presenting on film? Is RW unconcerned about the fundamental incorrectness of the graph? Is RW a Champion of Chicanery?
=============================================
I would like to note that this policy at PNAS is not unheard of. Steve brought it up in regard to the MM comment on MBH 08.
So that criticism at least is not fair.
As for whether the policy itself is open to criticism, that is another issue. I can see the point in limiting such short submissions to be close in time to the original publication. Longer fully fleshed rebuffs should be accepted much longer than 250 word pieces.
Kim said…. Is RW a Champion of Chicanery?….. Yes.
… and hair splitting, it would seem also.
So, at the editor’s discretion, PNAS enforces their policy of a 3 month limitation on rebuttals, but won’t enforce their policy on data availability so no meaningful rebuttal can be made within the time limit. Is this evidence of impact factor?
How about you, RW, do you take Hu’s paper seriousaly?
RW reckons that – “the journal” …(Energy and Environment)…” has no impact and is not taken seriously.”
I for one am rapidly coming to the conclusion that you (RW) and others who mumble the mantras ‘peer review’ & ‘respected journals’ and so on, are becoming as irrelevant to climate change as prayer wheels.
It is rather like the old-fashioned generals at the start of WWII who relied on fixed fortifications against a modern mobile force which, in the event, simply went around them.
RW, the journals which have heretofor been considered ‘respectable’ subsist on their reputations built in what were, for them, happier times, at least in the field of climatic and paleoclimatological studies.
Whilst they are fussing about whether or not to insist on data from Dr Mann (or whoever) being made available or archived (or whatever), publications on the net are doing it (or finding out those who don’t).
In an age when information moved at a vastly slower rate, the journals in which you continue to place your whole faith were a primary means of disseminating new research and new discoveries. In persisting with outmoded methods and technology, alas, they and their readers are in the process of being outflanked as a direct consequence of a technological revolution in which they (and you) seem unwilling to play a part.
As I learn about an ever increasing number of completely unintelligible papers published by these journals, I must increasingly take issue with the ‘respected’ appellation which you apply to them.
They (and you) are in mortal danger of being outflanked by a modern world which is rapidly moving on.
Hu,
Any idea why they would not have attempted to calibrate the series to temperatures?
And if E&E keeps publishing work of the quality of Ernst Georg Beck (or whatever his name is) then people will continue to ignore it.
Of course the quality of the articles is not in question with the cheerleaders on this blog. Rah Rah!
Re: Boris (#43),
So what’s your opinion of the quality of Hu’s article?
Re: Boris (#43),
Unlike those like yourself with the special knowledge of where to find the only truth, the rest of us are reduced to actually having to read the papers before deciding whether something may have some value. There are “cheerleaders” and then there are sheep…
Re: Boris (#43).
E&E published a number of papers that were cited in the IPCC’s Fourth Assessment Report: there are six such papers included in the Reference list of Chapter 3 of the WG3 contribution alone. These included two papers by Castles and Henderson; two responses to the C&H critique by teams of, respectively 15 and 18 IPCC lead authors; a further paper supporting some of C&H’s main points by three of Australia’s leading economists (one of whom covered similar ground in a paper subsequently published in ‘Climatic Change’); and a further review paper by David Henderson.
These papers have not been ignored: at least some of them have been cited in reports of the Millennium Ecosystem Assessment; the US Climate Change Science Program; the House of Lords Committee Review of ‘The Economics of Climate Change’; the Stern Review; the Treasury report on the modeling of the Australian Government’s proposed emissions reduction scheme; and papers, submissions and books by leading scholars such as Alan Heston (UPenn), William Nordhaus (Yale University), Erwin Diewert (University of British Columbia), Richard Tol (Hamburg, Vrije and Carnegie Mellon Universities) and Angus Maddison (University of Groningen).
Other papers published in E&E were not cited by Chapter 3 of the WG3 contribution to AR4, but should have been. For example, a paper by Jacob Ryten which was strongly critical of the papers by IPCC SRES authors previously published in E&E was not mentioned in the IPCC chapter, perhaps because Dr Ryten had remarked that ‘I cannot help being shocked by the contrast between the scenario team’s bold assertions and peremptory dismissal of the arguments advanced by Castles and Henderson and their manifest ignorance of the conceptual and practical issues involved in developing and using inter-country measures of economic product.’ Jacob Ryten is an eminent statistician who was head of economic statistics at Statistics Canada for many years and who had been the consultant to the United Nations Statistical Commission on the International Comparison Program.
E&E also published a paper by the Australian economists Peter Dixon and Maureen Rimmer, a commentary on the paper by Richard Tol and a response from Dixon and Rimmer. These papers too were ignored by the IPCC, although they did cite the D&R paper in its original, non-peer-reviewed conference paper version. The failure of the IPCC authors to cite the final peer-reviewed version of the paper and the subsequent exchange may reflect their unfamiliarity with the literature, or perhaps it was a deliberate effort to downplay the impact of E&E.
It is also worth noting that the IPCC SRES authors have never replied, either in E&E or anywhere else, to the severe criticisms of their work in papers by McKibbin, Pearce & Stegman and Dixon & Rimmer which had been published in E&E. It’s all very well for RW to say that the M,P&S and D&R papers are ‘not taken seriously.’ Why not? The authors are highly regarded economists.
Re: Boris (#43),
If follows that since Boris has not published in E&E, he’s not taken seriously…
Heh, Boris, the Vector of Vapidity.
======================
I meant to say that it’s all very well for RW to say that papers published in E&E, such as the ones I identified, are ‘not taken seriously.’
Re: Impact
Let us use impact as a measure of whether something
is contributing to the exchange of ideas. An interesting
indicator in the present age is Google Scholar.
The article
Corrections to the Mann et. al.(1998) Proxy Data Base and Northern Hemispheric Average Temperature
by McIntyre and McKitrick
is listed as having 83 citations is quite a diverse range
of outlets. 83 citations is very good and certainly
having an impact in the interplay and development of
ideas.
Re: Jim (#50),
Thanks Jim for this idea, which can be applied to illustrate some of the points in my post #47.
The number of citations listed in Google Scholar to the E&E paper by Nakicenovic et al (2003) is 37, and the number of citations to the E&E paper by Grubler et al (2004) is 26. These were papers by teams of IPCC SRES authors that were cited in Chapter 3 of the WG3 contribution to AR4. Several of the co-authors of the papers were also Lead Authors of the IPCC chapter concerned (one was a Coordinating Lead Author). The IPCC authors effectively generate the impact of the papers they choose to cite.
In the case of the E&E paper by Ryten (”MERs, PPP and IPCC: Illusions and Reality”), which was a direct response to the two E&E papers by SRES authors but not cited in the IPCC chapter, Google Scholar lists only 2 citations.
This is not because Jacob Ryten’s paper was of an inferior quality: quite the contrary.
Ryan O, #41, writes,
No — Perhaps they tried and couldn’t, perhaps they didn’t know how, or perhaps they just weren’t sure which of several approaches would be most appropriate.
But as it stands, all they have is a “Dr. Thompson’s Z-mometer”, not a “Dr. Thompson’s thermometer” as claimed by Gore in his book. Although Thompson et al invite their readers to compare their Z-score index to Mann’s Hockey Stick, they make no actual claim that it has any specific relation to temperature.
As UC has pointed out repeatedly on CA, there are many interesting and non-trivial issues involved in calibration. I have an idea for an improvement over CCE that I would have liked to have tried out on the partial data they provided to generate an actual temperature reconstruction, if only back to 1600, and if only for these two regions.
But since the data they posted doesn’t appear to be what they really used for their index, it became more important to try to pry the actual data out of them. E-mails didn’t work, so I tried PNAS and then, since PNAS wasn’t interested in the replicability of the results they had published, EE instead.
Has anyone here considered the discussion at the following in relation to this and related threads? It seems to me that Frank, Esper, Zorita, and Wilson (2010) describe quite a “step back” away from confidence in millennial multi-proxy reconstructions:
Click to access Frank_etal_WIRESCllmChange_2010.pdf
As usual in ClimateScience-TM no one wants to be explicit in taking on Mann and his attack dogs (lap dogs?).
Yet, one does not need to read behind the lines to see that Frank-Esper-Zorita-Wilson were not expressing anything like Mann’s confidence that the field of paleo climatology has moved steadily forward with all the Mann associates reconstructions.
Indeed, Frank, Esper, Zorita, and Wilson (2010) describe AR4 as “stepping back” from any high level of confidence in millennial temp. Reconstructions. They attribute this to greater uncertainties about the data than was recognized in 1998-2001.
That sees to me to be a dramatic accomplishment of Steve McIntyre and his statistical colleagues here at Climate Audit.
How sad that people in climate science cannot acknowledge this with candor.
E&E is peer reviewed. They just don’t allow reviewers to censor something interesting. My work published there has had a quite vigorous review.
Hu
I appreciate that you have tried to submit this to PNAS as a comment, and it was rejected (properly) on the three month rule. However, it seems to me that you could consider writing to the editor about this paper. Specifically, PNAS has an instructions for authors (http://www.pnas.org/site/misc/iforc.shtml), where it says:
It even provides you with an address to complain to “Contact pnas@nas.edu if you have difficulty obtaining materials.”
This must be a hot issue at the moment with the NAS currently doing a report on data availability (and PNAS being an arm of the NAS). For my money, your approach should be entirely affable, and you should be interested in replicating the PNAS results; but you simply cannot do so, until the authors provide data and methods. You also have demonstrated that you emailed the authors, so they are not being helpful.
It will be of great interest to see the response of the Editor. There is also the issue that science ( as mentioned above) is a social construct; if several people complain about data availability (i.e. not just poor steve), then the editor will become much more focused on the issues that he is addressing.
**********************
**********************
Secondly, I think the point about E&E does bear consideration, even if I don’t take it as a criticism. E&E is not indexed in ISI Web of Knowledge, nor pubmed. So while there might be a separate Economics indexing service, for most academics who search the literature E&E papers are unable to come up on their searches. The more general point about publishing a climate paper in an Economics Journal also holds; you are clearly at the fringes of “peer” review.
None of which detracts from the necessity of evaluating what is written; however, most scientists won’t be able to find the article, and even if they did, it isn’t necessarily “peer”-reviewed. So these are barriers for the merely inquisitive.
per
Re: per (#55),
Your point about climatologists finding the article is probably true. However, even we non-statisticians are aware that the statistics in climatology are abused as a matter of standard practice. Hu’s paper is a statistical analysis so I expect the peer review in E&E was likely more poignant. My humble opinion is that passing through agw advocates for a proper peer review is not required for a paper dependent on statistics rather than interpretation of the source data.
From Hu’s paper.
Wow, continually amazed.
If you’ll permit me Hu (snip if you want of course). Ryan O has been doing a bit of work attempting to replicate the statistical analysis of Steig et al and run into some interesting problems.
Re: per (#55),
We have had lots of discussion on the margins here, but the main issue is as Per notes in the excerpt above. That it might not be an entirely statistical issues was made clear by HU and along with a potential remedy. Hu has left the door wide open for the authors critiqued here to offer details and explanations. The answer cannot be in this case what it sometimes is in others: that all the data are available or sourced if those attempting replication are willing to put in the effort to replicate from ground zero.
I suppose any scientist or group of scientists, and their supporters for them, can play bureaucratic games to avoid a direct reply, but as I remember the true scientists from my former life that is not something that comes naturally. I would not want to prejudge Thompson et al. and thus eagerly await their reply.
Hu,
I have a technical question, which perhaps can be easily answered, or perhaps not. I don’t see in the article or here that you actually did a regression on all 7 proxies at once. I admit that it would be quite a coincidence for A) the average of the two subgroupings to equal the result in the PNAS article; B) neither of the subgroupings could produce their supposed averages and yet C) the seven together being able to produce the final result. But is it impossible mathematically? If not you might want to do the calculations and give the results. If it is impossible a reference or quick proof might be in order.
My thinking is that it could easily be the case that the NH series zig where a SH series zag, and this reduces the numbers for the final result without giving the intermediate values which just happen to produce the final results as an average. The odds of this is infinitesimal I suppose, but I’d think such a thing could be constructed from a given data set. If I were going to do it, I’d try some sort of Monte Carlo method or a genetic algorithm. (Not that I have the skills to do so or I’d have done it and given you the results.)
Jeff Id
I don’t want to gild the lily on this issue, but the issue is how you get the “Tropical Composite” Z-score series (TCZ) from the ice core isotope ratio series; and while I accept that there are statistical issues there, there may also be issues relating to the data series. So the issue is not just about statistics. I made the general point that an Economics journal may not provide the best peer-review for an entirely distinct subject (i.e. climatology),and I do not think that is unreasonable.
that seems quite strong commentary. It has been demonstrated that in surveys of the medical literature, statistical analysis is poor/ wrong at rather a high prevalence. For my part, I would guess that is mainly due to ignorance, or trivial error, rather than a standard practice of abuse, with its connotations of deliberate fraud.
yours
per
Re: per (#59),
But what conclusion do you draw, either in medicine or climatology when such statistical issues are brought up but the abuses continue years down the road?
Re: per (#59),
I didn’t make mention of fraud, especially in this case. Only the very loose statistics used as standard practice and regularly espoused in climatology. For instance verification that a squiggle is temperature for a thousand years simply by correlation to highly corrected temperature data in a 100 year period.
last night I had dinner with a physician friend who is the long time chief of opthamology at the National Institutes of Health. He has published numerous papers and is considered an icon in his field. He speaks to Doctors all over the world. This is a guy who does the NYT crossword in ten minutes. He is also an accompished statistician. I asked him about his policies on archiving, data and code release. He said that is an absolute priority with him and that he releases everything. I explained what is happening in certain sectors of the field of climate science regarding information sharing and he was amazed.
Re RW, #25,
I stand corrected. Gore does not actually mention Mann or the HS by name in the film, but only in the book (which I included in my statement, but which you omitted from your quote). See John A #14, #22 for the book text and movie transcript. The film merely misattributes Mann’s HS graph to his friend and scientific advisor Thompson, and and then uses it to refute the claims of unnamed skeptics that there may have been a MWP.
Speaking of corrections, can you find a linear combination of the ice core data that gives HCZ or ACZ? My decadal data is on my webpage at http://www.econ.ohio-state.edu/jhm/AGW/Thompson/, along with a link to Thompson’s PNAS data.
For some reason the spacing in my TXT file gets messed up a little after missing observations, but it is obvious how to correct this. I’ll respost it on Monday. (I think it may contain tab marks where I should have used hard spaces. How it looks then depends on the tab settings on the machine that reads it.)
It is curious that Thompson’s PNAS data files, linked on my page, do not download currently. Perhaps they are being modified as we write. Who says no one reads EE?
RE Dave Dardinger #57,
Actually I tried that first, with no luck. But then when I realized that TCZ was just the average of HCZ and ACZ, I dropped that regression, since a single bad ice core series would mess up the 7-core regression, but would leave the good regional regression intact. The regional regressions also allow shorter sub-periods to be studied, since fewer clean observations are then required to obtain an exact fit (or near-exact fit, given the presence of +/- .01 rounding error in the data).
Although neither regional series is reconstructable, the results do show that the problems are worse in the Himalayan data than the Andean data.
[snip — gratuitous accusation. HM]
RE per #55,
Steve already tried that and got blown off — see the next-to-last paragraph in my post — so tougher measures are called for. In any event, Thompson has posted data, which is although incomplete is adequate to show that his results are not replicable. The PNAS data policy does not require that published results actually be replicable, but only that authors post enough data to determine whether or not they are replicable. Then, if no one catches any problem within 3 months, the article’s conclusions are home free.
True, but any references to articles in it that appear in ISI indexed articles will be counted in the ISI citation index. Many of my own ISI citations have been to unpublished working papers.
Before the recent expansion of the ISI journal list, many good journals were not indexed. Today, most good journals are indexed, so it is unfortunate that EE is not included. But the usual measure of journal impact is not whether it is in ISI, but how often its articles are cited in ISI. This does create a bias in favor of ISI journals, since journal articles tend to cite other articles in the same journal. Ideally “self-cites” (to articles in the same journal) would be omitted for this purpose, as they often are for individual citations, but I don’t think anyone has ever bothered doing this.
hu
I encourage you to address this issue directly with PNAS. I was aware of Steve’s prior history, and I think it will make a difference if multiple independent academics make complaints because a paper does not provide the data or methods to enable replication. In this case, there is not enough data or methods to replicate the final results from the published data, and I think that this is an important issue.
Steve’s analysis is salient; unless you make the attempt to go through due process with the journal, you cannot complain that the journal is not behaving fairly. You have not tested how they would address a complaint about an article in the journal.
I also note that the current NAS panel on data availability may be of direct relevance. A set of comments from the PNAS editor (in respect of a complaint on data availability) could then be measured up against whatever are the findings from the NAS panel; and that might be of interest.
per
Lucy Skywalker (#42) Schopenhauer’s Thirty – Eight Ways to Win an Argument is always worth a read. Number 38 seems to be popular.
I like the association of peer review and publication with the Maginot Line. “Peer review” has become a mantra. Yet the more it is invoked, the less power it contains. It is fast becoming a pejorative and may eventually be seen as having been the last refuge of scoundrels.
Facts are stubborn things. They are no less stubborn by dint of where they are found. In the end, truth will not depend upon whether it is accepted by certain academics with certain resumes. Because of web sites like this, Hu’s work now has an audience of thousands. Many among those thousands are as educated and as knowledgeable as the guards of the academic fortresses which compose that Maginot Line. Truth is sweeping around and through those guards and Paris looming is on the horizon.
And to mix wars, how are they going to keep us on the farm (i.e. ignorant) when we’ve seen Paris?
Can anybody tell me if there is any time in history we know of that one region (i.e. northern europe) experienced much higher temperatures while the rest of the world did not change similarly for hundreds of years (i.e. the MWP)? It seems to me that the theory that the undisputed much higher temperatures in northern europe as proven by both historical human records as well as other proxies could possibly have existed for literally 100 years or more while the rest of the world didn’t experience any changes is very bizarre. How could one region of the world experience such disparate conditions for so long without other parts of the world reacting similarly or experiencing something similar? Maybe this is normal.
Re: john mathon (#71), Currently, we experience below average sea ice extent at the North Pole and above average at the South Pole. See Cryosphere. The 30 year track record is not long. Nonetheless it appears that the hemispheres are capable of diverging temperature trends.
Re: john mathon (#71),
If 1/3 of the world is higher by X degrees and the rest of the world remains at the same temperature then the global average increase is X/3. In order for the global average to remain unchanged the other 2/3 of the world would have to experience a decrease in temperate of X/6. In other words for the HS to be correct the rest of the world would have to experience proportionally lower temperatures.
John Mathon,
In the case of the historical records (as opposed to scientific temperature reconstruction proxies) the MWP covers a wee bit more than “northern europe.” Glacial extent in Alaska/Pacific Northwest, Greenland/Iceland farming, European wheat-belt extent, Russian steppes, north African crop yields, etc. Monks kept good records in Europe. But most of the rest of the world has only sketchy evidence in any direction.
But what you seem to be really asking for is a true climactic shift. I’d put forth the Sahara Desert’s history for that. (Reading Wikipedia, there’s a citation pointing to global warming for current trends here too.)
The image of the Hockey Stick was mistakenly used instead of the actual Thompson graph. Gore (or his graphics people) used the top graph, not the correct graph on the bottom.
Click to access Thompsonetal-climatic-change-2003.pdf
Gore’s description of the graph is consistent with the paper.
Steve: If you had checked Hu’s link, you would have seen that the association of the Gore hockey stick with the wrong graphic in Thompson’s paper was specfically noted in the thread http://www.climateaudit.org/?p=2335 linked by Hu. This thread showed the same image as the one that you showed here. We have been aware here of the precise provenance of this image for a couple of years.
Re: cce (#73), You need to read the original post. It says essentially the same thing. I believe you are missing the point. The post has to do with trying to reproduce the 2006 paper results.
Re: Nicolas Nierenberg (#74), Re: Nicolas Nierenberg (#74),
Nicolas,
For a thread about reproducing ’06 results, there is an awful lot of talk about what Gore did and did not say. If it is relevent to challenge Gore’s interpretation of Thompson’s “thermometer”, it is relevent to quote what the paper actually said.
Hu:
I enjoyed your post!
It is a somewhat amusing side issue that Thompson is an Ohio State Colleague of yours. Did you ever get the urge to walk over to his department, knock on his door, and ask him directly about what was up with the data?
David
It is interesting that this post has brought unusually large participation from the AGW-orthodoxy side. That is is a good thing. What is disappointing how non-substantive the comments are: Boris with ad hominems on E&E, CCE essentially parroting the original post etc. It appears that those who are commenting have not even read Hu’s paper, let alone provided a cogent, substantive response. It is frustrating that there does not appear to be a single climate site where “A-listers” on both sides feel comfortable debating issues. Skeptics found quickly that Real Climate is an uneven playing field given Gavin’s childish snark and selective editing while Tamino is just an swamp of ad hominem attacks by the proprietor and his loyal followers. Similarly, CA is not particularly friendly to pro-AGW views. While posters are not subject to the personal attacks of RC, Tamino et al, “mainstream” scientists are often (respectfully) swarmed by locals – see Judith Curry interchanges for examples.
Until a site is created that is comfortable to both sides, we are going to see a continuation of this pattern of debating mismatches.
Re: compy (#76),
Any important pro-AGW who wants to debate Steve here could easily do so. Just e-mail Steve and he’d be happy to set up a thread where he could cut and paste the responses to the main post or perhaps shut off comments except when he’s putting the comments of such a scientist on.
What I’ve actually seen are well known people come around and suddenly act like they’d never posted to a blog before (which may be the case) and then take offence at the mildest criticism and take off in a huff.
RE cce #73,
I agree that the mistaken substitution of the HS (top) for Thompson’s 6-core CC03 index (bottom) was probably originally just an innocent mistake by someone in the production room. As both Gore’s official Scientific Advisor on the project, and as the purported author of the AIT graph, Thompson had a double obligation to correct the error, if only with a press release on his Byrd Center website, but unfortunately has failed to do so.
Be that as it may, the interesting question then arises, of how the 6-core CC03 graph was constructed, and what, if anything, it tells us about paleo temperatures. Despite Gore’s claim that Thompson had constructed an ice-core “thermometer”, you will notice (in mirror image) that the bottom graph is not calibrated in the familiar C-, K-, or even F- scale of temperature, but rather in the Z- scale. This is Dr. Thompson’s Z-mometer, and not a thermometer at all.
But the PNAS06 article should have made the CC03 obsolete, since it included a 7th ice core, and went back 2000 years, instead of just 1000 years. Craig Loehle’s 18-proxy reconstruction (see http://www.econ.ohio-state.edu/jhm/AGW/Loehle/) suggests that MWP peaked in the 9th and 10th centuries, so that the CC03 recon may be missing the warmest part of it. Even if Thompson’ ice core data is only representative of the two regions covered, it is odd, if it is a valid temperature proxy, that it does not show the LIA and MWP that are so apparent in Craig’s 18 proxies.
Unfortunately, the EE note that is the subject of this post shows that the even the incomplete PNAS06 data is internally inconsistent. Thompson has shown no inclination to correct or complete that data record, so that no credence can be placed in that article.
The failure of the 2006 article now puts the CC03 article back on the table, despite its only 6 cores and 1000-year range. Steve McIntyre has gleaned relatively complete decadal source data for it. Unlike the PNAS06 article, this data can be used to replicate, at least visually, the untabulated 6-core index.
One interesting thing that comes to light when this is done is that the sharp uptick in the 6-core index is not due to the behavior of the component series themselves, but rather to the fact that two of the 3 Himalayan cores drop out in the last decade, leaving only Dasuopu to represent the group. Since the two regional indices are averaged with equal weights, this makes the effective weight on Dasuopu suddenly rise from 1/6 to 1/2 in the last decade. Since Dasuopu ends quite high (though without a big terminal uptick), this discontinuity in the weights generates the dramatic uptick in the 6-core series as a whole.
In the 2008 redo of Craig’s reconstruction, to which I contributed the standard errors, we encountered a similar problem, as proxies dropped out of the sample toward the end of the 20th century. Rather than report a series with confusing terminal gyrations caused merely by a changing sample, we chose to terminate the reconstruction when the sample dropped to half of the full 18 in 1950. Since the data is all tridecadally smoothed, this makes our last point 1935, which at least is in the instrumental period.
If CC03 had similarly terminated its HCZ and therefore its TCZ when 2 of the 3 Himalayan series ran out, the series would have looked quite different at the end. But that’s a future study.
Re: Hu McCulloch (#79),
This is eloquent and elegant; thanks.
=======================
Thomson…? He sounds like a familiar name….
Is he the Thomson of the Kilimanjaro glaciers collapse (http://earthobservatory.nasa.gov/IOTD/view.php?id=3054), where a picture of Kilimanjaro before and after heavy snowfalls is proof of glacier retreat?
Reanalysis data show that the first photograph was taken just after intense precipitation:
(but, of course, don’t trust reanalysis: http://www.climateaudit.org/?p=5416#more-5416 )
Interestingly, the original chart for the projected disappearance of Kili glaciers has been modified by Nasa, no matter that R^2 was 0.98, but 2015 is just too close, so let’s move the numbers back, do not misinterpret me, I am sure it is only to give more room and protagonism to the imminent vanishing of Kilimanjaro glaciers, which may stay there a bit more that would look convenient ( http://news.bbc.co.uk/2/hi/science/nature/6561527.stm )
Original chart in 2000, check the position of the year 2000 in both insets, showing the linear extrapolation of glacier retreat to their complete vanishment:
source: http://bprc.osu.edu/Icecore/589.pdf
Current NASA page in 2009:
Well, we shouldn’t get fussy just for a few mm up or down, left or right, should we?
I am an alumnus of Ohio State and will write the Provost and the Dean of Thompson’s department to complain of his academic misconduct. His failure to supply the data, the irreproducibility of his results, and his failure to make a more public correction of Gore’s falsehood concerning his research are inexcusable. Thompson is sullying the reputation of a great university.
RE Patagon #82,
Interesting photos. I’ve often wondered why Thompson didn’t include his Kilimanjaro cores in his CC03 and PNAS06 “temperature” indices, since he put so much work into them.
Unlike Bona Churchill, for which Thompson has posted nothing at all, decadal averages of d18O for 4 fairly complete Kilimanjaro cores are posted at
ftp://ftp.ncdc.noaa.gov/pub/data/paleo/icecore/trop/kilimanjaro/kilimanjaro.txt.
As for the captions on the insets, I don’t see that they are inconsistent. In the second, 1950 is 5 ticks from 1900, while 2000 is only 3 ticks from 1950, instead of being centered under the big tick 5 ticks above 1950. This makes it look like the 2000 is simply positioned wrong, and the 2 graphs are showing the same thing. In my graph 2 above, 1600 happens to get suppressed, but sometimes GAUSS takes it into its mind in such a circumstance to locate the very first x-value to the right of where it belongs. The program that drew your graph may have simply had a similar glitch.
However, the last 3 points do show a distinctly smaller slope than the others, so the straight line extrapolation to 2020 doesn’t seem warranted. A straight line through the last 3 points would each 2030, and if some curvature is added, it could reach 0 even later.
BTW, I still can’t get Thompson’s PNAS06 data files, at http://www.pnas.org/content/103/28/10536/suppl/DC1, to load. Is it just my computer acting up, or is there really a problem with the files? They worked fine last year. It would be interesting if they were yanked on Friday, and if so, what replaces them. Fortunately, I at least saved a hard copy of the old PDFs. I’ve sent an inquiry to the PNAS website to see if they inadvertently did something to them.
Re: Hu McCulloch (#84), I have no problem accessing the pnas link you included. There are a set of pdf files there that I was able to open.
Re: Hu McCulloch (#84),
The link works for me.
I downloaded the the three pdfs on Friday at 2:46 pm. As well, I have the data from those files in an Excel file. I can e-mail them to you if you want them.
Re: RomanM (#87),
It’s always worthwhile checking http://www.climateaudit.org/data/ for quirky data formats. I collated the Thompson PNAS pdf data some time ago which is direct readable from the named files in http://data.climateaudit.org/data/thompson/.
Re: Steve McIntyre (#118),
Thanks for the reminder. It’s good to know (and remember) these things, but my first reaction is always to “do it myself”. In this case it was cut and paste a bunch of times.
I did wonder why someone would prefer to use an unfriendly format like a pdf file for passing out data.
Re: RomanM (#119), I wondered the same thing at the time. Either Thompson was placing a petty roadblock to usability or was ignorant of the effect of the decision.
Re: Hu McCulloch (#84),
Picking data off the graph (values are showing so you can replicate easily). Try this
And they call themselves scientists?
#82:
That’s a nice x-axis in the last photo. Is that a log time scale 🙂
Re #84, FWIW, here are decadal plots of Thompson’s 4 principal Kilimanjaro d18O series:
KNIF2 and KNIF3 both run for 150 decades, ending in 1941-50. The end date is based on 14C from a 1952 nuclear test, and the series end then because of evidence of subsquent melting. KSIF2 starts a decade later than these 2 and has 9 missing decades, for a total of 140 decades. KSIF1 starts even later, and has only 128 decades.
The 2 northern cores run a little “cooler” than the 2 southern ones. In order to make them comparable for averaging, KNIF2 and KNIF3 were demeaned by their own 150-decade averages. Then I adjusted KSIF2 to have the same mean over its 140 decades as the average of the first 2. Then KSIF1 was adjusted to have the same mean over its 128 decades as the average of the first 3. These anomalies are shown below:
The average of the 4 anomaly series is shown below:
Even taking into account its earlier ending date, this series doesn’t at all have the HS shape of the TCZ of either PNAS2006 or CC2003.
See also Steve’s comments, “New Kilimanjaro Data” and “More on Kilimanjaro”.
Re: Hu McCulloch (#89),
Can you plot a standard error envelope on that mean curve? Thanks in advance. (Great work, by the way.)
Re: Hu McCulloch (#89),
You mention propagation and representation of errors. I’m a bit rusty, but to use an example from world temperatures and conceding that some are land only and some are land plus sea, it would seem that each reconstruction like GISS and HADCRU or their later versions should not be shown graphically with error bounds around the mean of each. Since the same raw data are used in the reconstruction, surely the error bounds should enclose all such reconstructions. Likewise, when GC model ensembles are created, the error bounds should not be shown around individual model best fits, but should encompass all of the models created, whether rejected as looking implausible or not.
There is a known formalism for the accumulation of errors but I suspect it is not being everywhere followed. Somewhere along the way we are missing items like the reality that mercury thermometer graduations were commonly in whole degrees, or half, and that graduation sets some limits. Also, accumulation of large numbers of obs need not always eliminate systematic bias as we all know.
In your top figure of post #89 my intuition – always a dangerous item – would put error bounds as roughly horizontal lines at -4 and -16 on the Y axis. This would cover all the obs you give with a little slack for the precision at the extremes.
This is what we used to do. Has the math or convention moved on so that I’m being stone age, as my granddaughters claim?
RE bender #90,
Here is a 95% CI for the average d18O anomaly:
Here are the standard errors that were used. Note that the se rises when there are only 3 (or 2) cores active.
I’m assuming here that there is a constant variance v of the individual anomalies about time t’s average anomaly, that is the same for each core. This is justified, since each core is same variable, collected by the same people at the same time, and processed in the same lab. (In Loehle and McCulloch 2008, I instead allowed each proxy to have its own variance about the mean, which is a little messier.) With N(t) cores active at time t, each squared error times N(t)/(N(t)-1) has expectation v, so v-hat = 0.6625 is just the average of these adjusted squared errors. Then se = sqrt(v-hat / N(t)).
There would be additional uncertainty if this average were calibrated to say global temperature, because of the uncertainty of the calibration coefficients and the fact that the calibration regression error should be this large or larger.
UC had a method of getting rid of the hard line at the boundary of the CI, but I can’t get MATLAB’s fill( ) to do this.
Re: Hu McCulloch (#91),
Thanks. Wow: the value at ~AD1080 is high.
Re: Hu McCulloch (#91),
If the Matlab code is short, can you put a copy of it here. I know, the damn public always wants more.
My reason though is in understanding the proper method for calculating CI of a noisy signal. It’s easy to find methods on line but some of the comments I’ve read here lead me to the understanding that doing it right isn’t that trivial. So when I start doing it, I’d like to do it right.
Re: Hu McCulloch (#91),
H=fill(xpoly,ypoly,’y’);
set(H,’EdgeColor’,[1 1 0])
One thing I’ve seen several times is that the ‘error bars’ are essentially only applied to a single axis. The time axis would seem to have a hefty potential for systemic error, noise and calibration issues as well. In particular, the dramatic up and down shifts seem pretty locked into specific years.
Re: Alan S. Blue (#92),
I thought the dating error (x axis) was ~zero with this method?
Hu, this is excellent.
BTW the Kilimanjaro data was first published online at Climate Audit. http://www.climateaudit.org/?p=408 – after a campaign at Science, which was temporarily feeling a little sensitive because of the Korean cloning fraud.
Also prior to my involvement there was NO Tibetan data available. As a reviewer of Mann’s submission to Climatic Change, as I’ve mentioned before, I asked for data. Schneider said that no one had ever asked for data in 28 years of reviewing. I said that I was. He said that that would require an editorial board policy to be established. I said – so what. So they established a policy; Mann refused to provide the requested data and the article never saw the light of day. Under the new policy, I asked for Thompson’s data, resulting the 10-year averages which he condescended to archive – totally inadequate but the absence of which did not appear to bother anyone in the “community”.
RE Jeff Id #96,
Here’s the Matlab — I added a few comments, but let me know if you have questions.
% Kilimanjaro.m
x = dlmread(‘c:\\website\AGW\Thompson\Kilimanjaro\kilimanjarod18O.txt’);
% Contains Fig. 3 data from
% ftp://ftp.ncdc.noaa.gov/pub/data/paleo/icecore/trop/
% kilimanjaro/kilimanjaro.txt,
% with NaN for missing data inserted using Excel.
size(x)
age = x(:,1); % Top age bp 1950 in kyr.
s1 = x(:,2); % KSIF1 d18O 0/00 s for South
s2 = x(:,3); % KSIF2
n2 = x(:,4); % KNIF2 n for North
n3 = x(:,5); % KNIF3
furt = x(:,6); % Furtwangler
disp([‘size (furtwangler)’ num2str(size(find(1-isnan(furt))),1)])
% 25 decades — ignore Furtwangler.
figure
plot(age,[s1 s2 n2 n3 furt])
title (‘5 Kilimanjaro cores’)
xlabel (‘Age bp 1950, kyr’)
grid on
yr = 1941 – 1000*age;
figure
plot(yr,[s1 s2 n2 n3])
title (‘4 Kilimanjaro ice core d18O values’)
xlabel (‘Bottom year, AD (1941 = bottom of first decade etc)’)
ylabel (‘d18O (o/oo)’)
legend (‘KSIF1’, ‘KSIF2’, ‘KNIF2’, ‘KNIF3’)
grid on
n23 = (n2+n3)/2;
n23 = n23 -mean(n23);
figure
plot(yr,n23)
title (‘2 north cores, demeaned’);
grid on
s2ind = find(1-isnan(s2));
disp([‘size(s2ind) ‘ num2str(size(s2ind))])
s2mean = mean(s2(s2ind));
n23s2mean = mean(n23(s2ind));
s2 = s2+n23s2mean-s2mean;
n23s2 = n23;
n23s2(s2ind) = (2*n23(s2ind) + s2(s2ind))/3;
figure
plot(yr, [n23 s2 n23s2])
title (‘n23 s2 n23s2’)
grid on
s1ind = find(1-isnan(s1));
disp([‘size(s1ind) ‘ num2str(size(s1ind))])
s1mean = mean(s1(s1ind));
n23s2s1mean = mean(n23s2(s1ind));
s1 = s1+n23s2s1mean-s1mean;
n23s12 = n23s2;
n23s12(s1ind) = (3*n23s2(s1ind) + s1(s1ind))/4;
figure
plot(yr, [n23s2 s1 n23s12])
title (‘n23s2 s1 n23s12’)
grid on
figure
n2 = n2-mean(n2);
n3 = n3-mean(n3);
plot(yr,[n2 n3 s2 s1 n23s12])
title (‘n2 n3 s2 s1 n23s12’);
grid on
figure
plot(yr,[s1 s2 n2 n3])
title (‘4 Kilimanjaro ice core d18O anomalies’)
xlabel (‘Bottom year, AD (1941 = bottom of first decade etc)’)
ylabel (‘d18O anomaly (o/oo)’)
legend (‘KSIF1’, ‘KSIF2’, ‘KNIF2’, ‘KNIF3’)
grid on
figure
plot(yr,n23s12)
title (‘Kilimanjaro average d18O anomaly (4 ice cores)’);
xlabel (‘Bottom year, AD (1941 = bottom of first decade etc)’);
ylabel (‘d18O anomaly (o/oo)’)
grid on
nt = 1-isnan([s1 s2 n2 n3]);
nt = sum(nt’)’;
nnt = nt./(nt-1);
figure
plot(yr,nt)
title (‘N(t)’)
grid on
es1 = (s1-n23s12).^2 .*nnt;
es2 = (s2-n23s12).^2 .*nnt;
en2 = (n2-n23s12).^2 .*nnt;
en3 = (n3-n23s12).^2 .*nnt;
e = [es1; es2; en2; en3];
disp(‘size(e)’)
size(e)
e = e(find(1-isnan(e)));
size(e)
v = sum(e)/length(e)
se = sqrt(v./nt);
figure
plot(yr,se)
title (‘se’)
ylim([0 .6])
xlabel (‘Bottom year, AD (1941 = bottom of first decade etc)’);
ylabel (‘d18O anomaly (o/oo)’)
grid on
figure
xpoly = [yr; flipud(yr)];
ypoly = [n23s12+2*se; flipud(n23s12-2*se)];
fill(xpoly,ypoly,’y’);
hold
plot(yr,n23s12,’linewidth’,2)
title (‘Kilimanjaro average d18O anomaly (4 ice cores), 95% CI’);
xlabel (‘Bottom year, AD (1941 = bottom of first decade etc)’);
ylabel (‘d18O anomaly (o/oo)’)
ylim([-3 3])
grid on
% end
RE Alan Blue, #92:
In fact, the time-axis is very sketchy, though I just ignored this source of uncertainty above. 1325 AD was assigned to the second youngest downspike in KNIF3, on the assumption that this must have been the Wolf solar minimum, and then the other series were synchronized to this by wiggle-matching. So it is no accident that all four have downspikes at exactly that time. Apparently Thompson somehow didn’t get the word that solar activity has no important effect on climate.
The Wolf minimum (1280-1340 according to a NASA page discussing a 12/01 Science article by Shindell, Schmidt, Mann and others) must have been dated by inferring atmospheric 14C from treerings in the process of dendrocalibration, since no one was counting sunspots back then. But then this 14C record becomes a temperature proxy in its own right. (Perhaps not the end-all proxy, but at least one of several proxies of varying noisiness.) Why doesn’t anyone explicitly use it?
(Actually 14C was used in an article discussed here last year as if it were temperature to calibrate a long speleothem record to temperature. I’ll post a note on it when I dig up the reference.)
bender, it’s not my field. But in physical chemistry I was requested to determine and display t-errors that were essentially under direct observation. (In my case, it was almost ‘binned’ like the current ‘daily high’ temperature measurements of a surface station.)
I could see very high precision and accuracy near calibration points if you’re pinning the t-axis to specific things (like 1325AD as Hu mentions). But I was just requesting more information. The dips and peaks visually appear exceedingly well-defined.
Hu, thanks. Please don’t knock yourself out on my quixotic question. You’ve already given the answer I was half expecting.
RE #101,
Thanks, UC! This is much nicer, since it doesn’t draw attention to the edges of the CI:
Although d18O seems to indicate temperature, my limited understanding is that it unfortunately indicates temperature at the time of the snowfall, which time may vary from year to year. Thus a fluctuation in d18O might just mean a change in the season of maximum snowfall, and not a change in average temperature. For this reason the relation between d18O and annual temperature often varies from site to site, and may even be absent. This makes data like Thompson’s Andean and Himalayan cores trickier to interpret, since if you just aggregate them into a single regional or global index before calibration (as he appears to do with the CC03 data), you may be losing useful information.
In the case of the 4 Kilimanjaro cores, however, all 4 are at virtually the same coordinates, and so have the same seasonal weather patterns. This makes it reasonable to aggregate their d18O values into a single average as above before attempting calibration.
Any such temperature calibration point estimate would just be scaled version of the d18O anomaly. It should have at least as much uncertainty (after scaling) as the averaging error I have plotted, since the calibration regression errors should be at least as large as the averaging errors. Therefore my CI is just a lower bound on what the properly computed temperature uncertainty would look like.
Thompson’s Kilimanjaro article, with most of the same co-authors as PNAS06 and CC03, was in Science 18 Oct. 2002, vol. 298, pp. 589-93, plus online SI.
Re: Hu McCulloch (#102), The extremely sharp drop, followed by recovery, at 1720-1780 is remarkable. Especially given the tightness of the confidence intervalls, I have to ask: WUWT? Surely climate in the neighborhood of this proxy did not shift that drastically?
Re: bender (#103),
Sharp change?
This is on a volcano.
“While it is inactive, Kilimanjaro has fumaroles that emit gas in the crater on the main summit of Kibo. Scientists concluded in 2003 that molten magma is just 400 metres (1,310 ft) below the summit crater. Several collapses and landslides have occurred on Kibo in the past, one creating the area known as the Western Breach.” — wikipedia
http://en.wikipedia.org/wiki/List_of_volcanoes_in_Tanzania
Kieyo last erupted 1800
Meru 1910
Maybe there are others and other things.
Re Bender #103,
My guess would be that this is the 1815 Tambora eruption, which caused the “year with no summer” in 1816, coupled with timing uncertainties in the ice core record.
As I indicated above, KNIF3 was calibrated using (36Cl) nuclear fallout dating fairly certainly to 1952, plus the assumption that one of the wiggles was the Wolf solar minimum, which they place at 1325, plus a date of 11.7Kyr for the bottom, and then using a constant-accumulation-plus-flow model to intepolate the rest. KNIF3 then shows a sharp 1-decade downblip that interpolates to 1771-1780, but this could easily be Tambora if the rate of snowfall wasn’t really constant.
Then, the other series are dated by matching 9 of their wiggles to similar wiggles in KNIF3. For some reason they align only the end of this “Event 1” with 1771-1780, even though the event is several decades long in the other series. Since all series are then at local record lows at or before 1771-1780, the average is dramatically low then as well.
I would think that matching dust layers from volcanic eruptions would be more reliable, but it’s their data, so who am I to argue?
(In #89, I erroneously indicated that 14C was the signature of the 1952 nuclear test that was used to date the near-top of the core. In fact, it was 36Cl.)
Re: Hu McCulloch (#104),
I retract my question whether there are dating errors in the x direction. Clearly there are. And they would presumably increase as you move back in time and away from reliable anchor years. So Alan Blue #92 has a very good point.
RE Tim Channon, #106.
Good point — The inset graph in Fig. 1 of Thompson’s Kilimanjaro article and posted by Patagon above (#82) would have the ice field area be linear in time. This would force the rate at which the field’s linear dimensions shrink to approach infinity as the field disappears.
A more reasonable model would be that the linear dimensions are linear in time, which would correspond to using Area^.5 in your model. You use Area^.4, and have the ice lasting until around 2100. A power of 0.5 wouldn’t be much worse in fit, but would pull the disappearance back a decade or so, I would think. Have you tried that?
It looks like an exponential model for area might fit fairly well also. The linear dimensions would then also be exponential, but with half the rate of decay. The ice would then never quite completely disappear.
Re: Hu McCulloch (#108),
sqrt() does pull it back (2075) but with so few data points somewhat poorly placed it’s all rather loose. Intially that’s what I tried. I think my gripe is that pushing a straight line through those points is obviously wrong.
Reality is that various processing are going on, a few casual looks over many years is not going to reveal much. IIRC the cause is loss of precipitation from local enviromental change, a sublime solution.
Re: Hu McCulloch (#107),
I’m not sure that that is the case. Bear in mind that we actually live in a 3d world and that the snowfields are on the rounded top of a mountain. If we want to avoid actually discussing how a random snowfield would melt from a physical basis (which would be the best thing to do), we might instead say that the melt would be related to the ^.33 of some thing else. Or that the exponent to be used would be between .33 and .5, in which case Tim’s .4 may be reasonable.
I’m back online.
There are some very interesting statistical issues on the dating of glaciers. Glacier layers thin exponentially and any error in estimating the thinning factor leads to explosive dating errors in the early portions. Plus some of Thompson’s dating methods would be laughed out of an undergraduate archaeology course (which also spends a lot of time trying to date layers).
Oddly enough, a comment about Kilimanjaro dating was one of the few of my IPCC review comments that IPCC paid any heed to. The IPCC First Draft draft said of Kilimanjaro:
Although there were presumably many stadiums of “community” reviewers, none saw fit to comment on this. I observed that Thompson’s dating was “precarious”. The lead author of this section sort of conceded the point (and the sentence was dropped from future drafts.)
Although the IPCC lead author says that he “knows this point concerning the dating of Kili”, the only place that it had been “published” was at Climate Audit. No one in the “community” has placed their concerns in the PRL.
Hu raised the Gore aspect citing an earlier thread in which the materials for this topic were originally provided. Let’s discuss the Gore aspect at that thread: http://www.climateaudit.org/?p=2335 and discuss the replication of Thompson’s results on this thread.
News — Lonnie Thompson’s wife and frequent co-author Ellen Mosley-Thompson has just been named to the National Academy of Sciences: http://researchnews.osu.edu/archive/ellennas.htm.
I think this entitles her to an invited inaugural article in PNAS, with only perfunctory review. Thompson et al 2006, which she co-authored, was the inaugural article for Lonnie Thompson’s membership.
The fact that Thompson sponsored Michael Mann’s 2008 PNAS paper suggests to me that Mann is also being groomed for a spot on the NAS. Perhaps NAS will eventually reverse its tedious objection to stripbark bristle cone pines as temperature indicators!
RE RW #12, 19, 25, John A #14, 22, 28, HM #63, cce #110, I have corrected the original post to make it clear that the book says a little more than the film.
Per Steve #111, please direct further discussion of AIT to https://climateaudit.org/?p=2335.
It was obvious to me that Hu made the Gore reference simply as an introductory interest for the much more important revelation of his findings on the Thompson proxies. It is always unfortunate that these unimportant side issues take up bandwidth.
The uptick in the Thompson proxy for more recent times almost looks like a splicing of instrumental measurements on the end of the proxy similar to what Mann et al did in the most famous of HS graphs, that is spliiced it on for better viewing of the perspective, but not really by splicing it on. But then again Thompson uses a zometer, and not a thermometer plot.
Back to the PNAS three-month policy: It seems to me the problem with PNAS here is that they assume that everything needed to challenge a publication is available at the time of publication. Not always the case. Therefore, they should amend their policy along the lines of: If a potential challenger finds that relevant data/methods/code are not in fact archived, the editor shall inform the author(s) of this situation and begin the three-month dating window from the date on which the requested information is supplied. If such information is not itself fully supplied within a three-month time frame by the author(s), the original paper will be formally withdrawn by the journal.
Whaddaya think?
Re my #63, 84, Nicolas Nierenberg #86, RomanM #87,
The problem reading the PNAS files at http://www.pnas.org/content/103/28/10536/suppl/DC1 appears to be in my browser, since if I simply right click on the links, save the files to my computer, and then open them directly from my computer they work fine. So false alarm about the files being hastily yanked for revision.
I e-mailed the PNAS tech people to ask if the files were OK, and they were very prompt and helpful about getting back to me, attaching copies of the files to their email to make sure I had them in good order.
Note that these and other PDF tables can be read electronically by clicking on the “select” button (instead of the default “hand” button), and then selecting, copying, and pasting the table into Notepad or Excel. Last year I unnecessarily copied by hand the series that Steve hadn’t already archived at CA.
As for my own .TXT Supplementary Data File at http://www.econ.ohio-state.edu/jhm/AGW/Thompson/, it is in good order as a tab-delimited file. Some programs make it look mis-aligned, but that is an issue with the program, not the file itself, so I have left it as is.
More questions, then, about the PNAS “three-month rule” – how long has this policy been in place, and has PNAS ever allowed comments on any other article after three months has passed?
It would weaken their case if they had allowed “out-of-date” comments before.
RE Roman, 119:
and Steve 120:
That’s what I thought last year when I first used this data. But as noted in #117 above, I have since learned that Adobe Reader has a “Select” option for the pointer that allows you to select text from a PDF and copy it to the clipboard. From there it can be copied say into Notepad or Excel and cleaned up for use without having to punch the numbers in. This wouldn’t work with scanned PDFs, but seems to work OK with converted ones.
I can’t get the Select pointer option to select more than 1 screenful at a time, but with these data sets, at least, it is easy to use Edit/Select All, copy, paste, and then just delete what you don’t want. You do have to manually insert NaN codes, but there aren’t many of them.
This insight has enabled me to do some further calculations. More soon.
Re: Hu McCulloch (#122),
I have been using Adobe Acrobat Professional 8 and there are more options available for copying and exporting the data as text and/or tables. It can even be passed directly into Excel in table form.
For scanned pdfs, there is an option to “Recognize Text Using OCR” which I have used to extract passages from such documents and could be used with a little work to extract data as well.
The problem with all of this is still the unnecessary waste of effort to do something which becomes trivial if the data is posted in a suitable format in the first place.
Re: Hu McCulloch (#122),
For what it’s worth a few observations on the use of PDF files.
They are becoming a little ubiquitous partly because PDFs are seen as an easy way to get controlled output format for display across multiple platforms – PC/MAC/LINUX/UNIX – using a free reader tool. It also means that format should be consistent and variable fonts (original font used is not always available on the reader’s machine) can be dealt with by embedding if so chosen so that display and therefore readability is more reliable. (Note, this is not so true if the text is part of a scanned document. In such cases an OCR tool will be required in an attempt to extricate the text. Accuracy can be variable – so not always good with numbers and so on.) PDFs can also be secured with a password and made non-editable.
There are a number of products on the market that allow text to be extracted as a txt file (including the later versions of the Adobe PDF reader) and so could export all pages in one pass rather than cut and paste a page at a time.
Beyond that there is at least one product which allows users to map the format of the text and extract directly to a data table then export to your format of choice. It works well, however the PDF writing engines can be inconsistent and sometimes require some experimentation to get right. In addition the original input format for the reports can be inconsistent – as it the case with one of the sample files I pulled down from PNAS – meaning that one page of 4 was not in a consistent format. On the other hand the alternative format required for successful extraction and export to a single file for all page’s data would take only a minute or so and avoid any possibility of data entry/edit error.
It is a commercial product so whether the licence cost can be justified would depend on the amount of time and effort required to process the reports and filings by other methods. Also how often PDFs are used for archiving data.
On the other hand anyone who may already use the software for other purposes would be in a good position to work with the files for just the cost of their time.
I don’t want to appear to be be advertising so I will refrain from providing names and links but will do so privately if asked.
I hope the content of this post proves to be of some interest – at least in the context of easier data handling.
Re: GP (#131),
The post discusses the issues and some tool support for extracting text from PDF files. The IETF, which writes the standards for the Internet, faces the same problems with its documents. It solves it by requiring that all documents be prepared as text files.
No one needs a special tool to read an Internet standard. 25, 50 or 10 years from now, IETF standards and other documents will still be readable
Re: TAG (#132),
Whilst I have empathy with that observation there is a difference between a text file that can be read but may not always and in perpetuity retain embedded formatting and something that sets out to establish a document that will not re-present differently on different systems when using different fonts. I don’t see such corporate complexity as a positive benefit but it is something that seems to be gaining ubiquity and likely ever more so as the future arrives.
Knowing that there will likely be such challenges to address from time to time an awareness of possibility of fast and accurate tools to help extract the information in a usable form seems sensible. Any text based output form and some other specials, not just PDFs, can be addressed by the software without the need to write any code.
It’s not so much a question of being able to read a file bit more about being able to make some use of it, especailly if it contains identifiable data fields or columnar or tabulated information, as quickly as possible with least effort.
We should all have standards and I find here are many standards around to satisfy our individual needs. I guess some would call it diversity.
Re: GP (#133),
Adobe, the .pdf people, to their credit, were an early entrant in the field of home and small print shop graphics with Photo Shop and Illustrator and a string of others. Early print shops became accustomed to using them almost solely and Adobe calls itself the “industry standard” in graphics, although there are other products like Corel that I prefer. This is because one can do the same job with a program from a single box, instead of having about 6 boxes that need updating from time to time.
The Adobe .pdf seems to be going through a similar marketing exercise, though it is just a minnnow in a large sea of possibilities. I would not be surprised to see the .pdf become linked to a need to have other expensive support programs, so that marketing tactics outweigh the value of the product and its quality. Sure the .pdf reader is free, but look at the cost of the pro reader/writer.
So I don’t see it so much as evolution, but survival of the fittest. The .pdf system still has glitches as noted above, so maybe it will not survive. Its main present assest seems to be compatibility with other Adobe products that users have become weaned to.
I’d favour a custom designed industry standard for the format and transfer of numerical data. Too many times I have had tables that look fine on submission and end up misaligned when presented on the Net.
Re: Geoff Sherrington (#134),
Geoff,
You are right but Adobe have been attempting (thought the free PDF reader) to influence the market for some time. I think it is a sort of loss leader for their overall ‘do everything to do with electronic documentation using Adobe products’ strategy – a fair commercial freedom they would like to exploit.
PDFs are becoming quite ubiquitous in the world of business software. There is no point in having a programmer of a few hundred write endless versions of reports formatted for printing by any number of variant printer drivers when it is simpler and quicker to use a more portable option – such as a PDF. Many current systems assume that the users will be using PDFs internally anyway – for both improved ‘look’ (so much more important the content … 😦 ) and security. To this extent Adobe cleverly made the reader free and portable across platforms and offer plugins for browsers. They also permit others to develop their own PDF writers for the ‘standard’, some of which are free. Whilst the original intent was driven by the need for consistnet graphics display the spread of the concept into corporate acceptance has started to engulf all aspects of ‘printed output’. We seem to pass that tipping point a handful of years ago.
Microsoft have finally joined the party (so it must be serious!) with their XPS concept – which is basically a similar idea for introducing standards and interoperability between applications in a web oriented way.
Application developers will sign up as it takes a large part of their non-productive tasks away from them, provides easier solutions to variable demands from different clients and gives them some influence and control over developments in their own market thus helping them to retain controls in a commercial sense.
Against this background we might well expect the rule of ‘text only’ to be threatened. partly because the other options will tend towards a ubiquity that could be accepted generally as being the equivalent of ‘text only’ but with added potential for not screwing formatted output form time to time. Thus being aware of tools and application that can make a useful readable format doubly useful by turning it into a direct source of data with as little effort as possible makes some sense – potentially even less than cut and paste if you consider the potential for poor initial formatting and errors during pasting and correction.
I don’t really see it either a positive or negative shift in standards but it is something that will happen one way or another even if, for example, it is used just as am attempted obstacle to easy data sharing. An extra step along the path as it were. With the right tools that obstacle could sometimes prove to be a benefit.
There are negatives of course. I sampled one of the PNAS pdf files and it provided nine columns of data – 3 fields for each record so three columns contiang 3 sub-columns.
For 3 pages. The 4th page has too little data for 3 master columns and so has on ly 2 column (of 3 fields each column) and all formatting is adjusted across the page to ‘suit’. Such are the joys of using desktop publishing concepts to present raw data files. It is easy enough to deal with but would have been better presented consistently in the first place. Such are the ways of standards.
My recent PDF-epiphany (see #122) has enabled me to easily do some additional calculations that I didn’t try before because of the difficulty of manually transcribing all the data in Thompson’s Data Set 2 and Data Set 3.
It turns out that the root of the problem is that the decadal average Z-scores shown in Thompson’s Figure 6 and my Figure 1 above, and tabulated back to year 0 in Data Set 3, are not the decadal averages of the 5-year average Z-scores shown back to 1600 in Thompson’s Figure 5 and in his Data Set 2:
Evidently different data was used for Figure 6 (which Thompson compares approvingly to the MBH99 HS) than for Figure 5, even though the article and SI give no indication that this was the case.
The problem is not isolated to the data for just one region, since the two regional indices have the same problem:
It turns out that the Data Set 2 composite scores really can be constructed as linear combinations of the Data Set 2 core data, with all coefficients for the appropriate regions highly significant as if from an exact fit to within rounding error. The included coefficients are similar but unequal, as if z-scores were computed from the d18O data and then averaged for each region.
However, the problem cannot just be that Figure 6 was computed from the same data but using standard errors for the 2000-year period instead of the 400-year period of Figure 5, since then there would still be an exact (though different) linear relation between the Figure 6 composites and decadal averages of the Figure 5 core data. As I show in my EE paper, no such linear relation exists.
So the problem still persists — which is the right data to use to construct an ice core temperature proxy? The data of Figure 5 (which at least is identified by core number in DS2), or the (unspecified) data of Figure 6?
Since Figure 5 is not representative of the data that was used to construct Figure 6, Thompson has failed to provide, as required by the PNAS data policy, sufficient data to replicate his results. At a minimum he should identify the archived cores that were used to construct Figure 6, and provide detailed data for any unarchived cores that were used.
Re: Hu McCulloch (#124), “Since Figure 5 is not representative of the data that was used to construct Figure 6, Thompson has failed to provide, as required by the PNAS data policy, sufficient data to replicate his results.”
Great work Hu. We see this trait over, and yet over again in proxy climatology. Steve M., and others but especially Steve, has posted many times on this M.O. of team members and their fellow-travelers. Some worker publishes a paper but fails to mention that critical results were processed differently than the general specified method. The unspecified method is obscured by misleading but true textual equivocations.
The obfuscation is revealed only by a detailed and searching analysis that must attempt the reconstruction of all the results. Because of the textual obscurantism, it is found difficult and time-consuming to reconstruct the analytical method. During this effort, it is discovered that the original author has also not adequately described even the data going into the critical figures, on which the unspecified method was used.
The searching reconstruction takes time, often weeks to months. Often, only the difficulties in reproducing one result lead to the discovery of other important data or methodological lacunae.
Following a query, the original author declines to identify the method or the data, or else claims to have lost or deleted that particular data set (“the dog ate my data” defense).
Finally, the journal of record finds a reason to decline any rectification of the problem, either by way of a time limit or by way of some technicality. In Nature and PNAS we have seen the latter, wherein a specious corrigendum is filed that does not actually address the central problem. The principals then go home having satisfied the letter of the law. No one not directly familiar with the dispute ever learns that the published work is wrong, and the momentum of alarm is unchecked.
This scientific foulness has been exposed many times here on CA. To me, as a working experimental scientist, team practice is a horror to behold. The widespread [snip] in climate science can only be explained as some sort of zeitgeist, in which common behavioral practices stem from a common culture. In this case, it’s a culture of hubris. They know they’re right. So, [snip] in practice ‘doesn’t matter.’
Re: Pat Frank (#126), “The widespread [snip] in climate science can only be explained as some sort of zeitgeist, in which common behavioral practices stem from a common culture. In this case, it’s a culture of hubris. They know they’re right. So, [snip] in practice ‘doesn’t matter.’
.
How many instances must you record, Steve, before a spade is correctly so-called?
Thanks for the code Hu, it was informative and clear.
On an unrelated topic. Ryan O was able to replicate Steig’s verification methods.
He did a great post one of the best tAV has carried and I don’t know a good spot to call peoples attention to it so I understand if you snip it.
RE 126:
Pat Frank:
May 1st, 2009 at 11:17 am
[snip]
A WUWT reader (DASH RIPROCK III) posted a link to a lecture, he/she had attended earlier this week, given by Lord Monckton of Brenchley in which he describes clear and compelling examples of the practises you allude to.
If you haven’t seen the Viscount in full flow before then, IMHO, this video is a must-see for you!
Warning, as it takes a good hour and a half, make sure you’ve got the nice comfy chair, snacks galore and a generous glass of your favourite tipple to hand, first!
Here’s the link. Enjoy!
http://yct.tamu.edu/
Re royFOMR #127,
You’re getting really OT here, but since it’s my thread, instead of snipping you, I’ll just observe that of all the plenary speakers on the website of the recent Heartland conference, I found Lord Monkton of Benchley to be the most disappointing. IMHO he’s a poor imitation, in terms of aristocratic mannerisms, of the late Wm. F. Buckley (with whom I often agreed).
Please defer further discussion of Viscount Monkton’s talk to Unthreaded.
I’m looking forward to a talk at OSU by Fred Singer next Friday.
RE #127, 129, see #670 on Unthreaded.
h/t Tom Nelson:
http://scientific-misconduct.blogspot.com/2009/05/allegations-of-fraud-at-albany-wang.html
Re: Raven (#138), Doesn’t sound ideal but from quick skim it looks as if the conclusions of the 1990 papers were to caution against UHI effects and put some tentative numbers on the effect. Maybe after nearly 20years since the work was done there are issues with the archiving and audit trails the authors used? More to support the demands for proper standards of archive and transparency req. for publication?
Re: curious (#140)
What I thought was interesting is the author has picked up on one of the main themes of this blog:
Re: Raven (#141), Agreed – and I’d add transparency of the investigation processes of self policing bodies!
Re 135
The altitude effect has indeed been discussed, at least for the Greenland ice-cores. These are all from near the ice-divide so ice movement is not much of a problem, but the thickness of the ice-cap will of course influence the altitude of the ice-divide and hence the temperature. If the ice is thicker the temperatures will be “too cold” because the ice surface is at higher altitude and vice versa.
Furthermore the relation between the thickness and size of an icecap is not always simple. An icecap that reaches the sea and loses mass by calving is relatively flat. As the icecap recedes the edges may instead be on land and the ice lose mass by melting in place, which is a much slower process. This will result in a smaller but steeper cap, which may even be higher than the earlier larger icecap.
In Greenland there has been efforts to correct for this effect by studying an ice-core from the small isolated Renland icecap on the East Coast. This is situated on a small flat plateau with steep sides at about 2000 meters altitude. It can never have varied much in altitude, since if it grows much thicker it will “run over” the edges of the plateau. The only effect that needs to be corrected for is the isostatic effects of the waxing and waning of the main icecap, which can be determined fairly well from the old raised shorelines at nearby Scoresby Sound.
The results of this exercise is among other things that during the last interglacial (when the ice-cap is known to have been smaller) the southern parts of the Greenland icecap were apparently a few hundred meters thinner, while the northern part was actually slightly thicker than at present, probably because the ice did not reach the coast as much as now.
Correcting for similar effects on temperate mountain glaciers must be rather difficult. I would suggest using ice from corrie glaciers where the accumulation altitude cannot have changed much in the nature of things. In areas which have been heavily glaciated in the past, like Alaska, southern New Zealand or Patagonia, you would also need to correct for isostatic effects in long cores. However for the last millennium or two this would be negligible, compared to other sources of error.
This is off the specific topic and may get snipped, but I think it’s important to note :
Steven Chu also uses what appears to be a Hockey Stick in “The Energy Problem”.
It’s on page 7 of the pdf.
ClimateAudit was probably aware of this already though.
[Thanks — Indeed Steve has already started a thread on this topic, “Spot the Hockey Stick, #n”. Evidently the HS itself is alive and well. Please discuss over there.]
Why are you comparing the graphs showing the z-scores of isotopic oxygen in Thompson’s article with isotopic oxygen in your reconstructed graphs? My stats are a little foggy, but that doesn’t seem a proper comparison.
RE D.Prest, #146
Thompson prefers to combine d18O records from different sites into a single index by first converting each series to z-scores.
I don’t see the point of this either, since any physical meaning of the scale of the series is lost when you scale by standard deviation, which is extraneous to whatever response there is of d18O to mean annual temperature.
But still, it is what should be a well-defined linear formula. The coefficients will differ depending on how the standard deviations were computed — over the entire life of each core, over the common life of all cores considered, over the study period, using annual numbers or 5-year averages or 10-years averages, etc. But whatever method was used, the coefficients should be recoverable by regressing the index on the data series used.
My problem with the PNAS paper is that there is no such formula relating the decadal 2006 PNAS version of “Dr. Thompson’s Thermometer” to decadal averages of the underlying data he claims it was computed from.
There has been some discussion above about Energy & Environment not being listed in ISI. It meets ISI’s criteria, and is regularly submitted on time. When I’ve questioned ISI about this, the answer has been ‘not enough citations’ (for inclusion in its listings). Scopus and Google Scholar may well use somewhat different methodology from ISI but it seems strange that they both show quite reasonable cite scores, comparable to plenty of journals in ISI. Maybe ISI is deliberately keeping out a journal that occasionally pubishes papers that suggest that the AGW thesis is not watertight. Maybe they just have a hard time recognising the existence of anything that is not American or huge or a learned society. Who knows.
But the contention, in broader terms, that E&E has no impact, seems strange in the light of the amount of abuse it gets. Why bother about circulating all the false suggestions that it doesn’t do peer review etc etc, if it is so insignificant?
Publisher, Multi-Sciece Publishing
4 Trackbacks
[…] more: Irreproducible Results in PNAS […]
[…] bookmarks tagged temperate Comment on Irreproducible Results in PNAS by tty saved by 5 others newjamesdean bookmarked on 05/07/09 | […]
[…] Shady please stand up?” (CA 4/12/07), “More Evasion by Thompson” (CA 5/10/07), “Irreproducible Results in PNAS” (CA […]
[…] comment was accepted for publication, I posted a less technical summary on Climate Audit, entitled “Irreproducible Results in PNAS” […]