So far one of the most circulated e-mails from the CRU hack is the following from Phil Jones to the original hockey stick authors – Michael Mann, Raymond Bradley, and Malcolm Hughes.
From: Phil Jones
To: ray bradley ,mann@xxxxx.xxx, mhughes@xxxx.xxx
Subject: Diagram for WMO Statement
Date: Tue, 16 Nov 1999 13:31:15 +0000
Cc: k.briffa@xxx.xx.xx,t.osborn@xxxx.xxxDear Ray, Mike and Malcolm,
Once Tim’s got a diagram here we’ll send that either later today or
first thing tomorrow.
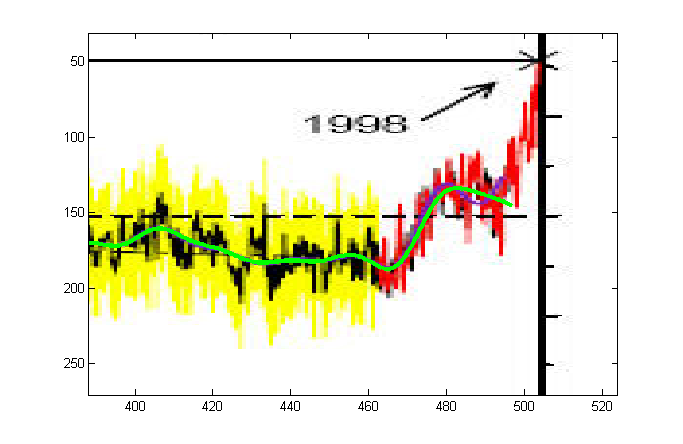
I’ve just completed Mike’s Nature trick of adding in the real temps
to each series for the last 20 years (ie from 1981 onwards) amd from
1961 for Keith’s to hide the decline. Mike’s series got the annual
land and marine values while the other two got April-Sept for NH land
N of 20N. The latter two are real for 1999, while the estimate for 1999
for NH combined is +0.44C wrt 61-90. The Global estimate for 1999 with
data through Oct is +0.35C cf. 0.57 for 1998.
Thanks for the comments, Ray.Cheers
PhilProf. Phil Jones
Climatic Research Unit Telephone +44 (0) xxxxx
School of Environmental Sciences Fax +44 (0) xxxx
University of East Anglia
Norwich Email p.jones@xxxx.xxx
NR4 7TJ
UK
The e-mail is about WMO statement on the status of the global climate in 1999 -report, or more specifically, about its cover image.
{Note: also see IPCC and the Trick, Keith’s Science Trick, Mike’s Nature Trick and Phil’s Combo

[Update November 24: Jones’ confession Nov 24 Update on the issue has the following graph, which is the WMO diagram without “Mike’s Nature trick”.

I think the graph speaks for itself, see especially “Keith’s series” (green).] [Update Steve May 5, 2010 – Jones’ graphic shown here appears to be identical to the version shown in Briffa et al JGR 2001].
Back in December 2004 John Finn asked about “the divergence” in Myth vs. Fact Regarding the “Hockey Stick” -thread of RealClimate.org.
Whatever the reason for the divergence, it would seem to suggest that the practice of grafting the thermometer record onto a proxy temperature record – as I believe was done in the case of the ‘hockey stick’ – is dubious to say the least.
mike’s response speaks for itself.
No researchers in this field have ever, to our knowledge, “grafted the thermometer record onto” any reconstrution. It is somewhat disappointing to find this specious claim (which we usually find originating from industry-funded climate disinformation websites) appearing in this forum.
But there is an interesting twist here: grafting the thermometer onto a reconstruction is not actually the original “Mike’s Nature trick”! Mann did not fully graft the thermometer on a reconstruction, but he stopped the smoothed series in their end years. The trick is more sophisticated, and was uncovered by UC over here.
When smoothing these time series, the Team had a problem: actual reconstructions “diverge” from the instrumental series in the last part of 20th century. For instance, in the original hockey stick (ending 1980) the last 30-40 years of data points slightly downwards. In order to smooth those time series one needs to “pad” the series beyond the end time, and no matter what method one uses, this leads to a smoothed graph pointing downwards in the end whereas the smoothed instrumental series is pointing upwards — a divergence. So Mann’s solution was to use the instrumental record for padding, which changes the smoothed series to point upwards as clearly seen in UC’s figure (violet original, green without “Mike’s Nature trick”).
TGIF-magazine has already asked [Update Nov 23 2012: WayBackMachine] Jones about the e-mail, and he denied misleading anyone but did remember grafting.
“No, that’s completely wrong. In the sense that they’re talking about two different things here. They’re talking about the instrumental data which is unaltered – but they’re talking about proxy data going further back in time, a thousand years, and it’s just about how you add on the last few years, because when you get proxy data you sample things like tree rings and ice cores, and they don’t always have the last few years. So one way is to add on the instrumental data for the last few years.”
Jones told TGIF he had no idea what me meant by using the words “hide the decline”.
“That was an email from ten years ago. Can you remember the exact context of what you wrote ten years ago?”
Maybe it helps Dr. Jones’s recollection of the exact context, if he inspects UC’s figure carefully. We here at CA are more than pleased to be able to help such nice persons in these matters.
Update April 1, 2010: UC has created a timeline for the trick (see here) and a turn-key Matlab code (the figure below). 


392 Comments
All I ask is that when journalists read these emails, they ask themselves, “how would I react if Enron or AIG executives (or for that matter the execs from any large corporation) had written emails like this”?
A much easier way to fix a problem like this is to not “change the base period till after I retire!”, or in a jam, just truncate!
Stefan Rahmstorf talks about using the IPCC to influence politics:
“The question here is: should our IPCC chapter say something to correct the wrong impression which had the political impact, namely that the MBH method is disastrously bad? This is not the same as the legitimate discussion about the real errors in proxy reconstructions, which accepts that these reconstructions have some errors but are still quite useful, rather than being “nonsense”.”
Interest to distinguish legitiamte vs. ???? in the IPCC.
The psychology of extrapolation beyond endpoints. There seems to be a strong human tendency to intrepret the endpoints of a series as though it were a vector. Essentially overfitting a trend to what is actually a noisy series. Humans are natural signal-searchers, pattern-seekers. Although it is scientifically indefensible to manipulate graphics by choosing colorations and endpoint representations that suggest alarm, it seems legitimate in policy world. Both sides are guilty of such distortions of fact.
bender –
I have found myself repeating your words, “There seems to be a strong human tendency to interpret the endpoints of a series as though it were a vector,” and would like to give appropriate credit when doing so.
Is this quote original? If so, how would you like to be attributed?
I would recommend Michael Shermer’s TED talk on Patternicity. http://www.ted.com/talks/michael_shermer_the_pattern_behind_self_deception.html .
Mike Mann talks about how to destroy the reputation of “Climatic Research” a journal:
“It is pretty clear that thee skeptics here have staged a bit of a coup, even in the presence of a number of reasonable folks on the editorial board (Whetton, Goodess, …). My guess is that Von Storch is actually with them (frankly, he’s an odd individual, and I’m not sure he isn’t himself somewhat of a skeptic himself), and without Von Storch on their side, they would have a very forceful personality promoting their new vision. There have been several papers by Pat Michaels, as well as the Soon & Baliunas paper, that couldn’t get published in a reputable journal.
This was the danger of always criticising the skeptics for not publishing in the “peer-reviewed literature”. Obviously, they found a solution to that–take over a journal!
So what do we do about this? I think we have to stop considering “Climate Research” as a legitimate peer-reviewed journal. Perhaps we should encourage our colleagues in the climate research community to no longer submit to, or cite papers in, this journal. We would also need to consider what we tell or request of our more reasonable colleagues who currently sit on the editorial board…
What do others think?
mike”
When Jones says the following and covers it over with references to stuff that is not relevant to point, is anyone who is familiar with these topics really surprised by the content and tone of the “discovered” emails.
And to further illustrate when Tim Osborn allegedly states ” .. although we usually stop the series in 1960 because of the recent non-temperature signal that is super imposed on the tree ring data that we use.” That bit of arm waving of an issue very critical to the validity of the entire proxy has been apparent in public comments for several years, so we should not be surprised to see it in an email.
Re: Kenneth Fritsch (#6),
No, after about 3 years of reading this blog, absolutely NONE of these emails surprises me one iota. I finally “grew up” and accepted the fact that much of “climate science” is a farce (to be kind).
Yikes! Jones admitted the validity of this email didn’t he? If so isn’t this evidence and admission of “cooking” the data in a published paper? How seriously should the rest of the published work of this cadre be taken in light of this?
Did Mann testify before congress about not welding instrumental to paleo? If he did, Finnish lake varves won’t be the only thing inverted:
Mike Mann of Penn State transforms to Mike Mann of State Pen
Hi Dr. Jones. I surmise from the leaked e-mails that you are a regular reader of this blog. I thought it was really awful of you to (among other things) cheer the death of John Daly. You should really be ashamed of yourself.
Re: nanny_govt_sucks (#9),
If this were a published document then you disgust is valid. These were PRIVATE emails between 2 colleagues. It is therefore reasonable for such a statement to be made as part of their coversation.
Re: thefordprefect (#44),
?? Can you please explain the distinction/nuance here? You {self snip]
Re: thefordprefect (#44),
Actually it is an employee of one university to an employee of another university, utilizing their respective employer provided e-mail systems. It may well not be PRIVATE between two colleagues.
Privacy has nothing to do with it, it’s a disgusting sentiment that speaks volumes about Jones’s morals.
Keith Briffa should be invited to do a guest post here based on the following remarks:
“I also believe some of the series that make up the Chinese record are dubious or obscure , but the same is true of other records Mann and Jones have used (e.g. how do you handle a series in New Zealand that has a -0.25 correlation?) . Further serious problems are still (see my and Tim’s Science comment on the Mann 1999 paper) lurking with the correction applied to the Western US tree-ring PC amplitude series used (and shown in Figure 2). There are problems (and limitations ) with ALL series used.”
Kevin Trenberth explains how to respond to skeptics:
“but the response should try to somehow label these guys and lazy and incompetent and unable to do the huge amount of work it takes to construct such a database. Indeed technology and data handling capabilities have evolved and not everything was saved. So my feeble suggestion is to indeed cast aspersions on their motives and throw in some counter rhetoric. Labeling them as lazy with nothng better to do seems like a good thing to do.”
Science at work.
Re: Pistolus (#11),
RealClimate does think it is real science
A wanting attempt at damage control.
Tom Wigley warns Mann:
“A word of warning. I would be careful about using other, independent paleo reconstruction work as supporting the MBH reconstructions. I am attaching my version of a comparison of the bulk of these other reconstructions. Although these all show the hockey stick shape, the differences between them prior to 1850 make me very nervous. If I were on the greenhouse deniers’ side, I would be inclined to focus on the wide range of paleo results and the differences between them as an argument for dismissing them all.”
Of course, Wigley is not on that side so doesn’t raise that inconenient issue.
Human nature being what it is: that people who enjoy prestige and position would try very hard to cut off incipient threat and enquiries, we should not be shocked by these email messages. The minimum change we hope this exposure should bring about is for the scientific community to demand open access to data and software that lie behind scientific results. No open access; no publication and no peer review.
There can be no justification for hiding these things in the 21st century. No clinical trial should hide its protocol and data; why should climate research be special? If we had open access, much of this nonsense might have stopped a long time ago.
I had been wondering about the context of that e-mail. Thank you for making it clear that it was a case of altering not the real data, but how it gets presented to the public and to politicians. Kind of like the games Rahmstorf played with the updated figures in the Copenhagen Synthesis Report.
Statements in isolated e-mails can very easily be taken out of context.
Does anybody undertand the context of the remarks by Tom Wigley in 1254108338.txt ?
Are they actually talking about additional retroactive adjustments of the historical instrumental record?? Or are they talking about tweaks in a model run?
If they are discussing adjustments to the 1940’s temperature record, having already chosen a desired result that won’t be too detectable, it is truly astounding.
OTOH, playing around with inputs to a model would just be a routine professional exchange.
Over at Real Climate they have finally acknowledged the leak. Gavin’s inline comment #19 in http://www.realclimate.org/index.php/archives/2009/11/the-cru-hack/
gives the context to Tom Wigley’s comments about how he would like the 1940’s SST temps adjusted upward by 0.15 degrees:
So it really is a statement by Tom Wigley about what he wants to do for adjustments to the historical SST record. Not based upon investigation of canvas buckets vs wood buckets vs sea water intakes, but based upon the desired effect on the global mean temperature.
It definitely reads like they’ve decided what they want the result to come out to be. This of course leads to the natural question of whether similar games have been played with the various adjustments made to the US surface temperature record.
Gavin further responds to this topic:
How dare you post personal correspondence for everyone to see, and then take it wildly out of context. Shame on you Climate Audit. Steve, I used to recommend your blog to folks for a balanced look at the statistics of climate research.
Not any more.
Re: A. Fritz (#17), A Fritz, RealClimate posted that same passage. It is all over the news (wired, wsj, etc.) Get a life. -Loren
Re: Loren J. Rittle (#26), The authors of RealClimate did not post any personal correspondence in their blog post on the hack.
Re: A Fritz (#190), in the 7th paragraph: “Phil Jones in discussing the presentation of temperature reconstructions stated that `I’ve just completed Mike’s Nature trick of adding in the real temps to each series for the last 20 years (ie from 1981 onwards) and from 1961 for Keith’s to hide the decline.’ ”
http://www.realclimate.org/index.php/archives/2009/11/the-cru-hack/#more-1853
That looks like the same quote you complain about here. I rest my case.
Loren
Re: A. Fritz (#17),
Steve did not not post this, I did. I didn’t see any problem of reprinting the whole e-mail as it was already printed, among others, in the TGIF-magazine linked in the post.
Re: Jean S (#67), A little bit of “the high road” would be nice.
There seems to be a strong human tendency to intrepret the endpoints of a series as though it were a vector. Essentially overfitting a trend to what is actually a noisy series. Humans are natural signal-searchers, pattern-seekers.
Bender this is a superb insight and helps to explain challenges in climate science as well as financial scams.
I feel vindicated! Go to 1189797973. Beside trashing some heretic named Akasofu, Dr. Mann writes,
Here, from a real honest to goodness scientist, is a confirmation of my minority point of view (here at least) that the effect of the NAS panel report on tree rings was not to discredit it, but to confirm it with a small selection of other proxy studies. So many focused on the language debunking the tree ring study in the report, they did not see the forest for the trees, and could not believe the NAS might be involved in fr–d! Hey, it keeps the money flowing. No AGW, no funding, no Goldman S paid junkets, no Brit Govt. Carbon Finance gifts.
Thank you Dr. Mann!
Additional amplification, email 096601563.txt, concerning Mike’s Nature Trick:
.
EXCERPT:
.
I added the emphasis. Interesting excerpt later on, too:
.
Here’s the explanation. It was a spelling mistake. He meant to say “eyed the decline”. OK?
A while back 2007 late? ran across long discourse between three ice core scientists, antartica, greenland, and russia, discussing core findings, isotopes I’d never heard of, and various theories on effects. I read for a long time, and came back to it a couple of times and continued. Eventually, “anomalies” were discussed and how to deal with them. Results were agreed on to be deleted. I wonder if that matches the wonderful smooth hockey stick?
Another item: concurrent with the codfish disappearance in the North Atlantic/Canada area, may have been “impossibly high CO2 readings” by one of the instrument monitors. I wonder if there was any connection,
Having said that, we may produce 1981-2000 normals in the next year for SST if we can solve adequately remaining problems (for climate change monitoring) with satellite SSTs. A key goal is monitoring changes in the Southern Ocean.
Who said IPCC AR reports executive outlines were intended to hide or deceive what the scientists were saying in the full length versions?
A quote from Kevin Trenberth on the leaked e-mails:
Color me surprised.
Who said IPCC AR reports executive outlines were intended to hide or deceive what the scientists were saying in the full length versions?
Who said IPCC AR reports executive outlines were intended to hide or deceive what the scientists were saying in the full length versions?
1103647149
“How dare you post personal correspondence..”: is any of it personal? It looks to me to be work correspondence. If any of it is personal – beyond the trite “how are your wife and children?” level – I don’t wish to read it. Nor would there be any point – it’s their skulduggery that interests me, not their love affairs or family problems.
It appears my comment didn’t get through the first time.
Thanks for explaining the temperature trick. I see that realclimate doesn’t address the real issues involved. I’m not suprised.
It is going to be interesting to see how this all unfolds.
0959187643.txt
LOL.
Steve, you are just fantastic.
I think part of the problem is that everyone seems to assume classical Gaussian statistics in their analysis whereas one should really use the Mandelbrotian fractal or fat-tail probability and statistics models. The dispersion in all the data leads to divergences and whether these are spurious or not can only be determined by using a different type of analysis. Out of the depths of fractal noise will come the real trend; it is just too tempting to not start analyzing.
Re: buppity (#32), to paraphrase Feynman, we use Gaussian statistics because we can actually solve them.
jon #32, Quoting Feynman, you do realize that many of the ideas behind statistical mechanics and entropy is that the standard deviations can often be as large as the mean? The greater the variance, the greater the entropy. As time goes by we realize that more and more phenomena follow power-laws as opposed to Gaussian statistics.
I hesitated at first to believe the hacked emails are authentic, buy the way the scientists at Real Climate delete reasonable polite disagreement that they can’t easily refute, it appears that hiding declines, hiding disagreement, hiding what ever contradicts their agenda is the every day mode of operations. These Climate scientists have subverted and perverted true science.
New acronym for climate blogging:
htd
See Dr. Phil Jones for definition.
Subject: Re: For your eyes only
Just sent loads of station data to Scott. Make sure he documents everything better this time ! And don’t leave stuff lying around on ftp sites – you never know who is trawling them. The two MMs have been after the CRU station data for years. If they ever hear there is a Freedom of Information Act now in the UK, I think I’ll delete the file rather than send to anyone. Does your similar act in the US force you to respond to enquiries within 20 days? – our does ! The UK works on precedents, so the first request will test it.
We also have a data protection act, which I will hide behind. Tom Wigley has sent me a worried email when he heard about it – thought people could ask him for his model code. He has retired officially from UEA so he can hide behind that.
Re: Follow the Money (#37),
This all just stinks to high heaven (religion,Bender?) but how can you break a Government conspiracy??
Instead of discussing the emails, I wonder if the folks at Real Climate will discuss email proxies. If you look at the proxies, it doesn’t look so bad.
Here’s a good one, about massaging data, from 1257874826.txt
One final thing – don’t worry too much about the 1940-60 period, as I think we’ll be
changing the SSTs there for 1945-60 and with more digitized data for 1940-45. There is also
a tendency for the last 10 years (1996-2005) to drift slightly low – all 3 lines. This may
be down to SST issues
Re: Chris (#40),
I think the data is from ships logs :
Destroy the evidence.. before it’s discovered by an Formal Information Request
Posted on RealClimate #161:
I don’t think the Nature trick has been described adequately in your post. It isn’t just graphing the instrument record for comparison, but graphing it to ‘hide the decline.’ They didn’t just cut off the proxy value and add on the instrument record from 1961 on; they used the instrument temperature values to calculate smoothed average value for earlier years as well. That is the ‘trick,’ to let the instrument record replace actual values of the data that are lower than you want.
[Response: This has nothing to do with Mann’s Nature article. The 50-year smooth in figure 5b is only of the reconstruction, not the instrumental data. – gavin]
Did I get it right? The censors appear to be off for now, so someone else who understands it should try a followup.
Re: MikeN (#42),
I don’t find it too meaningful to reply on anything coming from RC, but this is just a prime example of how they communicate with public so here we go.
First, notice that Jones talks about “adding” temperatures to data not “plotting along” as the “group” misinforms over RC. “Adding” is exactly what Jones did: he took the reconstructions (three of them; listed in the figure caption) until the final years, added the instrumental temperature from that on, and then smoothed this with end point padding. In other words, he “grafted the thermometer record onto” reconstructions.
Second, notice that Jones writes about adding temperatures to “Keith’s” and “Mike’s” series. So there is “a decline to hide” in both series. If Jones was talking only about “Keith’s series” (as RC claims), he would have likely chosen the word “divergence” instead of “decline”.
Third, gavin is right in that only reconstruction (without any padding!) was smoothed in “Mike’s Nature paper” (MBH98), but “Mike’s trick” (adding real temperature to reconstruction before smoothing) was actually used in “Mike’s GRL paper” (MBH99), which contains the series commonly referred to as the “hockey stick”, and more importantly here, is plotted in Jones’ WMO figure. So “Mike’s Nature trick” is actually slightly a misnomer (should be “Mike’s GRL trick”) from Jones’ part, but I do not blame him for that.
Overall, I find it astonishing that Gavin is still playing these word games after their private rhethoric has been exposed to whole world. Borrowing some Team language, I say this behavior is definitely a “robust” feature of their communication.
Re: Jean S (#66), Didn’t he cut off the end of Keith’s chart at 1961, then add on temperatures from 1961 on?
Re: MikeN (#129),
Yes, IMO that is even worse (i.e., one substitutes instrumental data for reconstraction data) than Mike’s trick. Haven’t found any name for it from e-mails, so shall we call it “Phil’s WMO trick”?
Re: Jean S (#66),
UC has corrected me on the fact that adding the instrumental series to the proxy data prior smoothing was used already in MBH98 (Figure 5b), so, unlike I claimed in #66, “Mike’s Nature trick” is NOT a misnomer. Here’s the evolution of tricks in order of their appearence:
-“Mike’s Nature trick” (MBH98): add intrumental series to the end of the reconstruction prior smoothing
-“Mike’s GRL trick” (MBH99): “Mike’s Nature trick” + pad the series (padding now coming mostly from the instrumental seris) in order to smooth the series up to the end point of the reconstruction
-“Jones’ WMO trick” (aka “grafting the thermometer record onto a reconstruction”) : As “Mike’s GRL trick” but smooth all the way to the end of instrumental series + do not indicate that there are in fact two series combined into one.
I’m not sure where the “trick” (also used in Jones’ WMO graph) of cutting Briffa’s series in 1960 appeared first.
Also, I’d like to dedicate this post to Ben Santer:
Re: Jean S (#308),
Ben Santer admitting climate science is actually discussed in a dark alley? In light of sleaze revealed in the emails, that that doesn’t seem to me an interpretation that is out of context.
Re: MikeN (#42),
Hmmm. And now you need to hurry to invent a padding method that yields 5b without instrumental 🙂 Why do you defend mike, gavin? Isn’t it a bit frustrating?
Re: UC (#312), I now have the graphics before me, the page had just been relocated, and I need to make a correction. Prof Jones’ real graphic shows that the anomaly in the proxies never rose above 0, but in the “persuasive graphic it rises to +3. The proxies in both do attain a millenial maximum within the instrumental period.
Re: bobdenton (#314), Sorry UC, my reply should have been to my own post at 311.
Re: bobdenton (#310),
All the climate scientists seem to carry the same thought – zero doesn’t matter, only the trend. Unless the zero used shows the highest anomaly, that is.
I’m sorry, but I’ve been an electronics technician for years. Zero (reference) does matter. If I raise a voltage level by 1 volt, am I returning it to zero, or going above zero? Trend wouldn’t matter, but the result on the system will be affected.
Re: UC (#308),
http://www.realclimate.org/index.php/archives/2009/11/the-cru-hack/
..and here’s instrumental (81-95)+zero padded Fig 5b smooth (red):
Whole pic in here , green line is without the trick.
Re: UC (#316),
Thanks! Looking the original figure closely, it seems to me (the smooth starts in ~1425 and ends ~1975) that no (zero) padding was used in MBH98 (so no revision needed to #305). Correct? What was mike’s filter choice back in 1998?
Re: Jean S (#317),
I think instrumental + zeros are needed (I used Mann’s lowpass.m, which applies IIR filter). Not sure though, Mann’s articles are of 0 degree reproducibility ( http://www.climateaudit.org/?p=6797#comment-353367 ), but the match is pretty close.
Modify Mann’s lowpass.m with
if (icone==0)
apad=mean(indata)*0;
and you’ll get this result.
Falsifying the data to get the desired results:
Re: getstaffed (#43),
I think the quote actually means something different than you’ve indicated. The quote actually reads: (from #0932773964)
“Keith succeeding in being very restrained in his response. McIntyre knew what he was
doing when he replaced some of the trees with those from another site.”
In the second sentence, the “he” was Steve, not Briffa. Jones is essentially claiming that Steve selected (or cherrypicked) the additional site to add in, knowing the result that it would have.
In making this accusation, he ignores the detailed explanation and rationale for the choice (and ignores the criticism raised that Briffa failed to explain HIS rationale for the (small) selection that was used), but he is speaking to a like-minded, uncritical audience and trying to bolster them against the criticisms raised.
Re: Ian (#57), Yes, the he is Steve. Phil Jones felt that Steve was way off, and thus Briffa was restrained in his response. Steve pegged Briffa correctly, and knew Briffa would understand the issues. Looking at the e-mails, it appears Briffa is neutral on the MWP as of early 2000s along with Cook, and both are being bullied by Mann, saying their papers shouldn’t be published.
There’s interesting stuff in the pdf and word docs too. Looks sort of like a plot to use climate science to regulate the entire world economy. See the ADAM pdf.
From – 1252154659.txt
I second the earlier comment. Dr. Jones. I think you are a shocking and untrustworthy individual for gaining happiness in the death of a person that disagrees with you.
snip
How can unwelcome editors be ousted through “official” channels if they are “sceptics” (1106322460.txt), I wonder.
>> > At 04:30 PM 1/20/2005, Tom Wigley wrote:
>> >
>> > Mike,
>> >
>> >
>> >
>> > This is truly awful. GRL has gone downhill rapidly in recent years.
>> > I
>> >
>> > think the decline began before Saiers. I have had some unhelpful
>> >
>> > dealings with him recently with regard to a paper Sarah and I have
>> >
>> > on glaciers — it was well received by the referees, and so is in
>> > the
>> >
>> > publication pipeline. However, I got the impression that Saiers was
>> >
>> > trying to keep it from being published.
>> >
>> >
>> > Proving bad behavior here is very difficult. If you think that
>> > Saiers
>> >
>> > is in the greenhouse skeptics camp, then, if we can find
>> > documentary
>> >
>> > evidence of this, we could go through official AGU channels to get
>> >
>> > him ousted. Even this would be difficult.
>> >
>> >
>> > How different is the GRL paper from the Nature paper? Did the
>> >
>> > authors counter any of the criticisms? My experience with Douglass
>> >
>> > is that the identical (bar format changes) paper to one previously
>> >
>> > rejected was submitted to GRL.
>> >
>> >
>> > Tom.
>> >
>> > ===============
1106322460.txt
McCarthyist aim to control the levers of the publication enterprise:
Not sure if this was suggested before. Given the situation now is “all bets are off” with AGW, shouldn’t all scientists now get together, WITHOUT the politicians, and discuss what to do next to save face? Climate science research can no longer continue the way it has. Sure the public may not know this yet; maybe even never given they are already confused and it’s easy for the governments with the assistance of most of the media to keep them confused. But scientists everywhere can’t and won’t ignore all this. It’s too big. Surely once the dust settles things can’t go back the way they were, especially if the material leaked is all true.
Re: PeterA (#55), Just to voice a probably related attitude — those revelations come as extremely depressing to scientists who realize to be destined to work within such a system. It is not that I got to know something conceptually new, but such a direct exposure to the concentrated quintessence of how science should NOT operate, is depressing. Where is a genuine, open interest to science, to new ideas, new discoveries? Imagining that this type of people are to evaluate one’s next submitted paper with some unconventional ideas is truly gloomy and near to kill creativity. I think it is in the interest of the society not to let things return to their usual way when “the dust settles”.
Re: Anastassia Makarieva (#82),
Yes, and on a similar situation with the Space Shuttle disaster where the managers and administrators ignored the reported risks of taking off after a cold snap. Perhaps all this will also lead to a re-awakening of what true science is all about.
Re: Anastassia Makarieva (#83),
I totally agree. I find all these very disturbing and depressing. I posted the following to RC. No reply yet.
Dear Dr. Schmidt,
I am doing a PhD in climate science and am quite shocked to read some of the things in the hacked e-mails. I would never think of “hiding” or “deleting” some data or code. Look what Prof. Jones once wrote:
At 09:41 AM 2/2/2005, Phil Jones wrote:
“…
And don’t leave stuff lying around on ftp sites – you never know who is trawling them. The two MMs have been after the CRU station data for years. If they ever hear there is a Freedom of Information Act now in the UK, I think I’ll delete the file rather than send to anyone. Does your similar act in the US force you to respond to enquiries within 20 days? – our does ! The UK works on precedents, so the first request will test it. We also have a data protection act, which I will hide behind. Tom Wigley has sent me a worried email when he heard about it – thought people could ask him for his model code. He has retired officially from UEA so he can hide behind that.
…”
Funny thing is, I’ve been searching for the CRU station data too. Only to learn that I can get the gridded data and nothing else. I was surprised, but now I understand.
I am seriously considering leaving ‘science’, if this is what I have to become after years. What is your advice for me?
Regards
The emails are on wikileaks.org now:
http://wikileaks.org/wiki/Climatic_Research_Unit_emails,_data,_models,_1996-2009
It would please me to no end if we just referred to this collection as “The CRUTAPE letters”
with a hat tip to CS lewis.
http://en.wikipedia.org/wiki/The_Screwtape_Letters
screwtape played by jones
wormwood played by mann
Tm moshpit
“If this were a published document then you disgust is valid.” On the contrary, if it were a published document, what was said would be “just politics”. That it was said in private shows that Jones was being a grade one sh1t.
Does any of this remind anyone of C.S. Lewis’ “That Hideous Strength”? Eventually they became unstuck.
Pls get 100% confirmation that all these emails and documents are real. It could be a very sophisticated plant to embarrass scientists like Steve McIntyre.
Also, pls ask the relevant authorities to ensure that CRU does not DELETE anymore of their data files and emails. If all this released info turns out to be legit, then every bit of information on the CRU servers should be made public and scrutinized in a public investigation.
Re: Paul Z. (#62),
Yes I can see how this all could be an elaborate deception to make AGW skeptics and deniers look like idiots. However, if this is so wouldn’t it still prove that proponents of AGW have something to fear and/or hide? So much so they had to resort to such tactics? Either way, it’s a poorer show by the AGW believers.
Given this is such a monumental event, there should be some kind of impartial investigation by scientists from all sides of the debate. It’s time to come clean. Otherwise, this could turn very ugly for the credibility of science as a whole.
Re: PeterA (#65),
I agree, PeterA. Somehow all this dirty laundry needs to come out and be washed in public. Not sure how impartial this would be, given that so many people have their hands in the AGW cookie jar.
@the statistic wizards: Is there any 100% confirmed genuine code in the hacked files which shows the Al-Gore-rithm used by uu@W to make his hockey stick? Please say there is…
This is part of one of the emails from the Hadley climate research center:
“I really wish I could be more positive about the Kyrgyzstan material,
but I swear I pulled every trick out of my sleeve trying to milk
something out of that. It was pretty funny though – I told Malcolm
what you said about my possibly being too Graybill-like in evaluating
the response functions – he laughed and said that’s what he thought
at first also. The data’s tempting but there’s too much variation
even within stands. I don’t think it’d be productive to try and juggle
the chronology statistics any more than I already have”
Not exactly a smoking gun by any means, but I’m a little concerned at the caviler attitude towards working to make the data say what you think it should. I thought the scientific method was to go where the data led you, not to work towards reshaping it to fit a preconceived conclusion.
Charlie: quote It definitely reads like they’ve decided what they want the result to come out to be. This of course leads to the natural question of whether similar games have been played with the various adjustments made to the US surface temperature record. unquote
Good science explains the data: poor science explains it away.
JF
Mr. McIntyre, could you put a pack of all your private correspondence with Anthony Watts, Marc Morano and anybody associated to a think tank on a server, so we can download it and have a look? I mean, you are so honest and transparent that there is nothing in there that can be pulled out of context, right?
What if someone stole this correspondence from you, put it somewhere on the web and I quote some of it on my blog (and the commenters would take it from there)? What would you think of me?
Re: Neven (#69),
Neven, why are you resorting to personal ad hominem attacks on Steve? Why not focus on the message instead of disparaging the messenger? Furthermore, Steve is not the one who hacked the CRU files, he is just reporting his research. So quit these childish personal attacks, it makes the AGW alarmist camp look even more desperate.
Re: Neven (#69),
This is no private correspondence.
Neven, you half wit
CRU have received £ millions of public money to monitor and develope an ACCURATE and TRUEFUL view of climate change. If you take the Queen’s shillings then your information and data belong to the Queen and her subjects. Ergo, when you write your emails etc you write them knowing that they will be available for public scutiny. Read the info and open your thick scull. Mon dieu
The following posts discussed the deletion of the post-1960 Briffa data and my thwarted attempts as an IPCC reviewer to get them to disclose the post-1960 decline in the IPCC AR4. There were earlier discussions in 2005.
http://www.climateaudit.org/?p=1792
IPCC and the Briffa Deletions
June 26th, 2007
http://www.climateaudit.org/?p=1737
How IPCC AR4 authors defended the Briffa data deletions
June 16th, 2007
http://www.climateaudit.org/?p=1579
Swindle and the IPCC TAR Spaghetti Graph
May 15th, 2007
As an IPCC reviewer, I had writteN:
In response, IPCC section authors said:
No, Stephen Richards, this is about casting stones by a lynch party that has declared itself, judge, jury and executioner. I’m sure I could quote a lot more spectacular stuff in Mr. McIntyre’s correspondence than everything I have seen produced so far on … sites. But we’ll never know, will we?
Re: Neven (#73),
Neven, who’s lynching who here? You’re the one casting the stones.
Wait… I know… you’re really Dr Phil Jones in disguise, right? Awww did puddy tat get his feelings hurt reading “Mike’s Nature trick” and “hide the decline”.
GET A LIFE. WE WON. YOU LOST.
Re: Paul Z. (#75),
I hope you are correct in your unsupported beliefs.
I am in the edge of the warmist’s camp
BUT
I could always say “we may be lucky, perhaps the consensus of scientists are all in it to make money from the grants just like the sceptics shout”.
I have read many of the emails from this illegal hoard. I have not seen one that shows any of the scientists involved suggesting that AGW is a scam. I find this very scary as now perhaps we do really need to start taking action to stop AGW.
But I know that there is hardship involved in taking this action (especially to USA where power is cheap through use of coal, and petrol is 1/3rd the cost of Europe).
I know that most people are interested in here and now and their current standard of living. I am therefore fairly certain that action will not be taken until it is too late.
How long will it take for an improved temperature network run by sceptics validates or invalidates the global temperature rise.
Will it be too late for my children or will we be condemning them to a fuel impoverished and polluted future?
Have you noted any emails where an admission that global warming is not happening?
Mike
Re: thefordprefect (#89),
Well, we’ve got Kevin Trenberth declaring it a “travesty” that no one can explain the lack of warming in recent years.
But really, the story here is not that these e-mails prove anything one way or the other about global warming. Rather, what they illustrate is the stunning extenct to which the objectivity of these scientists has been destroyed by confirmation bias.
These guys have literally elevated “global warming” to be the standard by which the credibility, relevance, accuracy — indeed, even the morality — of any data or any argument or any individual is to be judged. In their world, all that which supports the claims of AGW is the good, the valid, the accurate, the proper – while all that which contradicts, questions or critically examines AGW is the bad, the invalid, the improper. And in accordance with this standard, the e-mails reveal a willingness to obstruct, distort, deflect and obfuscate to protect and promote “the good” and stop “the bad.”
Mind you, this is not being done to push something they know to be false — rather, and this is much more dangerous, they are doing this to protect something they believe in so strongly they’ve decided it is beyond anyone’s right to question or examine.
The e-mails tell us little about the science — but they tell us a great deal about the scientists.
Re: thefordprefect (#89),
Why should they? For the Team AGW is The Truth.
What is much more telling is the reaction on any paper, that does not scream AGW. The first question is invariably “How could this slip through”?
Or just read the reactions on Steve Mc’s comments – only few of those are concerned with the facts and those are mostly from people who shortly collaborated with The Team and then they went their separate ways (Moberg, Zorita).
Even Esper was criticized – see this. Poor Esper – here he is called “Esper the Non-Archiver” and the other side calls him “flimsy” 😉
Re: EW (#96),
So all those Scientists mentioned in these emails (10 or more?) are totally incompetant and have got it all wrong and have managed to convince a few thousand others of their error?
This is totally unbeleivable! If there are a majority of scientist with this belief why should you therefore conclude that the minoity has it right?
Re: Perry Debell (#93), can you show me where you get this information.
looks pretty warm too me. Please do not just show the last 9 years where everybody agrees the temperatures have been stable.
[ed: TFW, please don’t just show the last 200 (or 400) years where everybody agrees the planet has been recovering from the LIA. You’re wasting space.]
Re: thefordprefect (#102),
Then can we talk about the 1910-1945 period that had the same rate of warming and pretty much the same delta T as the 1975-2000 period?
Re: thefordprefect (#102),
The only reconstructions going back 1000 or more years have been discounted by sceptics. So you know I cannot provide data, so do not talk such garbage.

Here is something that shows possible temperatures back to 1300s:
First over instrument record:
Now the full record:
This is the best I can do. Can you show the LIA and MWP in instrumental record or am I just supposed to accept it on trust?
Re: thefordprefect (#122),
It’s you talking “garbage”. Care to engage? Or will you be retracting your remark now to avoid embarassment?
Re: bender (#124), tried replying but server down.
“Care to engage?” – in what? about what? where? I will talk only about things I know or have investigated.
If this thread is inappropriate then care to step outside?
stainless.steel.rat at hotmail.com
Mike
Re: thefordprefect (#122),
Your own graph shows a cold “spell” for most of the 1600s.
And aren’t longer growing seasons good?
But I’m more interested in the ECW (early century warming, as in this century), which I asked you about earlier.
Re: John M (#154),Ok here’s a 10year moving averaged CET temperature
Note first that the wild swings are greater at early times – indicating perhaps greater variability or less accurate measurements.
I favour the first.
An explanation from me (not involved with climate science)
Note also that the peak temp in 1735 using this 10yr filter) was +0.5C
The 2002 peak was 1C
Note that 1745 to 1905 there was insignificant rise
Note that in 1695 there was a significant drop in temperature (the insolation was presumably constant therefore the energy went somewhere
In 1735 the energy returned and temperature rose 2C only to fall back to nominal in 1745
The current temp rise is not preceded by fall but will the rise be followed by a fall?
1. So we now need to wait 40 years (1735 – 1695) to see if the energy of overheat is returned – can we wait this long.
2. now of course we need to be able to explain how incoming energy is multiplied to produce overheat!
Re: thefordprefect (#186),
One station?
Re: thefordprefect (#186),
Still not sure how that is not consistent with a “LIA” You’ve just confirmed a cold period in the 1600s.
And the very recent warming may very well have some land use changes baked in.
And the warming in the global temperature early last century?
Re: John M (#197),

Rural/island UK stations:
Re: Cold Lynx (#194),

35 UK satations
Re: thefordprefect (#203),
Thanks.
Current temps in England look about 0.4 C above what they were earlier last century. Hard to tell from your data what those temperature stations in the “rural” areas look like, but for the sake of argument, I’ll accept your data.
Now, about this question…
http://www.climateaudit.org/?p=7810#comment-366456
Re: John M (#205), Is this not good enough let me know what more you require
Re: thefordprefect (#209),
My question here, which refers to the global temperature, as does the graph you posted here.
Re: Neven (#73),
I don’t see anyone advocating execution, I see people who are rightly questioning and/or denouncing the partisan advocacy for AGW that is shown in these emails. There are elements exposed that are antithetical to the scientific method and to good science in general. Your repeated attempts to turn this discussion into one that deals with your conjectures about the morals or personality of the sites author are a rather transparent evasion.
Best of luck on your trolling efforts though, with a little practice I’m sure you’ll improve.
Re: Neven (#73), Re: Neven (#78)
I see. There’s no risk or cost to imposing CO2 restrictions worth mentioning. As a precautionary measure, let’s imperil the global economy and arrest or reverse the uplift of billions of people. Fortunately, neither the Chinese, the Indians, nor the Russians agree with you.
snip – venting and policy
Re: Neven (#73),
Neven,
It appears you aren’t concerned with how things were conducted by those in the emails.
Is that true?
Jean S,
The other type of trick is simply to delete raw data. There are a few examples of this in the hacked emails – sorry for the length of this one, but it covers some personal events and correspondence from some time back. Some non-important chat has been deleted by me.
1184779319.txt
………finishes with no answer.
This one is a bit long too, so I’ll give only the intro……
1074277559.txt
WE WON. YOU LOST.
AGW better be the scam you say it is, because if it isn’t we all lose. And your ethical position will be so screwed up that even you yourself will notice it.
Re: Neven (#77),
Dr. Jones seems to think otherwise.
Re: Neven (#77),
Neven… seriously man (or woman)… ETHICS??? C’mon, now. What’s ethical about AGW alarmists hiding data, obstructing researchers, deleting emails, and being happy when a scientist who criticizes their work dies?
Neven,
AFAIK, Mr McIntyre has been scrupulously fair in his enquiries into obtaining the raw data from Mann, Jones et al. Now it seems that the stonewalling he encountered was engendered by real panic and fear that his expertise in statistics would expose the shenanigans perpetrated by self righteous scoundrels who are in it for the money and the political clout. It does not matter how they were caught with their hands in the cash drawer, they were doing wrong and now they will have to answer to their betters. M’thinks you doth protest too much. Are you in collusion with “the team”?
Might I also suggest you put your name down for a copy of this new book. You appear to need the education.
http://bishophill.squarespace.com/blog/2009/11/21/the-hockey-stick-illusion.html
I had been worried that the MSM were going to close their collective eyes to this but yesterday James Delingpole in the Daily Telegraph (UK) ran a good piece on it. Mind you the DT rather spoiled it with an article today from Geoffrey Lean informing us that the recent severe floods were a consequence of climate change.
The Daily Mail has also picked it up this morning. Perhaps there is some movement about to be seen. Live in hope. Keep on the pressure.
http://www.dailymail.co.uk/news/article-1229740/Hackers-expose-global-warming-Claims-leaked-emails-reveal-research-centre-massaged-temperature-data.html
There are no winners and losers in this debacle. Either
a) AGW is true but our suspicions of a conspiratorial approach by the “hockey team” is also true and now exposed to the public, in which case the public will probably never trust science again or
b) AGW is false, the conspiratorial approach is exposed and the public will never trust science again
Either way it is the scientific community that will suffer under the barrage of criticism that will follow if the MSM give this story the air time it deserves. I think they have too much invested in Copenhagen to print this on the front pages in the near future.
“Perhaps all this will also lead to a re-awakening of what true science is all about.”
Nah.
I’ve met some of the new scientists that are making their way through programs such as neuroscience…
Same as it ever was, same as it ever was. They are human just like the rest of us, perhaps more political than in years past, and since we have easier access to NSF funds, the borderline persons are more prevalent.
New York Times is covering the story, too:
I’ve decided to save the casually curious from the need to download 61MB of stuff, unzip etc. by sticking the emails (with addresses futzed and some phone numbers ditto) on my webserver along with a fairly basic search engine.
Now anyone can search for “M&M” or “FOI” and see everything that shows up – no need to rely on journalists or bloggers potentially selectively quoting emails. Also if you see a quote on a page with a somewhat cryptic reference such as “1103647149” or “1103647149.txt” you can paste the numbers in to the “Open” box and get the file displayed for you.
The tool is here
http://www.di2.nu/foia/foia.pl
Mike Fordprefect,
Yes, global temperatures did increase slightly between 1980 and 1998, as part of a natural cycle. That 0.7C rise has been reversed since 2003, although CO2 levels have continued to creep upwards and this rise in CO2 to 388 parts per million has benefited cereal production. I am confident that CO2 is not a pollutant and that human lives do not pollute the planet. Of course there are those who do consider that human life does pollute the planet, but probably they also believe their faecal waste doesn’t smell either.
The elites would seem to prefer a global population around one billion, half of whom would be service staff. Is that what you want?
BTW, as only 3% of atmospheric CO2 is down to humans and the remaining 97% is Gaia’s production, extinguishing 80% of human life would be just a little drastic.
A simple solution to airing comments moderated directly into the memory hole at RC, may be to set up a “Real Climate/Quiet Watch” website and, by mirrored date and topic, allow rejected submitters to start compiling them.
Oddly, frequently when updating the RC comment screen – say, for example when at the end of comments at #181 – the refreshed comment number suddenly became #192. Almost as if additional comments we inserted after one reached the end of that particular screen.
One point has not really been addressed: They’ve attempted to oust editors from journals if they are considered skeptics, smeared any journal that does not toe the line, and tried to ensure reviewers are only warmists. These researchers have attempted to totally corrupt the peer review process (at least in their field). The peer review paradigm is dead and must be replaced with something else.
Re: BarryW (#95),
The AGW response is a project with world wide implications for the environment and the economy. I find it astonishing that it is being conducted in such a slapdash manner and being directed by the petty politics of academic researchers. The response to this issue needs to be coordinated and managed. There should be no question that academic rivalries and ambitions are playing any part in the resolution of such an historic issue.
Those of us who have had experienced with “peer review” know that it is not the disinterested assessment of results that some people male it out to be. We know, that even at its best, it is not an arbitrator of “truth” but merely an assessment of whether work fits into a conference or a periodical. At a realistic level, it is more of an assessment of compatibility with the views of the in-group. The press has been led to believe that “peer reviewed” implies certain. We all know that that is in no way true.
The IPCC should be a research organization in the true sense. It should direct research and set goals for the production of results. There should be no question of IPR holding up any research. Part of the “patent deal” is that the inventor reveals enough so that his work can be replicated and that anyone can reverse engineer it for further research without compensation to the inventor.. This should be part of the deal that any researcher would have to agree to for participation in IPCC research.
Above you write”When smoothing these time series, the Team had a problem: actual reconstructions “diverge” from the instrumental series in the last part of 20th century. For instance, in the original hockey stick (ending 1980) the last 30-40 years of data points slightly downwards. In order to smooth those time series one needs to “pad” the series beyond the end time, and no matter what method one uses, this leads to a smoothed graph pointing downwards in the end whereas the smoothed instrumental series is pointing upwards — a divergence. So Mann’s solution was to use the instrumental record for padding, which changes the smoothed series to point upwards as clearly seen in UC’s figure (violet original, green without “Mike’s Nature trick”).”
It’s clear to me that Mann knew that the proxies did not show the empirical temperature change that was actually meaasured. So what should Mann have done? Blindly insisted that the proxies were correct or discard the proxies contaminated by non-temperature signals (see post 2 above). It’s obvious to me that if proxies diverge from actual measurements then they should be replaced by the empirical data. So if Jones did a similar thing what’s wrong with it?
Re: Turboblocke (#97),
What Mann is producing is an estimate of temperatures by proxies. If this diverges from known temperatures than this is a major problem for the proxies. This cannot be corrected by substituting measured temperatures since this would defeat the purpose of using proxies in the first place. If the proxy-derived estimate is incorrect due to corruption by non-climatic signals in the modern period then why would it not be corrupted by non-climatic signals in other periods.
Substituting measured temperature data for proxy data would be very incorrect and make the “reconstruction” useless.
Re: Turboblocke (#97),
I should think that what should be done is that the graphs should not have been combined, pretending to show a composite result that was internally coherent. If the proxies and the actual measure can vary so, and the actual measure is, naturally, more trustworthy, doesn’t that discredit in large measure the proxies, at least at the level of detail relevant? How, for example, do we know that actual measurements in the distant past might not have shown very similar discrepancies from what the proxies are showing? Perhaps actual measurements in the past would have shown great variabilities that simply don’t show up in the proxies. If so, this would entirely discredit the basic argument Mann was making for the hockey stick at the end; the variability in the present would simply be one of a number of such, and would not in any way imply that, over the last millenium, there is a unique hockey stick at the end.
Re: Turboblocke (#97),
How about full disclosure about the problem and about what was done to achieve the end result (ie. a hockey stick).
Re: Turboblocke (#97),
There would be no point in having proxies stretching back thousands of years if you could just replace them with actual temperature measurements, would there? If the proxies diverge now, and you have little/no understanding why, how do you know they didn’t diverge in the past when there was no empirical data?
.
The confidence in the reconstruction to present temperature has direct bearing on the confidence of reconstruction in the past. If you cannot have confidence in the modern reconstruction, how can you claim with any confidence what the temperature was like in the past?
I can understand why Jones doesn’t want the base years to change: a prominant “sceptic” site complains how GISSTemp is always showing higher anomalies that CRU, UAH and RSS. Funnily enough, that discrepancy corresponds to the anomaly due to the earlier baseline years used by GISStemp. If you have an earlier baseline when temperatures were colder then the anomaly will be greater.
So Jones is concerned that if they introduce a new baseline say 1971 -2000, the anomaly compared to the NEW warmer baseline would be smaller, so uninformed (or manipulative) people would point to it and say there had been an actual temperature drop.
I have to say that my basic reaction to these revelations is that a number of the scientists in question should be removed from any kind of editorial position or position in which their opinion or vote is involved in deciding on whether papers or ideas should be accepted for publication.
Let them continue to contribute what they choose as scientists, and let others judge whether those contributions are worthy and trustworthy. But they should no longer be in a position to judge others.
gavin compares himself to Newton
“Science doesn’t work because we’re all nice,” said Gavin A. Schmidt, a climatologist at NASA whose e-mail exchanges with colleagues over a variety of climate studies were in the cache. “Newton may have been an ass, but the theory of gravity still works.”
I just want to make the point these emails are not stolen, they were freed. The emails belong to the taxpayers of the UK. CRU refused to release them and conspired to delete emails responsive to a FOIA request. I do not know the penalty for such actions but sincerely hope it has some bite to it. I liked Comment #8 above by Peter:
BarryW (#95) makes an excellent point in noting that these researchers were atatcking the peer review process. This is totaly unacceptable. Their actions are crimes against humanity (using their rhetoric). They should be forced to resign their positions.
My opinion after spending some time reading the emails is that this is a damaging, potentially scandalous, episode. As a non-scientist I am dependent upon the scientific community to promote rigorous, non-partisan discussion of the facts. Of course, scientists are entitled to hold opinions of their own, to disagree with one another, and should be aware of the political ramifications of their findings, but they should always be primarily motivated by examination of the evidence to hand.
I think the emails show a lack of respect for debate, for the neutrality of the peer-review process and for the validity of dissent. It’s a rather startling to see the politicisation of academia and the cabals that seem to have formed. Again, as a non-scientist, I’m surprised at how purile some of the emails are, how fundamentally personalities seem to have skewed the proper functioning of science.
I’m naturally a sceptic in all things, and though I remain convinced that climate-change demands action, I’m dismayed that scientists involved seem not to regard a degreee of scepticism as at all worthwhile. It is necessary for the layman to trust in the impartiality of scientists and I’m afraid this layman finds it increasingly hard to do so.
*Published this on RC as well. I’m pretty convinced this is a leak rather than a hack. With that in mind, it will be interesting to see how this runs over the next week.
A modest proposal:
Dear Mr/Ms Politician ______________________________:
You dare spend one more cent of taxpayer money on anything related to furthering claims of AGW, or deleterious climate change, and you’re out on your ass the first possible upcoming election!
Solemnly presented and signed:
ABC
Anytown, Anywhere
“OK–thanks, I’ll just go w/ the H=62. That is an impressive number and
almost certainly higher than the vast majority of AGU Fellows.
I’ve attached the 2 page bibliography. I think it would be good to add
some some of the more prominent D&A type papers, especially those
early ones because they seem to be ahead of their time, and it is a
high profile topic (more so than hydrology!). but its your call.
Enjoy Asheville–say hi to Tom for me.
talk to you later,
mike
[4]P.Jones@xxxx wrote:
He should compare himself to Thomson, who became Lord Kelvin, who “demonstrated” with hard physics that the Earth’s age could NOT possibly be older than 100 million years and Darwin’s evolution theory could NOT be true. He also claims that “all in Physics has been discovered, only better data are needed”, and “nothing heavier than air can fly”.
Lord Kelvin used his authority to suppress dissent, his junk theories last only to his death. He was an poly-ass, and he was dead wrong.
http://drop.io/climatezip#
another site to download file from
We have heard a lot about the emails what about the data files, did the dog throw up the homework?
“He should compare himself to Thomson”
Or to that German “scientists” of the Ahnenerbe Forschungs und Lehrgemeinschaft who were used by the government to justify propaganda for the rallying of the people to support the government doing pretty much whatever it wanted to.
What I see is more of a set of “scientists” who have reached various conclusions that are leveraged by people as justification to implement various policies. Now I am not going to discuss the merits (or lack thereof) of any particular policy or another here as that is beside the point I am trying to get at. The point is that you have various people who want a certain kind of regulatory power (the regulations themselves not being important) and so they round up scientific “justification” or stand on a foundation of such “justification” as it is produced by the “scientists” and disseminated by friendly communications channels. And in this case from reading through the documents, it seems that the “scientists” themselves are quite aware of this and supportive of it and quite willing to do whatever they can to further the creation of the framework allowing their work to be used as justification for controlling practically every aspect of economics reaching right into people’s households.
For example Californians are now limited in their choices of televisions by government regulation when the construction of a single power plant would produce more energy than the regulation conserves. But if a power plant is built, there is nothing to regulate. It isn’t about the policies themselves so much as having the ability to make policy in a more abstract sense that controls what people can and can not do. If they control things, they have power. If there is no need to control something, they have less power. By creating a situation where they must regulate, they make themselves more powerful and a force that must be listened to by the captains of industry and the media. If they simply allowed a power plant to be built, there is no reason for their name to be in the newspaper.
“…hide the decline”. HIDE the decline. Well, folks, that sound you hear is the sound of all the air going out of the balloon, going out through that little four-letter word. Might as well go home now, folks: the show is over. Don’t worry about the hot dog wrappers and the peanut shells: We’ll be sending the clean-up crews through here shortly.
“…Oh somewhere in this favored land the sun is shining bright,
The band is playing somewhere, and somewhere hearts are light,
And somewhere men are laughing, and little children shout;
But there is no joy in Teamville–…”
Tacking the instrumental data unto the end of the proxy series or padding the end points with it is a deception and particularly so when this “reconstruction” allows the proxy divergence to be arm waved away.
.
Think of what the tacking/attaching/whatever does to the progression of science. It apparently alleviates what should otherwise be an urgent and diligent effort to find the cause of the divergence. From a science perspective there is no defending the tacking or the people doing the tacking.
.
I recall seeing that Rob Wilson searched the TR and density data to find exceptions to the divergence and found some or so it is claimed. The question then should be how many records where searched and how many discarded in looking for the fit.
.
What comes through in reading the general tone of the “outed” emails is that we have a consensus group of climate scientists looking to find what the consensus expects to find and not doing individual science work that lets the chips fall where they may. But that was apparent to many already from these scientists’ public statements. Under those conditions the results are not unexpected.
I have only one question now. Are the real scientist going to step forward and take the science back?
Re: Greg F (#123), the MWP is attested by documents from the time. The Team claims it was local (to Europe) – hard to disprove from documents. Some reconstructions show it – eg Craig Loehle’s paper available at http://www.ncasi.org/publications/Detail.aspx?id=3025. Craig made a point of avoiding tree-ring reconstructions, and he used the temperature estimates made by the original authors of the series he collated.
Hi Steve, longtime reader, never commented. I just wanted to tell you that I appreciate your work in climate auditing. You are doing society a service. Can’t do it now, but there is a donation going into the tip jar from me soon.
P.S. If Dr. Phil is reading this, the best way to re-establish your credibility now is to give Mr. McIntyre here the data he is asking for. Ironic, huh?
Confirmation bias is probably the practicing scientist’s biggest natural enemy in his/her conduct of their profession. Many of these e-mail exchanges clearly demonstrate that Jones, Mann, and others have fallen victim, perhaps fatally, to this enemy. Over and over, one sees a complete unwillingness to deal even-handedly and dispassionately with evidence and arguments that run counter to their desired outcome.
It seems that Tim Osborn had trouble working out uncertainty estimates in MBH too 🙂
http://www.anelegantchaos.org/cru/emails.php?eid=346&filename=1059674663.txt
Wow, this new Glasnost at RC is a breath of fresh air. Far as I can tell all comments are going through (Gavin is moderating/responding in real time). If it would actually stay like that I might even read that site again sometime.
Congrats to Mr. McIntyre again…to some degree, if true, these ‘unleashed’ emails seem to support his contentions were largely supported for a long time.
The news is spreading rapidly. My wife found the story on AOL.
There needs to be quick action by the organizations who employ these folks who have now been shown to have bent the truth. To do nothing would make it appear that all scientists distort data to provide the results that they desire. Although this does occur, most scientists do not subvert the scientific method.
Here is the second comment I posted at RC (still awaiting moderation)
I don’t know what I think about Gavin.. But he is digging himself his own hole.
OK, my guess is that SM would not even care about this, but I think he would be an excellent candidate for receiving some sort of award (or honorary PhD?) for his role in all of this. It is clear that a lot of what we are reading in those FOIA emails (I prefer to think of them in that light 😉 has to do with McIntyre’s relentless pursuit of good science. I can’t think of a more ‘pro science’ stance for some university to take up than to recognize his pursuits. Further, I would *bet* that some of the PhD contributors to CA (Hu, Jean S, Roman etc.) would vouch for his expertise (heck, serve him up a regular non-honorary degree for this!). As I explain to folks not familiar with the debate, I describe Mr. McIntyre as one of the foremost authorities on dendroclimatology (and paleo in general) in the world–who else knows the multitude of proxy sets…blemishes and all..in as much detail?
True Believer:
Can you please explain why you this is site is part of the vadst, vast right wong conspiracy ans I don’t see it? Me thinks you’re mentally disturbed.
I am becoming more and more sceptical about warming. It seems to me the observed data sets are way too small and short to extrapolate anything. As for mixing proxy data and observed, I am very surprised this is done. I’m sure my biology teacher at O Level would never have allowed such a thing in our projects.
It seems to me this climate stuff may make a very good science one day, but that currently it’s just scientists floundering around trying to get a handle on something incredibly complex.
I am increasingly convinced that CO2 has no bearing on the matter. Or even that it may contribute to global COOLING.
It seems a bit much to protest that Gavin Smirk compares himself to Newton. Do you really expect him to compare himself to Lysenko?
Someones posting graphs to show global warming and support the idea that we are all doomed.
Trick or Cheat?
All this manipulation of data reminds me of an old quote…
“If your experiment needs statistics, you ought to have done a better experiment.”–Ernest Rutherford
I believe the real irony here is that CRU wouldn’t have been compromised if they’d simply released the requested data in the first place.
From: Phil Jones
To: Tim Johns , “Folland, Chris”
Subject: Re: FW: Temperatures in 2009
Date: Mon Jan 5 16:18:24 2009
Cc: “Smith, Doug” , Tim Johns
Tim, Chris,
I hope you’re not right about the lack of warming lasting
till about 2020. I’d rather hoped to see the earlier Met Office
press release with Doug’s paper that said something like –
half the years to 2014 would exceed the warmest year currently on record, 1998!
Still a way to go before 2014.
I seem to be getting an email a week from skeptics saying
where’s the warming gone. I know the warming is on the decadal
scale, but it would be nice to wear their smug grins away.
Chris – I presume the Met Office continually monitor the weather forecasts.
Maybe because I’m in my 50s, but the language used in the forecasts seems
a bit over the top re the cold. Where I’ve been for the last 20 days (in Norfolk)
it doesn’t seem to have been as cold as the forecasts.
I’ve just submitted a paper on the UHI for London – it is 1.6 deg C for the LWC.
It comes out to 2.6 deg C for night-time minimums. The BBC forecasts has
the countryside 5-6 deg C cooler than city centres on recent nights. The paper
shows the UHI hasn’t got any worse since 1901 (based on St James Park
and Rothamsted).
Cheers
Phil
The “trick” e-mail dates from 1999: so there wouldn’t have been a real temperature decline from 1961 because, IIRC there was this super hot year in 1998.
So what exactly is the “decline” that you think he was trying to hide? It can’t be real temperature so maybe it was a non-temperature signal in the proxy data?
Re: Turboblocke (#147),
the “decline” was that of the so-called temperature proxies during the 1980s (obviously there was no proxy data up to 1998 in 1999!), leading to a downward slope at the end of the curse instead of the desired hockey-stickish uptick in accordance with the instrumental record. The jury is still out on whether this “divergence” shows a recent failure of formerly worthwhile proxies, a general ineptitude of the proxies (which would make them worthless for the purpose), or even a more correct reflection of reality than the UHI-contaminated and tweaked instrumental record.
Bishop Hill provides a short synopsis with links to some of the more interesting emails.
curse = curve
sorry
If this is your attitude, then it’s not surprising you want to play “tricks”…
From: Phil Jones
To: John Christy
Subject: This and that
” If anything, I would like to see the climate change happen,
so the science could be proved right, regardless of the consequences.”
Is it not fair that you also release 10 years of internal emails?
Re: JM (#152),
Those who use and throw strawmen into the discussions have been reduced to relying on single straws.
That’s weak, JM, extremely weak.
Persons employed by organizations which are funded by public funds do not write personal e-mails while at work. All words, each and every one, no matter what the format or media, belong to the public.
Good old Gavin:
He said “I’ll admit I’m a bit of a Schmidt
But think of the planets I save”
Steve M:
I suspect you know that man-made, CO2-induced global warming is real, and the physics of it unassailable.
I suspect you of profiting from stirring up controversy where none exists, and allowing innuendo and smear to spread and prevent much-needed action on this topic.
I suspect you of being part of a much wider conspiracy to ensure ongoing profits by ensuring inaction on this issue continues.
I suspect you of wasting public money by occupying scientists with frivolous requests, and by issuing reputational smears that must be defended in a public arena.
I have no hard and fast proof of any of this, but I suspect it all the same, because it fits my prejudices.
Surely the decent thing would be for you to release the last 12 years of your emails (both sent and received, regardless of correspondent) so that I and other anonymous people with no scientific background but a clear bias against you can trawl through them and search for any paragraph, any sentence, any stray word we can take out of context, bend or twist to fit our agenda. Anything at all. You saying worse things about Keith Briffa in private than you have in public would obviously be a smoking gun that would discredit all of your work over the last decade or so. You using the word “trick” in any context whatsoever would be proof positive of some as yet unknown heinous crime. If you decide not to do the decent thing and make this information available in the public interest, surely any reasonable person would regard someone stealing your private information as a heroic whistleblower. Even if no evidence is found for any of the above, and no reason can be made for requesting the data in the first place, the smears against your reputation that could be extracted from such a store of data would only serve the greater good.
To anyone posting sections of emails and harumphing loudly, I invite you to explain in detail exactly what you think your email shows, with references to papers where any supposed data manipulation may be found, and thus show why you think publishing stolen material is justified in this particular case.
Re: Mr. Double Standard (#155),
Rather than respecting science, you apparently subscribe to an easy believism.
There’s plenty of evidence here at CA that Steve has not profited at all from his efforts. To the contrary, it takes significant contributions of time and money from volunteers to keep this going.
The emails that have been released are in, not out, of context. The context is climate science. And the emails are not private: they are workplace emails, created on workplace time and equipment. In this case, funded by the public and therefore owned by the public.
I invite you to review the unethical and potentially criminal activities revealed by this whistleblower action, and explain why the perpetrators should not be prosecuted.
We are already seeing junior scientists asking seriously why they should enter a field where their best work will be shot down if it does not toe the “consensus” line. How can it be that editors of scientific journals are sacked for political reasons, simply because certain papers were published. That’s horrifying.
Re: MrPete (#157),
No, I employing what is sometimes referred to as “parody” to highlight the “easy believism” all too evident in many of the gloating comments here.
There is plenty of evidence that climate scientists do not profit at all from their efforts either. That doesn’t stop evidence-free snide insinuations to the contrary though, does it?
I invite you to show in detail any unethical or criminal activities. None have appeared so far, yet huge conclusions are being leapt to on the flimsiest of narrow interpretations. Perhaps this is that easy believism of which you speak? I invite you to show that this is the act of a whistleblower rather than assuming/asserting that it is on equally flimsy evidence.
Remind me again: who are the hysterical fear-mongers?
Re: Mr. Double Standard (#171),
Mr. DS — clearly you come with little understanding of the history here. This is not a denialist site, although others try to paint it as such. Comments related to policy (and religion) are completely banned. This site is about science. It also is an open site. Stay away from those (non-scientific) subjects and both proponents and opponents of any particular view are welcome.
You ask for details of any unethical etc activities. The emails themselves are sufficient. You don’t want to believe the evidence, fine. Just wait for this all to settle out. When people specifically talk about, and request, deletion of emails, that’s not a “flimsy narrow interpretation.” When people unabashedly use their position and influence to change the course of supposedly dispassionate, non-political scientific publishing and peer-review process, that’s not a “flimsy narrow interpretation.”
I realize you’re upset. I would be too in the same position! This is all going to follow through to a conclusion of some kind. Some people will lead the way, others will follow… that’s normal. So, enjoy the show. 🙂
Re: Mr. Double Standard (#171),
So Mann’s and Jones’ daily work is an unpaid good-will effort? And none of the tax dollars raised by the already extant, let alone the upcoming, CO2-capping legislation will end up anywhere else than in non-profit environmental projects? Oh, now that’s news to me…!
Re: Mr. Double Standard (#170),
Mr DoubleStandard:
I have no problem with parody. I enjoy it on “Comedy Channel”. Where significant contention already exists, however, it tends to divert attention from issues, and increase friction. Both sceptics & believers would do well to avoid parody when addressing serious issues (and trying to converse with one another, across the “great divide”), since it does not aid in understanding.
In terms of the question of profit & money, there is little doubt that Mr. McIntyre is not rewarded by outside agencies for the daily work he puts into this blog. He holds a separate day job. You appear to accept this as true, which is more than can be said of Michael Mann. Your statement, however, about the pecuniary interests of the Team scientists, is refuted by the materials provided in the information that has been released. The most obvious is the excel spreadsheet produced by Mr. Jones. He has managed to accumulate in excess of £13 million in grant money since the early 1990s. And no, I am not being so crass as to suggest he is dropping it into his back pocket. However, absent the availability of such funding, I expect he would be spending his time studying something else. Moreover, in order for this funding to continue, and for the grants to be made available, he has to be “right”. If the evidence of AGW is seen as lacking or vague, or the risks arising from it relatively insignificant, then the money will dry up. Governmental agencies set their granting priorities based on perceived importance of the issues – if the issue is not at the forefront, grant money goes elsewhere. Just ask the scientists seeking support to research cures for “orphan” diseases, or the dendros who recall trying to get funding for tree-ring studies in the 1970s. Pursuing their careers, and getting significant sums of government money to do so, is part and parcel of what they are doing. This is a powerful inducement to suppress dissentient views and to stretch and massage the evidence and data to make a more compelling case. There is evidence of both in the emails; it will be interesting to see what comes from the data that accompanied those emails when that, too, is analysed.
The impact is broader, however, than simply a question of whether Phil Jones has managed to secure yet another grant for himself and his group. When you consider that the individuals involved in these email exchanges are some of the more senior academics engaged in the study of climate, their vituperative and hostile approaches to contrary opinions and views cannot but adversely affect young scientists as well. Again, this harkens back to the question of pecuniary advantage. Any person starting out or working in a field will desire to get ahead. That is perfectly natural. If an established and influential group is acting as a gatekeeper – coordinating their efforts to ensure that negative reviews (i.e., “do not publish”) are given to papers which question the new orthodoxy – then young scientists will be influenced to conform, notwithstanding any discomfort they may have with the manner in which the manifest uncertainties that exist are being dealt with. There is ample evidence in the emails that this group arrogates to itself the right to act in this fashion – publicly denouncing contrary views, whilst quietly overlooking or ignoring similar issues in the work of their own group (although both Briffa & Wigley do PRIVATELY expound that Mann’s work from the late 1990s leaves much to be desired). If you have not found emails that evince such attitudes, then I encourage you to look a little more closely. There are a number of helpful compilations available already on various websites which will direct you to the relevant selections quickly. Eschew the summaries, of course; read the originals.
As to the ethicality of the behaviour that has been evinced by the individuals in question, I think it is fair to say that the emails show, quite clearly, that they will obstruct anyone attempting publish views contrary to their own – and do so in ways which are not in keeping with professional standards for scientific inquiry. Mr. McIntyre has pointed out on numerous occasions that this groups fails to make available its data and its methods. The emails bear this out. Indeed, they go further than that – they show a coordinated effort to avoid releasing data to individuals whose views are not consonant with their own. As a general matter, science is not advanced in this fashion. Mr. Jones, as a civil servant, should not have this option open to him. There is discussion of, among other things, coercing journals (or getting rid of their editors) to prevent contrary or objectionable views from being published. That is unethical. Mr. Jones advised compatriots to delete emails to ensure that they cannot be obtained under an FOIA (or equivalent) request (he likely now wishes he had followed his own advice). That behaviour is unethical. Mr. Jones has indicated that he will make every effort to avoid releasing data to Mr. McIntryre – “hiding”, as he puts it, behind a series of excuses and bureaucratic subterfuges. That behaviour is unethical. Mr. Jones indicated in an email to Mr. Mann, that he would rather destroy information than release it to the likes of Mr. McIntyre. Coincidentally, in response to the FOIA request for the raw temperature data, it appears that it no longer exists. First, the declared attitude is unprofessional in the extreme; and the proposal itself is illegal. Second, I am NOT suggesting, at this point, that he did destroy the data in question. However, an independent inquiry now needs to be made, given what he said.
There is more, of course: you have but to read.
To me, the question of whether this material was released as a result of a deliberate “hack” by an outsider, or by the actions of an insider, is actually irrelevant. I find it somewhat amusing that you call on Mr. McIntyre to release all of his emails – in order to prove what? Mr. McIntyre does not have the influence to gate keep the journals and is not reposed with the public obligations and responsibilities of Mr. Jones. Far better for you to call on Mr. Mann to release not his emails, but all of his data, methods and code (frankly, I consider the Team’s dirty laundry juvenile and tiresome and care not a whit about it, except to the extent that it demonstrates a concerted ill-will and intent to subvert process or results). Let us put the science to test, rather than hiding behind the obfuscatory practices so evident in the inter-Team correspondence.
Finally, you make a comment about “gloating”. And yes, that is in evidence in this and many other blogs. While unappealing whenever it arises, the Team has none to blame but themselves. Their approach has been arrogant and arrogance begets that response when it is so starkly revealed. If the shoe were on the other foot – and if it was email from Richard Lindzen or John Christy, and it showed similar behaviour on the other side of the fence – the RealClimate types would be wallowing in it in the same way, drawing the same conclusions, saying the same things. Such is life.
It will be interesting now to see if the data that was released is even more revealing than the email. It should make for an interesting week ahead.
Re: Ian (#213), I am sure this blog can do without the clutter of “me too, well said” posts. But I cannot resist.
Ian, that post is simply outstanding. It deserves to be published in the mainstream media, where it would do more to explain to the general public the essence of this issue than much of what has been written and said so far. Well done, sir!
Re: Mr. Double Standard (#155),
I suspect you don’t know the difference between ‘public’ and ‘private.’
Re: Turboblocke (#156),
If you’re not a Team member already, you should apply for membership. You’ve got the mind-set nailed.
Here’s a project for you- prove there is no divergence in any proxy reconstruction of the MWP.
Re: Mr. Double Standard (#155),
Well, for starters you might notice the head post by Jean S. at the top of this thread that explains the “Mike’s Nature Trick” e-mail. I believe it shows quite clearly what was done with the data and what effect it had.
Do you think the public has a right to know how these highly-publicized graphs are generated? Or do you think Mann and his associates have a right to make such “alterations” and keep secret what they did? I think the second notion is completely indefensible — but I’d love to hear your justification if you disagree.
: Chris at 148: the modern upward tick of the hockey stick is there for all to see in the empirical temperature measurement from thermometers. All Jones did was create a plot that replaced unreliable data with accurate data. The divergence problem of proxies is:/was published so he wasn’t doing anything nefarious. What would you say about him if he had published the plot with the obviously wrong data from the proxies? He would be a laughing stock for claiming that his proxies were more accurate than thermometers.
The reson that we have a timeline of temperature that goes back so far in time is because we do splice different proxies to the empirical measurements from thermometers. And different proxies take over when other ones are unreliabale or missing.
You also refer to the “tweaked” instrument record: are you aware that if you take into account their different baseline years (GISStemp being earlier so starting at lower temperatures, then CRU and UAH/RSS)then the 4 indices show pretty much the same anomaly? Check it out on the infopage of woodfortrees.org
Re: Turboblocke (#156),
Your reasoning sounds logical on the surface. Yet you are wrong.
Proxies and the underlying data they’re supposedly proxies for cannot be merged.
Otherwise, all kinds of invalid statistical correlations would be believed. You can read about this here or elsewhere. Some of these invalid correlations are rather famous.
How do you know the proxy data is “obviously wrong”? Proxies must be proven to be correct. They can’t be assumed to be correct.
Re: MrPete (#159),
Especially as convincing and properly quantified physical explanations for the reasons this or that natural phenomena is a “temperature proxy” are too often shaky or simply lacking. There is no formula to exactly convert e.g. millimeters of tree-ringwidth to degrees Celsius.
Data that describes something very different from temperature, e.g. growth of trees or deposition of sediments, is declared a “proxy” mainly because its variations are more-or-less “in sync” with actual temperature measurements during the 19th and 20th centuries. Correlation to a degree is made to stand-in for causation, which is of course proverbial “thin ice” to begin with, and when this correlation fails after a very limited time period (aka divergence), one cannot claim it is reliable for past ages where we have no instrumental record to counter-check, nor extra data to perform “Nature tricks” by “filling in” periods of divergence?
I know that I’m regurgitating what has been said here and elsewhere a million times, but it looks like many of our kind readers need to be reminded of these simple facts time and again. As P. K. Dick said: “Reality is that which, when you stop believing in it, doesn’t go away”. And proxies do not become more reliable by ignoring or downplaying that they are not.
Re: Turboblocke (#156),
Would that commonly be referred to as a “splice”?
Re: John M (#160),
Sweet.
Re: Turboblocke (#156), Re: Turboblocke (#156),
Turboblocke, how do you know your proxies are reliable for he previous time period? That they ‘diverge’ suggests maybe they diverged before. By your logic, I could take stamp prices, then tack on the temperature record. Of course in that case, the stamp prices show a hockey stick on their own.
If there was nothing to hide, why was it hidden?
So is there any evidence that “trick” is used regularly in the context they are claiming? It seems like they should be able to point to numerous examples if that were the case. I remember talking things like “methods” with professors when I did my grad research, but I don’t think I ever used or heard the word “trick.”
And there was certainly no freaking way I could/would intentionally “hide the decline” of any trend, data, etc. That would be highly unethical.
Excerpt from [1255558867.txt]
At the risk of overload, here are some notes of mine on the
recent
lack of warming. I look at this in two ways. The first is to
look at
the difference between the observed and expected anthropogenic
trend relative to the pdf for unforced variability. The second
is to remove ENSO, volcanoes and TSI variations from the
observed data.
Both methods show that what we are seeing is not unusual. The
second
method leaves a significant warming over the past decade.
These sums complement Kevin’s energy work.
Kevin says … “The fact is that we can’t account for the lack
of warming at the moment and it is a travesty that we can’t”. I
do not
agree with this.
[End Excerpt]
I’ve noticed “Trick” on RC explained as a method. Are these two “tricks” to bring the models prediction in line with observation? I asked Gavin how he could state there would have been cooling in the last 40 years due to natural drivers, and he pointed me to the observations that are mentioned in this email. I find it odd that they remove certain observed data to preserve the models prediction. This whole exchange is quite fascinating. I’ve brought this up on RC but have been “in moderation” for the last 15 hours. I do agree with the final reply by Tom in this exchange in file #1255553034.txt (Has anybody read this whole exchange?):
Gavin,
I just think that you need to be up front with uncertainties
and the possibility of compensating errors.
Tom.
I find interesting the defenses for grafting, by whatever means, direct or indirect, onto the end of the proxy series and apparently in the process being blind to seeing that if a proxy does not respond (correctly) to the instrumental records that that implies a fundamental problem with the proxy (in those past times where no instrumental data is available for calibration/verification) that needs explaining before any meaningful conclusions can be drawn from the proxy results. The grafting operation is, in effect, a way of deceptively making that problem go away or at least an attempt to get it out of the main line of criticism and/or view for the less informed. Cutting undesirable proxy data from the end of the series and replacing it with instrumental data is wrong, wrong, wrong – even if one can see the red showing through on the published graphs – which one cannot always.
.
So when otherwise seemingly intelligent people use their defenses what is the under lying problem: Are they really not so intelligent or are they overwhelmed with the need to get the AGW message out.
.
And thanks to Jean S for pointing to this important (mis)concept(ion) and explaining it in detail.
Re: Kenneth Fritsch (#168),
That’s got it. Mann was on a PR mission to remove all red flags (all sources of contrarian talking points) from the science. Including confidence intervals – which is direct proof of uncertainty.
What a reaction to the alleged disclosure of E-mails and other data from the University of East Anglia’s Climate Research Unit! This information has been flying around the Internet since 19th and if genuine potentially blows the lid off the all of the propaganda that has been promulgated about The (significant human-made global climate change) Hypothesis. Despite this there apparently has not been a word from yourselves, any political party member or broadcaster about it. This has much more significance than what today’s celebrities had for breakfast. Why no news coverage or political reaction?
In an article on this subject in the UK’s Daily Telegraph (Note 1) mention is made of John Daly. It says QUOTE: One of the alleged emails has a gentle gloat over the death in 2004 of John L Daly (one of the first climate change sceptics, founder of the Still Waiting For Greenhouse site), commenting: “In an odd way this is cheering news.” UNQUOTE. This alleged E-mail is presented more fully elsewhere (Note 2).
It is important to remain sceptical about the validity of this “leak” of information and await the results of a thorough investigation. (Is anyone in the news media doing something along these lines?). Despite this, there is a saying “there’s no smoke without fire”. It is interesting to see that there appeared to be an exchange of E-mails between John Daly and Phil Jones back in 2001 (Note 3). This item starts with QUOTE: After several requests by visitors to this website for details of the two emails which were sent by Phil Jones of CRU, demanding withdrawal of the articles about recent errors in CRU hemispheric temperatures, the following exchange of emails was made via a very large CC (110 addressees), with both of Jones’ emails signed in his official capacity as professor at CRU. UNQUOTE. It is followed by an apparent exchange of E-mails between John Daly and Phil Jones.
I leave you to read them and draw your own conclusions. While you’re at it, have a read of the comments at Wattsupwiththat (Note 2). There are some interesting comments about that site favoured by supporters of The (significant human-made global climate change) Hypothesis, Realclimate (Note 4). It leads off with an article spinning the motivations behind what appears in the E-mails followed by some uncharacteristic defensive responses to readers’ comments by Gavin Schmidt.
NOTES:
1) see http://blogs.telegraph.co.uk/news/jamesdelingpole/100017393/climategate-the-final-nail-in-the-coffin-of-anthropogenic-global-warming/
2) see http://wattsupwiththat.com/2009/11/19/breaking-news-story-hadley-cru-has-apparently-been-hacked-hundreds-of-files-released/
3) see http://www.john-daly.com/cru/emails.htm
4) see http://www.realclimate.org/index.php/archives/2009/11/the-cru-hack/comment-page-10/
Pete Ridley, human-made global climate change agnos(cep)tic
Here is how Mann justifies “hide the decline”:
From WaPo
Re: Molon Labe (#175),
All I can say is LOL. He has no shame after what we read in the emails.
Re: Molon Labe (#175),
Mike’s explenation is not compatible with Jones’ first comment, nor with “group’s” version in RC
nor with Jones’ new recollection
How many versions are they going to produce before realizing that it would be easiest to them to say simply “go to ClimateAudit, it’s all explained there” 😉
Keith Briffa’s description of sources and splicing data — including deliberately omitting the early part of the 20th century because it didn’t fit his instrumental record.
From
http://www.anelegantchaos.org/cru/emails.php?eid=558&filename=1121893120.txt
Perhaps a post title of “Bazaar Calibration” would be appropriate.
===|==============/ Level Head
Re: Level_Head (#177),
yes,
ftp://ftp.ncdc.noaa.gov/pub/data/paleo/gcmoutput/crowley2000/crowley_lowery2000_nht.txt
Repetitio mater studiorum est:
Steve,
I posted several comments on Andy Revkin’s blog including this one:
It might be interesting to have a thread here on how to best undo the damage done to science by this cabal at CRU. I have presented a few ideas here but am certain others can come up with a better list. Will you open it up for discussion?
So the divergence problem isn’t just in recent decades, or the entire post-1961 from Briffa…it’s also 1900-1920. But we have confidence in using those proxies prior to 1900, too?
I am on the editorial board of a journal which published a paper about both climate and an endangered species, presenting a skeptical viewpoint. A scientist whose work was criticised in that paper went to the press and we got 2 calls from journalists who asked why we didn’t censor the skeptical paper. I gave the one I talked to a piece of my mind, that journals should not censor unpopular views, which he actually printed (in shortened form). Then the criticized scientist sent a reply to the article in which he really threatened the editorial board if we did not publish his (really sloppy) reply.
By the way, Gavin’s comparison with Newton is funny because Newton tried to (and mostly did) ruin the career of a competitor who also thought of the idea of calculus (Liebnitz?). Great example.
Re: frequent poster (#182),
And there’s more:
Newton’s final achievement in the brawl with Leibniz was to set back science in England for over a century, as Laplace, Lagrange, and finally Euler walked through the doors opened by Leibniz’s far superior notation.
I had a professor comment on my blog. The spin is that even without the CRU data global warming is proved by this and this and this etc. I pretty much blew him off in reply. I don’t really care to take much time with someone who references realclimate on their website as if that is a good thing.
Re: Mark (#183), There really is no point trying to disprove GW, it is pretty much a given fact that the globe has warmed over the past 100 years (give or take some inaccuracy, man-made or otherwise). The $1,000,000 question is “How much of that was from CO2, how much of that was from other man-made sources and how much was natural?”.
.
There seems to be a general assumption that if warming/climate change took/is taking place, it’s all CO2!
Re: DaveJR (#188),
I agree. I just didn’t care to even take the time to explain that to the professor. Also, how does the warming compare to early times before man’s industrial age is part of the debate.
I wonder how common it is to create extra data — here, 150 years of it — by simply mirroring later data. This is in the Medieval Warm Period.
http://www.anelegantchaos.org/cru/emails.php?eid=608&filename=1137686657.txt
 
Another aspect of this is intriguing to me: Albedo changes seem to be not well defined in the world of proxies — but in the above email there’s an arbitrary factor of 0.7 for albedo. Albedo changes several percent with about a 20 year cycle according to this:
Click to access Palle_etal_2006_EOS.pdf
 
It is my understanding that Mr. McIntyre is thinking about water vapor changes, which is an “elephant in the room” of forcings. It seems to me that albedo changes may be even a larger elephant.
 
Can forcing discussions ignore these two big bull elephants? That’s perhaps a lot of bull.
 
===|==============/ Level Head
I’ve been following this blog for about three years (off and on) and I’d like to say I appreciate what you all are doing. To be honest I don’t always understand what you guys talk about. I get the major thrust, but the specifics sometimes elude me (due to a lack of a science education, which is being rectified). (I also look at RC and several other sites)
What’s been very interesting to see is the openness on the skeptic side of the debate. Skeptics challenge the science and methodology, while the proponents challenge the skeptics on a personal basis. This can be clearly seen on sites like RC. In my mind this calls for increased skepticism. (Contrary to the impression, RC is NOT allowing all comments through. My two didn’t make it through the censor)
At any rate, that’s my two cents.
As a layman (not a climate scientist) who is involved in public policy, I offer some thoughts re this whole topic, from the POV of making major policy decisions such as environmental regulation and taxation:
1. The data sucks. Totally inadequate to support trillion-dollar decisions. Plus, much of what there is has apparently been corrupted, maybe intentionally, and scientists are now seen to have seriously discussed (and known to have claimed) loss of data rather than making it available for others.
2. The analysis sucks. The models are WAY inadequate, their predictive power is so low even using agenda-corrupted data, that claims to making trillion-dollar decisionn should be laughed out of the room.
3. Many of the leading lights of the field are now shown to be at best dishonest. At best. If they were dishonest about the range of things we see, not only in these emails but in other ways (some of which Dr. McIntyre has previously shown), why should we trust them on ANYTHING?
Conclusion: From the perspective of public policy, this whole field has to just about start over, with raw data, not the unreliable datasets that have been “adjusted” for the last 20 years. The raw data has to be analyzed by new players who do not share the deceitful history of the ones we see in these emails; any adjustments need to be discussed openly and ony applied after the most careful and rigorous debate. And some serious standards for new data need to be developed and applied (e.g., locations of monitoring stations)
Simultaneously, the models need to be re-looked as to all their code and the parameters and algorithms embodied, to confirm they are based on sound science rather than constructed with a result in mind. Anything less leaves them suspect.
Then, the data and the models need to be brought together and real work can begin, by qualified scientists untainted by past shenanigans.
I figure it will take about 5 years and maybe $1-2B to get this whole field on some sort of track where it might begin to produce useful results.
Re: Marty (#189),
As “bender” and others have pointed out, confirmation bias is all-pervasive among the current crop of climate science practitioners, for a variety of interacting reasons.
.
Is there any reason to believe that after having spent another two billion dollars on this effort, we wouldn’t have yet another repetition of “the process becoming the product”?
About the fuss concerning the terms “trick” and “to hide’:
The unabridged Webster gives under (3) the following definitions of “trick”:”A quick or effective way of getting a result”; “the art of doing something quickly, effectively, skillfully”; “instant or skillful effecting of a result as, that does the trick”; “a feat demanding skill or ingenuity”.
The divergence is well known. Since Briffa et al. always seem to have recommended to leave out the post 1960 part of their reconstruction Jones merely seems to have proposed to follow publicly given advice with the term “to hide”.
Re: Arie Brand (#193),
By all means, I would like you to explain exactly what was “quick”, “effective” or “skillful” or damanding “skill or ingenuity” in the procedure of tacking on of an apple temperature plot to the orange reconstuction.
Try definition (1):
Scott Brim @ 192
Assurance only to the extent that everything would be done in the open… the original datasets and models published and than all new data and all adjustments or modifications discussed, defined and implemented openly, with data shared and rsults independently replicated.
At least then there’s a chance there would either be some honest people involved who would call out any foul play, or at least those who might be tempted would fear discovery.
Since I’m not a climate scientist, please take my 5 yrs and $1-2B estimate with a huge grain of salt… but, fixing this will be neither quick nor cheap.
Much of the current crop needs to spend the next decade defending themselves before investigators and prosecutors, of course… in the USA, 18 U.S.C 1001 comes to mind, for starters. Not that Holder would do so, willingly, but given the amount of grant money and potentially perjured Congressional testimony, this cries out for the FBI to get involved.
Certainly. No one is damn fool enough to take payola. Not directly. In terms of popular attention, book sales, interviews, having one’s work referenced by political movers and shakers, justifications for grants, and the self-righteous satisfaction which comes from a crusade to “save the world,” it’s hard to beat AGW.
But I don’t think anyone regards Mann et alia as consciously adopting a cynical “I don’t mind torpedoing the world economy and sending millions to starvation so long as I can get my graph in Al Gore’s movie” kind of attitude.
Rather, what we have here is a mania, much like the Salem witch trials, except that it has occurred during an age of global communication which allows the infection to easily spread rather than being geographically confined, and it is founded on the assumptions and indeed the popular religion, of today’s intellectually inbred academic community, rather than the intellectually inbred assumptions of the popular religion of colonial Massachusetts.
In twenty years — perhaps as little as ten — we’ll be looking back with shaking heads at this, as we look back at the “are we entering another ice age” speculations of a quarter-century earlier. Or perhaps the UFO mania of the 70’s and the Satanic cult scares of the 80’s are a better analogy.
.
Honestly, R.C., these are roughly the same thing, right?
fordprefect @ 186
source of data? how, exactly, is it defined? How was it collected? how was it adjusted or corrected? by whom, using what criteria and procedures? Is all that documented somewhere open to public inspection? You can vouch for the sources and techniques?
Why do you use 10-yr moving averages? You lose 90% of the data doing that. Cherry-picking start and end dates combined with cherry-picking the rolling period allows no end of manipulation in the appearance of the chart.
I just want to know what, exactly, you’re asking me to look at.
Re: Marty (#200),

Data is from
http://www.metoffice.gov.uk/climatechange/science/monitoring/CR_data/Daily/HadCET_act.txt
There is a report how this has been compiled search the met office site
Other UK data from:
http://www.metoffice.gov.uk/climate/uk/stationdata/
no adjustments
CET with no averaging:
The 36 period excel moving average is not synchronous with date
Original plots average is in sync. the plots automatically truncate at 1/2 the averaging period from either end of plot
These are ridiculous comparisons. The ‘ice age speculations’ were mainly limited to the popular press and hardly got a foothold in the professional journals. The UFO mania and the satanic cult did not even make in the quality popular press.
R.C. @ 198
OT, but–One of my cousins was almost Ground Zero for the satanic cult business in the 1980s. We (family) all thought he was nuts, only later did we learn how nuts he was and how much damage he did.
Genesis. The Rosetta Stone. Look at the spin–I thought it must have been PR outfit coaching, but they are naturals. From 2000
http://www.anelegantchaos.org/cru/emails.php?eid=178&filename=966015630.txt
A good faith interpretation would, in the first instance, look at a meaning that presupposes a good faith disposition of the original author. In this case Jones seemed to follow Briffa et al’s public advice not to use their post-1960 proxy results, as a ‘quick’ and ‘effective’ way to deal with this particular problem.
thefordprefect @ 206
Thanks. I grabbed the data table and also found a report from ca. 1992 that explained the data up to that point. Haven’t had time to really digest it (and probably won’t). The dataset appears quite spotty, but the best one could expect over the time period. I did plot the annual, January and July temps. fwiw, which is probably not much, Julys are only a little warmer over the 350 years (about 0.4 degrees), most of the annual warming of about 2 degrees appears to be in Winters (Januarys, more than 3 degrees), and most of that change is due to fewer cold Januarys, more than there being many really warm ones. Obviously, very simple-minded look at the data, but it’s hard to get worked up over 0.4 degrees in 350 years, with slight acceleration post-1980, where most of the increase is due to fewer abnormally cold winters (i.e., climate just more moderate), rather than, say, many broiling hot summers.
Just some observations, not pretending to anything deep. Thanks, again, for the link.
I’ve started a thread over at RC about this issue about if they added a instrumental data set to the proxy, and so far, I wasn’t censored out. We’ll see. One question I have, however, are the true implications of this. Assuming the allegations above are proven true, what does that actually do the AGW theory? I don’t see a conspiracy to profoundly change data or fake it in all the emails. What it does seem like is that they tweaked things a bit to make it look better. That is more of an Al Gore move than a scientists move
I asked on RC a simple question about splicing data onto a Proxy. Gavin answered me. I’m still trying to figure it out, but I wanted to share the question and answer here to see what people thought:
The full question and answer are located at 1068 of
http://www.realclimate.org/index.php/archives/2009/11/the-cru-hack/comment-page-22/#comment-143641
The answer reads:
Thanks,
Leonard
Re: Leonard Herchen (#214),
Unprecedented! Gavin is allowing direct links to CA! 🙂
Let’ see:
See here.
No-one aware even the subject is “Diagram for WMO Statement”? Is Gavin saying that Mann didn’t read or didn’t understand the e-mail?
Then, Gavin, how about addressing this one.
Re: Arie Brand (#212),
Just how then, to include/exclude individual samples from earlier times where no instrumental records exist to act as a control ?
A couple of letters on this topic were published today in Australia’s national paper, The Australian. For many years the authors were, respectively, Deputy Secretary (Economics) of the Australian Treasury and head of Australia’s National Climate Centre. Herewith, slightly edited::
Your editorial “Never mind the science, just watch the politics” (21-22/11) argues that “the politics of climate change are clear”—the Coalition will likely be “smashed” at the next election if it fails to support leader Malcolm Turnbull and tries “to reverse the widespread public belief that global warming is man-made”.
An alternative interpretation would recognise three things: …
Third, the man-made global warming thesis is majority supported because the case against it has not been put at the political level.
Were the Coalition to now publicly identify the many problems with the thesis, and offer the readily available alternative approaches, its prospects at the next election would be greatly enhanced.
The revelation that an Intergovernmental Panel on Climate Change lead author has been manipulating temperature data published by the Hadley Centre provides the Coalition an opportunity to expose the flawed science used by the IPCC.
Des Moore, director, Institute for Private Enterprise, South Yarra, Vic
[Your editorial] suggests that the politics of the government’s carbon pollution reduction scheme are so compelling that the underpinning science is irrelevant.
Surely public policy needs to be evidence-based.
The debate is over whether anthropogenic carbon dioxide emissions will be dangerous against a background of natural climate change.
Get the science right. Do not deny the geophysical record; treat the implausible projections from inadequate computer models with the scepticism they deserve.
The alternative is very bad faith-based public policy.
William Kininmonth, Kew, Vic
I’ve submitted the following for tomorrow’s paper:
For many years a number of serious statisticians and climatologists have expressed concerns that those researchers and modelers on whose work the IPCC’s anthropogenic global warming case depends have bolstered their case through massaging data and concealing contrary evidence. You briefly report evidence of this revealed through the hacking of e-mails between leading AGW proponents such as Phil Jones and Mike Mann (“Hackers expose climate brawl,” 23/11). Many of the e-mails in question have been posted on sites such as http://www.climateaudit.org. It appears from the response of those quoted that the e-mails are in fact genuine, and it appears from their content that the sceptics’ concerns as to the integrity of AGW research have been demonstrated. It is therefore imperative that the Australian government institute a full inquiry into the alleged global warming science before committing us to costly and distortionary anti-warming policies.
Hey, Faustino, the Austrralian has zero credibility on this issue – and I don’t think that the testimony of a champion for private enterprise will make a deep impression either.
Re: Arie Brand (#217),
…but obviously, private enterprise has been, throughout human history, the only way of developing and achieving things. Why? People don’t cheat themselves as easily as they cheat others (unless they’re mental) – they might tell others about their perpetual motion machines to trick them out of their money, but if they need energy for their own daily life, they’ll rather fall back onto something that really works. The present situation has been brought about by too little private enterprise if anything – the very system of science being financed by grants from third parties is (very naturally) followed by “scientists” tricking these third parties into giving grants by piping along with their tune. Science should be done ONLY by those who, like our host here, follow their own curiosity and their inner desire to learn about things; those that earn their living by “doing science” should ALWAYS and AUTOMATICALLY be suspect and taken less seriously.
Arie (#213), The Australian as a journal (though not all of its contributors) accepts the AGW hypothesis. Is that why you rate its credibility zero? I suspect not. And Des Moore’s support for private enterprise arises from about 30 years as a senior economic policy adviser to Australian governments. Having been a SEPA to UK, Australian and State governments myself – mainly advising bodies chaired by Prime Ministers or advising state premiers and senior ministers – I share Des’s support for less government, more private enterprise. [I know this is a “get-the-facts-right, non-policy” site, I hope this doesn’t overstep the mark.] FYI, I was briefed on AGW by the IPCC’s head scientist and deputy around 1990, and have followed the debate since, including providing cabinet briefs and directing modelling of the economic inmpacts of various emission reduction scenarios.
“how would I react if Enron or AIG executives (or for that matter the execs from any large corporation) had written emails like this”
Have you seen 10 years worth of Enron or AIG executives?
Thought not. But the Enron emails we have seen proved that they deliberately manufactured the electricity blackouts in California in the 90s to make money. Phil Jones not wanting to deliver all of his research materials to hostile non-scientists is maybe not quite on that level.
In any case, I now look forward to seeing all of McIntyre’s email correspondence since 1996. I would be particularly interested in any emails from oil companies regarding the funding of his anti-climate change activities. In the interests of transparency, of course.
Re: jontie (#220),
LOL! You’re too funny. Steve’s not anti-climate change so your quest fails right there. Steve’s pro-science, pro-transparency, pro-good process.
You picked the wrong example to compare with Enron. It isn’t the failure to disclose data. It’s the deliberate biasing of peer review journal publishing, to promote their point of view. And the corruption of the FOI process.
Failure to disclose data to a “dangerous” statistician who can out them is only a symptom.
Imagine if the shoe were on the other foot. If “denialists” were corrupting the scientific and legal process like this, you’d be up in arms.
Every hour people try to defend such unethical behavior speaks volumes about their lack of concern for good science.
I find it fascinating how people love to speak of civil disobedience, when such actions support their perspective. But they get up in arms when the same activities reveal their own heroes as unethical power brokers.
Re: MrPete (#221),
OK, to be more precise, could Steve release all of his emails correspondence from his decade long pro-science quest? In particular those from oil interests, which I’m sure are as pro-science as he is?
So, let’s see them! I assume, given the self-righteous tone, he has far less to hide than CRU and would be happy to share it all with us?
Oh, and none of that crap about CRU being a public body please, any organization, publicly funded or not, has a right to deliberate in private, whether over email or in meetings.
Re: jontie (#229),
even if it were true (which I am rather certain it is not, not least because of the obviously too-small-scale server his site relies on) – why are “big oil” any worse for funding science than “big government”? At the very least, “big oil” provides EVERY ONE of us (yes, you too) with reliable and omnipresent sources for fuel and other forms of energy, which is something we silently are all thankful for. You would not be able to send or read anything here without an internet powered by, and a computer produced with materials provided by “big oil” related companies. They produce useful things and earn money for it. I call that honest. In contrast, what good has “big government” ever done? Restrict what intelligent and resourceful people can legally do, even performs legal robbery on those who have enough sense of decency to earn their own living, to subsidize all sorts of lazy bums. I call that DIShonest.
Re: jontie (#229),
Again the call for Mr. McIntyre to release his emails. Quite amusing, really, and a total non sequitar. Jones has a legal obligation to produce his emails under UK law, in response to a properly formulated FOI or Data Protection Act request. The emails are not “personal” – a point that is made quite clearly on the UEA website in directions to their staff. This obligation arises because he is in a government paid position, reposed with all of the obligations, responsibilities and trust that accompanies that role. To pretend that this doesn’t matter – well, let’s say it is at least consistent with the attitudes demonstrated in Mr. Jones’ emails as well, and his willingness to contemplate data destruction and to counsel others to delete email, and his penchant for “hiding” (as he calls it) behind a series of thin excuses to avoid releasing data to individuals whose views are not consonant with his own.
As I noted in my reply to Mr. Double Standard above, better to call on Michael Mann to release, not his email, but his data, his methods and his code, so that the conclusions he has published can properly and fully be reviewed. While Mr. McIntyre has been the most successful at publicly raising concerns about Mr. Mann’s work, the released emails show that others in the Team share a number of his concerns.
Just noticed this:
That’s false.
In the USA (with which I am familiar), after Sarbanes-Oxley, 100% of all written communications are legally discoverable. See sections 801, 802, 1102 etc of SOX. That’s why these records are now retained.
Email you send or receive using workplace resources is not private. You don’t own it, your company does. And in a lawsuit, everything can be discoverable. Lots of people never have heard of this… and are quite surprised when the lawyers troop in.
Whistleblower laws provide further protection against corporate malfeasance.
AFAIK, there’s no such thing as whistleblower protection for someone who steals from a private citizen. But an inside person who releases data from a corporation is protected.
The same is true
Faustino (216, 219)well, for all I know your credentials might be impressive – but that doesn’t automatically make your case that the proponents of the global warming thesis have been “massaging data and concealing contrary evidence”. In fact I haven’t seen anybody making that case yet, in spite of a lot of huffing and puffing about certain words, in the emails of quite a limited number of people, for which rather different interpretations are possible.
As to the Australian: there might have been some editorial in it supporting the global warming thesis, as there recently was in the National Post, but a paper is not judged by that. Over the years it has serviced as a ready venue for various denialists as has, indeed, the National Post.
Their performance has cost the paper credibility on this issue.
As to the latest ‘revelations’: I think that the governmental bigwigs who have to deal with this matter are by now inured to denialist theatricals.
Re: Arie Brand (#222),
Others might call this well-balanced, presenting both sides of the debate (as it has been standard since the Romans laid the foundation stones for the laws used by democratic countries today…)
Colleague of mine (Univ. Helsinki, Finland) pointed out that in file at:
ftp://ftp.ncdc.noaa.gov/pub/data/ghcn/v2/v2.mean.Z
one can find hilarious stations like:
– “Pello” station (WMO-koodi 02844) data from November 1801 onwards…
– “Helsinki/Seutula” station data from 1829 onwards…
What’s so hilarious? Well one would have to be a Finn to understand but I’m quite sure that these two are hoax. The Pello station for example became operational in September 2000…
Question: how do I open the .Z file for more fun?
[Jean S: Urkki is alive! 😉 Although GHCN-data is interesting, and it has been covered few times over CA, it has nothing to do with “Mike’s Nature Trick”. So, post these kind of things under “Unthreaded“, kiitti! (GHCN is combining series from different locations, so Helsinki/Seutula is actually a combination of Helsinki/Kaisaniemi and Helsinki/Vantaa)]
FYI, here’s part of an article in today’s (23/11) Times by former senior minister Nigel Lawson, who seems to have similar views to me:
“Astonishingly, what appears, at least at first blush, to have emerged is that (a) the scientists have been manipulating the raw temperature figures to show a relentlessly rising global warming trend; (b) they have consistently refused outsiders access to the raw data; (c) the scientists have been trying to avoid freedom of information requests; and (d) they have been discussing ways to prevent papers by dissenting scientists being published in learned journals.
There may be a perfectly innocent explanation. But what is clear is that the integrity of the scientific evidence on which not merely the British Government, but other countries, too, through the Intergovernmental Panel on Climate Change, claim to base far-reaching and hugely expensive policy decisions, has been called into question. And the reputation of British science has been seriously tarnished. A high-level independent inquiry must be set up without delay.
It is against all this background that I am announcing today the launch of a new high-powered all-party (and non-party) think-tank, the Global Warming Policy Foundation (www.thegwpf.org), which I hope may mark a turning-point in the political and public debate on the important issue of global warming policy. At the very least, open and reasoned debate on this issue cannot be anything but healthy.”
So we may get a fresh look at the data and science from outside the Mann-Jones clique.
On media coverage: the UK’s Guardian printed version on Saturday 21st Nov had this tucked away on an inside page:
http://www.guardian.co.uk/environment/2009/nov/20/climate-sceptics-hackers-leaked-emails
(Looks like it went online on the Friday evening)
In that online version there is a link to a comment from Bob Ward:
http://www.guardian.co.uk/environment/2009/nov/20/climate-sceptics-email-hacking
Some interesting comments to the Ward piece from readers below.
However, the printed Observer (sister paper) on Sunday 22nd had nothing that I could see and neither does today’s printed Guardian, Monday 23rd Nov.
Curious; I can think of at least two of their regular columnists who might have been expected to react to this (and not in a way friendly to sceptics).
Regards,
Mike
[non-scientist; hopefully scientifically-literate open-minded sceptic]
only thing to say in all this is –
thanks and many thanks to the hackers,
i hope ppl now will see these things more clearly,
and hopefully some real scientists would take up the work to really clear the issue,
and plz fire these scientific fanatics, i cd as well call them scientific terrorists.
I gave a follow up question to Gavin, as follows:
On comment 1081 at
http://www.realclimate.org/index.php/archives/2009/11/the-cru-hack/comment-page-22/#comment-143623
In his response he references Figure 6.10 from AR4
The link to 6-10 is at:
So, where is the graph where this alleged grafting can be seen?
Leonard
In any case, I now look forward to seeing all of McIntyre’s email correspondence since 1996. I would be particularly interested in any emails from oil companies regarding the funding of his anti-climate change activities. In the interests of transparency, of course.
Spoken like a true ignoramus. You might want to look up Steve’s actual views on AGW before imposing your assumed views onto him.
As to the latest ‘revelations’: I think that the governmental bigwigs who have to deal with this matter are by now inured to denialist theatricals.
Nice, more slander and idiocy. Yes, we all know that AGW is immune to any criticism, it has always been a ready excuse to increase taxes and government control, facts be damned.
More cognitive dissonance. Steve has always and ever only argued facts. He didn’t ask for those emails to be leaked, all he has ever asked for is data.
You think Climate Audit is funded by outside sources? Really? Have you been paying attention to the site’s server performance over the past few days? Seems the big oil money he gets isn’t enough to cover basic web hosting costs.
And finally you’d like us to pretend FOIA laws don’t exists for publicly funded organizations, that if they do exist they should be ignored and that a private individual should be held to them. How you make any sense to yourself is beyond me.
So Gavin now claims that “trick” means “a good way to deal with a problem.” That’s odd. Back in a November 9, 2006 post entitled “Cuckoo Science” criticizing Christopher Moncton, “trick” meant “absurdities that occasionally pass for serious ‘science’ on the web and in the media” and “concepts are being mangled, logic is being thrown to the winds, and completetly unjustified conclusions are being drawn.”
Gavin said in November 2006 that:
See http://www.realclimate.org/index.php/archives/2006/11/cuckoo-science/
Re: Terry (#233),
It’s amazing how diligent they are when it comes to finding the “absurdities that occasionally pass for serious ‘science’ on the web and in the media”, yet they have NEVER cast a critical eye any Team paper. If they can see the weaknesses in others, how can they POSSIBLY fail to see the cracks in their own stuff?
This all goes back to their statement – “Why should we give you our data when you’re only trying to find something wrong with it?”
Quick answer – “We found faults with your papers WITHOUT the data. And we found BIGGER faults when we did get the data.”
Nice summary 30 minutes ago in the WSJ, which seems to be the only major paper in the world reporting on this in a serious manner:
.
http://online.wsj.com/article/SB10001424052748704888404574547730924988354.html?mod=googlenews_wsj
Re: NW (#235), That WSJ article is nice and to the point. 😉 Thanks for the tip.
http://www.uea.ac.uk/mac/comm/media/press/2009/nov/homepagenews/CRU-update
Yesterday UEA posted a bulletin about the hack which included an attempt by Prof Jones to “clarify” the Mike’s trick email.
So this is quite clearly grafting one dataset onto another one and showing it as one continuous green line. Even the wording of this statement is deceiving. The green line is Briffa (1999) tree ring reconstruction. It does not “include” proxy data it IS proxy data. Proxy data that went to 1980 but was cropped at 1960 when it went the wrong way. So it is “only” proxy data 1960. The weighted mean blends the two together around that date to you don’t see the GRAFT.
The fact that these data are from totally incompatible sources : tree rings and the actual temperature record plus the fact that this “trick” makes a declining temperature into a steeply rising one makes this more than just bad practice it is clear, willful deception.
Today all of the part from Jones has been deleted. It seems they realised how incriminating it was!
Anyone wanting to review what Jones’ statement was before UEA realised it said ” I did not have sex with that graft” , try google:
http://www.google.com/search?q=%22only+actual+temperatures+from+1961+onwards%22&hl=en&filter=0
for example:
http://blogs.dailymail.com/donsurber/archives/4244
keep digging Prof, that hole’s looking good.
Isn’t it interesting that as these emails come to light about possible manipulation or biased extrapolation of data, that central Alaska ( a region in the warming Arctic Circle) is suffering its coldest ever temperatures on record for late November?
This past summer, Chicago experienced its coolest summer in decades, as did many parts of the upper Midwest. Yes, there were some extreme hotspots around the world too, but my point is that from season to season, and year to year, there can be both warm and cold extremes in various areas of the world.
I also find it rather questionable that sporadic data from the past, whether based on tree rings, or other incomplete records which provide only glimpses into day to day or hourly weather patterns can be compared to current record keeping which tracks temperatures hourly on a 24/7 basis. For instance, in Chicago, the official weather station has been in three different locales over the years. In the earliest years (1870 to 1935), the recording station was very near Lake Michigan where cooler temperatures prevail in summer, and warmer temps prevail in winter due to the winds that blow off the steadier temperature modifier of the vast lake. About 1935, the Chicago weather station was moved further inland to Midway Airport, which is about 7 miles west of Lake Michigan. Then, about 1960, the official weather station was moved again to its present site at O’Hare Airport, which is about 15 miles west of Lake Michigan, where typically, the influence of the lake temperatures is much diminished. On many summer days, O’Hare will report daytime highs that are as much as 10 to 15 degrees warmer than Chicago’s lakefront.
If researchers are comparing official temperatures of Chicago’s earliest years to the current years, then Chicago data will imply a warming trend over the decades, when perhaps this has not been the case. (As an aside, I can recall many 95 to 105 degree days during my youth in the Chicago area back in the 1960s and 1970s–something which we have not experienced much in recent years.)
Which leads to my final point here: is Chicago an isolated case of where official reporting stations have changed over the years? How much data over the decades also represent a change in reporting stations elsewhere? Or, if researchers are claiming they have made adjustments for changes in station locations, how can we be sure their changes are properly justified?
My point is that when dealing with variances over time that are less than one degree apart across all the data of the world, and with so many location variables and sporadic variables such as tree ring data prior to when records were kept, would it not be easy to find a 0.5 degree variance over time that may not really reflect changes in long-term temperature patterns?
What he did was create a nice, pretty graph. Whine, whine, whine.
This disproves… absolutely nothing.
See, here’s the problem: You are incapable of understanding their data. This much is obvious, given you are a climate change denier, and that you are writing this post, but I digress.
So how do they show you something which you are not capable of understanding, but which they need you to understand?
They make a nice, pretty graph.
The graph is not the basis of all climate change research.
Seriously folks. If you want to find something incriminating, look for something meaningful.
“But these emails are so incriminating!”
No they aren’t. You haven’t read them. What you’ve done is BELIEVE. You need to actually read them, and consider them objectively, something you are almost certainly unable to do. What is really said in these emails?
The answer is: they are trying, very hard, to fight YOU. You feel vindicated because they are fighting back against you. But the reality is that you are like the creationists – you have decided how things are, and then deny all that contradicts it, despite the fact that a worldwide conspiracy is clearly insane (and purposeless). And, to some degree, you feel that your way of life is being threatened, so you flail around blindly.
Read this email again. What is another way of phrasing it?
“I have discarded the treering data which we know to be wrong and used the more accurate instrumental temperature record.”
Is that incriminating? No. Is that what he said? Yes.
Its not illegitimate to use multiple sources of data and average and merge them into a single graph as long as you explain what you are doing (if you don’t, then it becomes difficult for people to determine where your data is from; while not unethical if you are doing it properly, it can be very misleading and can also corrupt your data). It also isn’t wrong to discard data you know to be wrong as long as you acknowledge what you are doing – in fact, deniers are CONSTANTLY whining about them NOT discarding enough urban data (though it has been shown that urban island heating is not at all significant as far as the data is concerned, people still complain about it). And indeed, that 1960+ treering data does not give accurate temperature measurements is well known and has been discussed in the literature since at least the late 1990s. And reality is, treering data is not the make or break of climate change research; you can throw it all out for the purposes of determining temperature and it won’t change the consensus of the data.
So why this complaining about discarding data? The answer is clear:
You are throwing out everything which contradicts your world view, precisely what you are accusing them of doing.
Re: Titanium Dragon (#243),
Do you understand the meaning of “graft” and “splice” (I mean the former in the data handling sense, not the other term that also has an interesting meaning.)
Your sophisticated understanding of the matter seems to be limited to “see the pretty graph.”
What you are describing and defending is the splicing or grafting of an instrumental record onto a proxy record, something that climate scientists were publically saying at the time “no one would ever do.”
And since you claim to have read all the e-mails, you have no problem with “redefining peer-review” or “send the money to my personal account so I don’t have to pay taxes”?
Re: Arie Brand (#244),
I guess it all depends on what the meaning of deck is.
Re: Titanium Dragon (#243),
Sort of says it all about your view of the world. I guess most of us (excluding, of course, the “soldiers” from CRU) didn’t realize it was supposed to be a war.
“Nice, pretty, graph”! My suspicion from your somewhat rambling comment is that you probably wouldn’t recognize proper scientific methodology if it trotted across your path with a large flashing neon sign on it.
As far as professionally appropriate conduct goes from your heroes, shouldn’t you expect that? Is this a battle to be fought by all available means – propaganda, subterfuge and keeping the denialist enemy from promoting their oh so terrible falsehoods by shutting off their avenues of expression?
Your idols behaved extremely poorly and tarnished genuine scientists and the science itself. Somewhere along the way, you are going to have to understand and come to terms with it.
Re: Titanium Dragon (#243), hey that was really eloquent. I bow down to your superior understanding of human nature. Did you make up that pyschobabble all by yourself?
Re: Titanium Dragon (#243),
In clear terms: it is illegitimate, even dishonest to hide the divergence.
Moreover:
-Mann claimed “No researchers in this field have ever, to our knowledge, “grafted the thermometer record onto” any reconstrution” – if he had not forgotten his own and Jones’s (and Crowley’s) splices, then he lied when he made that statement. What is your opinion on this?
-The fact that the WMO statement diagram uses both the instrumental record and the proxy reconstructions is not stated on the cover of the statement where the graph is, nor are the lines marked accordingly. The first page of the statement explains that the graph uses “palaeoclimatic records…along with historical and long instrumental records”, but again does not describe where one ends and the other begins. In other words, they did not explain what they are doing, never mind done so in the location they should have (namely, on the cover along with the graph).
The removal of “data [known] to be wrong” was not only not acknowledged, it was specifically hidden as stated in the Jones email.
Terry(233)wrote:
“So Gavin now claims that “trick” means “a good way to deal with a problem.” That’s odd. Back in a November 9, 2006 post entitled “Cuckoo Science” criticizing Christopher Moncton, “trick” meant “absurdities that occasionally pass for serious ‘science’ on the web and in the media” and “concepts are being mangled, logic is being thrown to the winds, and completetly unjustified conclusions are being drawn.” ”
I don’t quite understand the proposition that seems to be implied here. Are you saying that if a person once uses a noun that has multiple meanings in one particular meaning s/he is forever bound to use it with that meaning and that meaning only?
So the ship’s captain who has said in the day “clear the deck” cannot at night, when he is setting out to play cards with the First Mate, say: “Give me that deck”?
Re: Arie Brand (#244),
Are you still beating the same drum? Your answer in Comment #208, that Prof. Mann’s use of the word trick meant “quick and effective” as applied to the methodology is pretty much nonsense unless you can point out a “slow and less effective” method that it somehow improves upon.
A graph is a visual representation which has a direct impact on human perception. That is the purpose of a graph. It is eminently clear from several of the emails that the intent was to produce a product which would “trick” the eye and create a perceived result that the current temperatures are way out of line with the previous temperature “record” as reconstructed by the proxies. That is the only “trick” involved here.
Any other explanation is just pure spin intended to bandage the wound in the foot.
Re ChrisZ (#227):
Arie Brand (#222) says:
“there might have been some editorial in it supporting the global warming thesis […but…] Over the years it has serviced as a ready venue for various denialists”
ChrisZ. wrote:
“Others might call this well-balanced, presenting both sides of the debate (as it has been standard since the Romans laid the foundation stones for the laws used by democratic countries today…)”
The very term ‘balance’ presupposes some kind of equality in terms of numbers of COMPETENT adherents to one theory or another. The fact is, that though it is denied in a thousand tongues on this site, there is virtual consensus in the scientific community about global warming. The number of COMPETENT and TRUSTWORTHY sceptics is extremely limited. Thus giving them virtually pride of place in a newspaper (as has happened in The Australian) does not only wrongly suggest that the main issue is still controversial but that “the naysayers have it”.
Re.RomanM (#246):
“As far as professionally appropriate conduct goes from your heroes, shouldn’t you expect that? Is this a battle to be fought by all available means – propaganda, subterfuge…?” asks, in virtuous indignation, the man who seems to be quite content with the hacking and publication of personal emails.
What is again the word for this particular brand of hypocrisy?
Yes, that is it: “chutzpah”
[RomanM: Get your facts straight. I had nothing to do with the (possible) hacking of the emails. Although a comment by the originator(s) of the file was posted on my own blogsite announcing its existence, I removed the comment from moderation BEFORE it could appear to the general public. I have not posted quotes from the emails.
Yes, I have now read parts of it as I assume (perhaps incorrectly from your lack of understanding of the issues) that you have read them as well. No, I have not behaved unprofessionally and I would suggest that you withdraw your unwarranted accusation of hypocrisy.]
I’m as sceptical as most of the folks here, however I can’t see anything damning in these e-mails (not that I’ve read every single one of them). No smoking gun and anyone who thinks this is evidence of a world-wide conspiracy is simply delusional. Now if there was something there about faking CO2 readings, the radiative properties of greenhouse gases, the isotope studies that pins the CO2 increases to fossil fuel burning, and stratospheric cooling (which is, so far as I can tell, a feature of AGW), then I would say there is something there.
But there isn’t. This just seems like a cheap political stunt curiously timed in the lead-up to Copenhagen. It will be interesting to see what the subsequent police investigations unearth. If this is found to have links to the oil or coal industries (or Republicans), this could backfire very badly.
PS – In case anyone is wondering, my scepticism is about the sensitivity of the climate to greenhouse gas increases and feedback loops. I understand the science well enough to accept the basic premise of AGW (and the areas I’ve pinpointed are the keys here), I’m just sceptical of the extent of the impact. I’m also sceptical of the policy responses being proposed to actually deliver what is needed if the scientists do turn out to be right, as well as the transition that needs to happen as we reach or pass peak oil.
Re: Jimmy (#251),
This is exactly how i feel. I’ve read some of the emails, don’t see them as anything more than just general office banter. Yeah some of the stuff around peer reviews, FOIA etc. etc. is “interesting”, but not exactly “damning” or impossible to imagine from their perspective how they might talk about it in office banter (not expecting it to be released to the public) emails.
But everything else you say Jimmy around your general point of view regarding AGW debate is EXACTLY where i stand. Yeah CO2 is a greenhouse gas, but i’m not convinced that it has this 6 to 8 degree celsius change from a doubling or tripling of CO2 content in the atmosphere or whatever is the claim made in the IPCC reports. 1.2 degrees Celsius change by 2100 i could believe, though i doubt that would make for well funded research papers nor for good public policy inspiring science.
“One final thing – don’t worry too much about the 1940-60 period, as I think we’ll be
changing the SSTs there for 1945-60 and with more digitized data for 1940-45. There is also
a tendency for the last 10 years (1996-2005) to drift slightly low – all 3 lines. This may
be down to SST issues”
This is not incriminating at all, nor is it massaging data. They are replacing data with better, more reliable data. This is what is known as “science”, and is how all science works – you refine your data and use more accurate data where possible, tossing out the old, less accurate stuff. If you have a scale which is accurate to +-10 lbs, and then you get one which is accurate to +-1 lb, you don’t use the data from the less accurate scale anymore.
Geoff Sherrington: “The other type of trick is simply to delete raw data. There are a few examples of this in the hacked emails – sorry for the length of this one, but it covers some personal events and correspondence from some time back. Some non-important chat has been deleted by me.”
There’s nothing wrong with this. Indeed, it is necessary to do so in order to prevent corruption of your data. In fact, if you read a lot of the climate crazies websites, they claim that climate change hasn’t occurred precisely because they use this data!
Kasmir: “I see. There’s no risk or cost to imposing CO2 restrictions worth mentioning. As a precautionary measure, let’s imperil the global economy and arrest or reverse the uplift of billions of people. Fortunately, neither the Chinese, the Indians, nor the Russians agree with you.”
Firstly, it won’t “cripple the world economy”. Secondly, let’s assume that there is no warming (even though there obviously is; see also: every data point). That atmospheric CO2 is rising is incontrovertable. That changes oceanic pH, which has all sorts of very bad effects (large dead zones, algal blooms, ect.).
Oh, and third: at the current rate of fossil fuel consumption, we’ll be out in less than two centuries. At an exponentially rising pace, you’re looking at a century. At which point, we’re screwed. We need to change to renewables regardless.
Micheal Jankowski: “So is there any evidence that “trick” is used regularly in the context they are claiming? It seems like they should be able to point to numerous examples if that were the case. I remember talking things like “methods” with professors when I did my grad research, but I don’t think I ever used or heard the word “trick.””
One might say that the trick is to shut off the ozone chamber and do your data recording on the time the samples had their machine turned off while the ozone is being dissipated so as to save time. If you have never heard it used in that context, then I can’t help you, but it is often used in that context.
Bender: “That’s got it. Mann was on a PR mission to remove all red flags (all sources of contrarian talking points) from the science. Including confidence intervals – which is direct proof of uncertainty.”
And people like the owner of this site prove them right.
When they include uncertainty, the deniers claim that obviously there is no consensus.
When they don’t, they claim there is a massive worldwide conspiracy.
The trouble is that they have to deal with the crazies, because people like listening to them.
ChrisZ: “Data that describes something very different from temperature, e.g. growth of trees or deposition of sediments, is declared a “proxy” mainly because its variations are more-or-less “in sync” with actual temperature measurements during the 19th and 20th centuries. Correlation to a degree is made to stand-in for causation, which is of course proverbial “thin ice” to begin with, and when this correlation fails after a very limited time period (aka divergence), one cannot claim it is reliable for past ages where we have no instrumental record to counter-check, nor extra data to perform “Nature tricks” by “filling in” periods of divergence?”
I’m sorry, Chris, but you obviously don’t understand the nature of reality. It is impossible to observe causation. We can only observe correlation. What we call causation is simply when we determine something to correlated enough.
In this particular case, one could well make the argument that something very significant occurred which made the treering data less accurate in modern times – namely, increased pollution. Indeed, there is evidence to suggest that volcanic activity had a similar impact on the treering data, and volcanic activity is a good stand in for pollution. There are lots of other possibilities as well, but that one stands out.
That being said, it is irrelevant at this point, given that other paleoclimate data shows similar trends to the treering data.
“Certainly. No one is damn fool enough to take payola. Not directly. In terms of popular attention, book sales, interviews, having one’s work referenced by political movers and shakers, justifications for grants, and the self-righteous satisfaction which comes from a crusade to “save the world,” it’s hard to beat AGW.”
You mean other than the anti-global warming crowd, which is full of cranks and people funded by the oil industry, right?
Reality check: you are an insane conspiracy theorist.
Which is more plausible: that cranks, plus those with vested interset in maintaining the status quo and preventing data indicating that their pollution is harmful to the planet, are propagating misinformation, or that a worldwide conspiracy of scientists and industry members are creating massive amounts of false data while simultaneously the ice caps, glaciers, and permafrost melt, global temperatures rise, a substance which we have emperically demonstrated traps more heat (carbon dioxide) has more than doubled in concentration in the atmosphere, other gasses (such as methane) which trap heat have also increased in atmospheric concentration, AND all the other data points (shrinking lakes, more extreme weather) point towards the same thing?
My personal vote is that when climate change messes up the world and we see massive famine that we eat the people who denied that climate change occurred.
“In twenty years — perhaps as little as ten — we’ll be looking back with shaking heads at this, as we look back at the “are we entering another ice age” speculations of a quarter-century earlier. Or perhaps the UFO mania of the 70’s and the Satanic cult scares of the 80’s are a better analogy.”
Right. The people who deny that global warming is occurring are the same people who believed in UFOs and bought into SRA.
Do you think it is coicidental that these are the same people who watch Fox News in the US?
Re: Titanium Dragon (#252),
Based on statistically and intellectually solid information I’m sure, along with the rest of your rant. You probably got that by reading our e-mails.
BTW, if you had taken the time to familiarize yourself at all with where the real argument is on this blog, it’s not whether “global warming is occuring”, but rather, how much and why, and are the data sufficient to back up the claims that are being made.
I understand why that might cause your idealogical circuits to overload.
Re: Titanium Dragon (#252),
LOL! Thanks for the explanation. I guess that since I retired I must have forgotten all the stuff I taught for forty years. However, given your statement in comment 252:
maybe I’ll get my statistical re-education somewhere else…
One word of caution for yourself and some others new to the site: On this blog it is unacceptable to abuse the other commenters (as in calling someone “insane”). References to religion and politics are also proscribed. You are currently on the verge of having parts of your comments snipped if the line continues to be crossed.
Re: romanm (#258),
I suppose I might be approaching the line a bit myself.
I’ll back off the “idealogical” stuff.
Re: romanm (#259),
Forget the dragon guys. Statistically ignorant and clearly ineducable.
Re. romanm (# 248)
Yes your lot wants to wring, by fair means or foul, some kind of dishonorable meaning out of this sentence, all in line I suppose with your view that this battle should NOT be fought by all available means.
In the first place the email concerned was from Phil Jones and not Michael Mann (but you are obviously still so obsessed with Mann as a bogeyman that that name came first) and, secondly,the “trick” is only shorthand for plotting the instrumental data along with the proxy record. Briffa drew attention to the fact that there is a considerable divergence between the post 1960 proxy treering record and the instrumental record, presumably because of altered sensitivity to the climate in treegrowth. So I assume that a fair interpretation of “hiding the decline” means clearly showing the instrumental record to compensate for the decline in the proxy-record. That is “quick and effective” in the sense that it obviates a lot of debate – or should do so. But obviously he hadn’t reckoned with you fellows. I am not in the habit of consulting this site much but I have been told that people here are unduly concerned with ‘proxy records”, or actually, and sadly, with casting aspersions on those who have worked with them.
Re: Arie Brand (#256),
[Your comment was caught automatically for some reason, but it has been released now].
What fair means or foul? There is simply no genuine reasonable meaning of “trick” as you want to use it that applies to this situation. The INTENT of doing this the splicing is to create the “hockey stick” impressiion impression.
I am not obsessed with anybody. The trick is Mann’s, not Briffa’s. By the way, Prof. Mann is not what I would consider a particularly competent statistician (by he his own admission as well). Over the past sebveral years, I have indeed seen some of his other tricks (and lots of genuine mathematical errors) in his peer reviewed publications which we read and examined on this site. If you look around you might find some. So, his “tricks” are not exactly new to many of us.
Exactly why (and for what purpose) do you think that the proxy record needs “compensation”” What debate should be obviated? Do you believe that it is all settled and we should quietly listen and nod in agreement? Do you (along with the statistical expert TD) really think that there is a war here?
This really indicates a lot about why you fail to see anything seriously wrong with the behaiour of these individuals and why you somehow think that it is those of us who are amazed at the incredible antics evidenced in the emails who are behaving unethically.
“Based on statistically and intellectually solid information I’m sure, along with the rest of your rant. You probably got that by reading our e-mails.
BTW, if you had taken the time to familiarize yourself at all with where the real argument is on this blog, it’s not whether “global warming is occuring”, but rather, how much and why, and are the data sufficient to back up the claims that are being made.
I understand why that might cause your idealogical circuits to overload.”
To save you some time:
The amount is less than a degree celcius, but the rate of increase is increasing, which has unhappy implications for the next hundred years.
The cause is humanity, via changes in atmospheric concentration of various chemicals and land cover.
Done and done.
Re: Titanium Dragon (#256),
OK. Then maybe you want to take a crack at fielding this question.
http://www.climateaudit.org/?p=7810#comment-366456
Where, exactly is the “acceleration” if the recent rate of increase is very similar to the rate of increase early in the 20th century?
I hope I’m not insulting you by actually asking you to look at another “pretty graph” and thinking a little bit outside of your comfortable little box.
RomanM I never claimed that you personally hacked and publicised the emails concerned. I said that you are ‘content’ with it – why would you otherwise use them to have a go at a particular scientist or a group of scientists? I answered your # 248 but was told that my reply is “awaiting moderation”.
http://www.nature.com/nature/journal/v430/n6995/extref/METHODS/AlgorithmDescription.txt
Steve, you would know better than I. Might this be the reference in Mike’s Nature trick? I don’t have access to the scientific journals to know what work builds on this or what the paper actually says.
“The Northern Hemisphere mean series through 1998 used in Mann et al (1998)
was based on updated values of the Northern Hemisphere mean series through
1998 from the CRU website.”
There is quite a bit of circularity here.
Mike (presumably Mike Mann) gave me a response on Realclimate.org wrt the the combining of proxy data with instrumental record. I’ll add his response below. But basically, he says the “mean” of the instrumental data was used to pad the end point algorhythm. Maybe someone can illuminate that from a statisticians point of view and decide if this is grafting the data or not. The full post is at
1081 at http://www.realclimate.org/?comments_popup=1853
Thoughts?
[Jean S: In the bolded part he is confirming what I said in the post that was actually the “Mike’s Nature trick”! If you look carefully the figure he’s providing, you see the same thing as in UC’s graph. So now every bit of my post has been confirmed! I find it funny that he is saying “as a single “grafted” curve by Mann and collaborators” as if Jones is not now his “collaborator”, and even linking to the “no researchers in this field have ever, to our knowledge,”-comment!]
Re: Leonard Herchen (#266),
I see, mean of the instrumental instead of instrumental. My replication improved by one pixel! Thanks mike. ..small difference.. yeah. Nothing affects your conclusions, but make sure you updated profs. Brown and Sundberg with your calibration-residual-based-CIs.
I am staggered at the duplicity of these so called scientists. I propose criminal proceedings (the salaries were paid for by taxpayers and therefore obtained money by deception). It is a sad day for research when such practices are uncovered. you do NOT merge data, you do NOT select data to suit your arguments. Hand back your Doctorates gentlemen, you do not deserve them.
More from Gavin. I’m posting it here so people see his point of view and people who know the entire history can review and comment it.
Basically, it seems to me that the “trick” is being passed off as an error in labeling and no longer relevant.
Comments?
Re RomanM (#263)
Sorry, but that indignation of yours seems to me largely synthetic. You will have to do a lot to keep this up when it becomes increasingly clear that there are innocuous interpretations possible for those “incredible antics” and that digging for mud there is a profitless enterprise.
Re: Arie Brand (#269),
When you figure out an “innocuous interpretation” for counselling people to destroy information subject to FOI – a criminal offence – I would certainly like to here it. There is a long history associated with much of the remainder.
You don’t have to dig for mud when it is sitting out on top.
Re: Leonard Herchen (#268),
[Update: Hit the wrong button and the comment posted without being completed – here is the rest]
This has been standard operating procedure on RC for years. First you defend the product from criticism by all possible means. When this becomes an obviously losing position, youi say that it doesn’t matter (without admitting error). Finally, you state that it is irrelevant because “the science has moved on”. Sprinkled throughout are undocumented and unattributed corrections to the materials.
These scientists are supposed to be professionals, not students in an elementary course. The emails have confirmed that the “unclear” results are intentional not accidental.
This sort of mixture of apples and oranges to create an effect has been used in other cases as well. Several years ago a graph was posted on a web site (CRU or Met Office, I can’t remember which at the moment) where a higher temperature anomaly based on a less than annual basis was pasted on an plot of annual values. Since the variability of the value was much higher than that of the main curve, it strongly suggested that a very substantial increase in temperature had suddenly occurred. Later data confirmed that it was normal variation, but the propaganda had done its job without being contradicted.
The primary purpose of a graph is to visually convey accurate information. The effect is evaluated by the brain without necessarily taking the full context into account. When such a graph is used in a large document such as an IPCC report, the viewer will usually not have time to read the “fine print” to determine what each of the components in the graph represent and this is where the “trick” of hiding divergence and creating “unprecedented” temperatures comes into play. By the time the issue is raised, doesn’t matter, nothing to see here, move along, move along…
Re #225, my quote from Nigel Lawson’s Times online article marked “awaiting moderation.”
Checking back, the site rules include that “Our service and licences cover the whole range of possible uses – including things like putting the material on your own website or intranet, distributing it by e-mail or other uses up to using our material in advertising or on TV. If you want to do any of these things or anything else involving use of material from The Times you need to contact us.” So maybe you shouldn’t post it. The URL however is http://www.timesonline.co.uk/tol/comment/columnists/guest_contributors/article6927598.ece . FYI, The Australian ran Lawson’s piece today.
So. it’s presumably alright to refer to what Lawson said: it appears that the scientists have been manipulating the raw temperature figures to show a relentlessly rising global warming trend, have consistently refuse outsiders access to raw data, have tried to avoid FOI request and have discussed ways to prevent publication of dissenting papers. Lawson called for a government inqury, and announced that he had set up a think-tank on the issue at http://www.thegpf.org
So, Arie Brand, that’s a former UK Chancellor of the Excheqeur making the assessment which you queried in my earlier post.
There’s a large body of work published over a period of 10 years here, and a lot of history, so I’m finding it difficult to disentangle the many issues involved.
So far as I can see, central to the dispute are 3 very simple, techniques for data manipulation that have been developed by certain researchers for use, singly or in combination, in dendro and paleo studies. I leave aside whether these techniques are valid but they have been used in presenting the outcome of studies undertaken for the purpose of confirming or disconfirming the conjecture that recent years have been the warmest in the last millennium.
They consist of:
1. Admixing the instrumental data with the proxy data, then plotting the admixed data against the instrumental data.
2. Over the period of the instrumental record, systematically removing proxys that do not confirm to the instrumental record, so as to approximate the proxy data to the instrumental data.
3. Truncating proxy data to conceal the fact that the proxy data does not conform with the instrumental data over a “calibration” period.
There seems to be no dispute on either side that some of these techniques were used, outside the peer reviewed literature, for the purpose of presentation/ advocacy.
What I want to know is: Is the gist of the complaint, that papers were presented for peer review without disclosing the use of these techniques, and in a manner which concealed their use from the publication referees, so entering into the peer reviewed literature papers which would have been rejected for publication if these techniques had been disclosed? Then, following publication, failing to disclose these methods or the data, which would have revealed their use, to persons seeking to replicate their findings?
Amazing! The Jones comment has now reappeared on the UEA web site ( though the time of the update still reads 17.45 November 23, which was the update that originally removed Jones’ “clarifications”).
Maybe someone emailed them and questioned why it had been removed or they just realised it was even more suspicious to delete it since it was already all over news sites accross the internet.
Another development today the Guardian.co.uk journalist George Monboit, who has been very proliferous in support of AWG, seems to have had a wake up moment. He rightly says that this does not put AWG as a whole in doubt but he seems seriously pissed off with CRU and is calling for Prof. Jones to resign. A call which I’m sure many scientists and observers will echo.
http://www.guardian.co.uk/commentisfree/cif-green/2009/nov/23/global-warming-leaked-email-climate-scientists
http://www.uea.ac.uk/mac/comm/media/press/2009/nov/homepagenews/CRU-update
I think Prof Jones clarified this nicely on the UEA site.
Same green line , two different datasets. How precisely the two were blended at the switchover and whether this is called a graft a blend or a fudge seems a bit acedemic, though it would be nice one day to be able to reproduce their handiwork.
coming back to UC’s comment 271:
so if I follow this correctly, not only was there a graft of two datasets but the weighted mean used to smooth the proxy data was polluted with the mean of the temperature record over the latter half of the window for the proxy mean dispite the fact that this interval had valid data from the proxy record available (since it had been truncated by 20 years anyway.)
Thus bleeding the temperature record back in to the mean would have ensured a smoothed crossover rather than a simple graft which may have been obvious to the eye.
If I’m reading this correctly , it is further proof of a deliberate attempt to mislead. It was not simply done to fill the calculation window because data was available to fully calculate the mean upto the arbitrary cut off of 1960. This is not an “end point” problem because it was not the end of the data. Again this is more carefully crafted misinformation to try to pass this off as common practice.
Honestly, the closer you look this worse and more flagrant this gets.
Re: P Solar (#279),
Black (reconstruction) + red (mean of instrumental + mean-padding) in the figure below is the input for the smoother:
This trick explains the 1940s warming blip in the smooth 😉
These are sad times indeed, both for science and for integrity in general. It seems that by starting a lie (and all of the known evidence now points to climate change being a lie), we have unleashed an unstoppable juggernaut.
I am reminded of a handful of fools who were so obsessed with their own political agenda that they, by shooting an Archduke, trigger a war that changed history and bought misery to many millions.
As I write this Australia is about to vote in sweeping new taxes that will change our energy sources, our standard of living and our way of life for ever.
To know that this is based upon bogus science is galling.
I have read this entire blog with great interest. I’m still no more or less convinced of global warming. I just wish that the debate could be informed by science and less by prejudice. To quote Prof Stanley Feldman “Let’s be clear: the work of science has nothing whatever to do with consensus. Consensus is the business of politics. Science, on the contrary, requires only one investigator who happens to be right, which means that he or she has results that are verifiable by reference to the real world. In science consensus is irrelevant. What is relevant is reproducible results. The greatest scientists in history are great precisely because they broke with the consensus. There is no such thing as consensus science. If it’s consensus, it isn’t science. If it’s science, it isn’t consensus. Period.” [Global Warming and Other Bollocks, Metro Publishing, London 2009]
It seems to me that throughout the climate change debate we have been treated to very little science and a great deal of consensus. The argument about whether a graph was deliberately manipulated by some scientific legerdemain or not is important but, perhaps, only as important as that it demonstrates how much of the global warming forecasting is based on some very dodgy historical data: data not collected by the forecasters themselves and not verifiable by others. Their conclusions, based on these data’ beg more questions than they (attempt to) answer.
Let’s look at Stephen McIntyre, the editor of the “Climate Audit” blog and most prominent critic of the temperture record for the last 1000 years.
A little background check can say it all. Stephen McIntyre has a degree in mathematics and spent (30) years in MINERAL EXPLORATION. He use to be the President and founder of “Northwest Exploration Company Limited”, which has been taken over by CGX Resources Inc. as an OIL AND GAS exploration company. Does anyone smell a skunk in the works????????
Re: Background Checker (#282),
Here we go again – another drive-by with such deeeep insight. Sigh…
What’s your point? Steve worked for a living? Without people doing the job of finding energy sources, you’d still be rolling your carved from stone wheel around.
After all of the study he has put into the literature,Steve knows as much as about climate science as most any of your fine climate scientists (who might benefit from learning a little math themselves).
If there is a bad smell, it just arrived. I suggest we can ignore this troll – he has nothing new to offer.
Re: Background Checker (#282),
I hear he even filled up his tank at an ExxonMobil station once (or are they still Esso in Canada?).
But how ’bout we do this.
Income for Steve McIntyre from this endeavour? Negative (tip jar minus lost consulting fees).
Funding for climate scientists? Billion and Billions.
Watching intellectual pipsqueaks trying to unscrew the pooch? Priceless.
Re: Background Checker (#282),
Then show me a university that is currently giving a degree in climate science. The team has members that are dendros, ice core experts, geologists, chemists, etc. Not a single statistician in the bunch.
Climate science appears to have a wide array of specialties, and uses the data from all these sources to create a single premise: that the current .7 degree rise in temperature anomaly (based on a 30-year old reference point), using mysterious codes and programming, using data that is hand-selected and unavailable to non-academics, is unprecedented (ie., not seen in the past million years).
Re: Titanium Dragon (#255),
Your effort to equate Steve’s work here at ClimateAudit with creationists is simply a confession on your part that you are either completely ignorant of the work or that you realize that you have no rational answer for it.
You are like so many in the alarmist camp: very skillful and passionate at denouncing and smearing Steve yet singularly unable to address any of his findings. In other words, all bark and no bite. How telling.
Hello all,
I’ve watched this forum for at least a year, and have forwarded excerpts to my friends of comments from names I recognize on this thread such as ‘Ian’, ‘RomanM’ and ‘crosspatch’. Thank you Ian for #213, very well said, and in general I salute everyone here who has been obviously working towards the truth.
I do not know of any forums to launch my take on things for AGW, so I will only seek to make an initial comment and keep things to reference what others have said on this thread. About a year ago I did participate in a public affairs bulletin board on an AGW thread and eventually was banned from that thread. Not for swearing or abusive behaviour, that was the tactic of the ‘opposition’, I was ousted because I was not a believer. And so I am familiar with the vitriol and feeling of say the Dragon and Arnie above. Even though I am a skeptic and denier, I do share with the warmists the ‘feeling’ that there is a threat to humanity etc., but I see their cause and the PTB promoting that cause, as the threat.
In short I recognize the Malthusian billionaire / trillionaire foundation money trusts, who indirectly own and control the UN IPCC and almost every other NGO going, as the threat to humanity long term. The UN is a private corporation, it is unelected. There IS an informational war going on, and most people are unaware of it . So I suggest that those on either side of this debate, both looking for justice and truth are both on the losing side if they are unaware of the bigger picture. Although this forum/ BB has been one of the bright lights of info for people to check in on, I have at times been disappointed that inevitably the scientific specialists have been so engrossed in minutae as to not see the forest for the tree rings.
My take on things is that the question before us is geological. But as usual for humans our biggest problem is political. I appreciate immensely that the quest for truth here however has been at the nuts and bolts level of statistics, since that has been the info weapon of choice for the UN modelers. We don’t have the right or responsibility to manage the climate (what hubris!), yet the alarmists fell for the trap of thinking that climate is supposed to stay the same in their lifetime, so we must do everything we can to keep it the same. It only changes slowly over time as the theory goes, although thousands of frozen mammoths buried alive in snow, test that theory.
Most of what I want to say is that this issue should also be considered in the bigger yet real context of geology and politics, somewhere, somehow. Does one need to be an accredited expert on such things, as if Gore and other influential people are? What I do share with most people here is the skepticism that “man’s contribution to climate change” is the “looming climate catastrophe” worthy of being our number one priority in life to “combat”. The reality is that a leading foundation supported think tank, the Club of Rome decided years ago to make man the enemy of the Earth through whatever scare scenario they deemed the public likely to believe. We all can understand air pollution, so the leap from smog to CO2 as a pollutant was dreamed up because of it’s obvious “Limits to Growth”, and more subtle Malthusian control potential. Never mind the fact that the higher the concentration of CO2, the greater the crop yields, the greater the biodiversity. If there’s one gas essential for life on this planet, one gas more ‘green’ than anything else it’s CO2 but shushh don’t tell the environmentalists, they won’t understand. Never mind that CO2 is heavier than air, that it’s dubious to think it’s rising upwards. Never mind that below 200 ppm CO2, plants die and that at 1,000 – 1,500 ppm CO2 plants thrive, 385 is way too high, can’t you see?
The 1930’s were hot, the 1970’s were cool, the 1980’s and ‘90’s were warmer, and now it’s maybe cooler what with cold weather records being broken worldwide the past 2 years. Yes it’s a crisis, and the ‘science’ proves it, now I see! But I ask any of you, has the Greenhouse Effect, has that theory here on Earth been proven to be a fact, a Law of science? Everyone analyzes numerical concentrations of a gas which may not have any effect on temperature in fact, for a century old theory that seems to contradict the second Law of Thermodynamics, as I have heard.
Why is it that the Moon is so much hotter than the Earth when the sun is shining on it? Why is the Moon hotter when it has no atmosphere, no ‘greenhouse’? Can the insulating effect of our atmosphere both allow energy in yet keep it from leaving? Really? Is this the new form of free energy we’ve been looking for? Can we reproduce it on the Earth’s surface and solve our energy problems with a little water vapour and some bovine inspired methane? Cool!
Science has orthodoxies and every so often they crumble. What if there was no Greenhouse Effect but all the number crunchers thought there was? As long as the politicians pay, there’s no problem I guess…
http://www.uea.ac.uk/mac/comm/media/press/2009/nov/homepagenews/CRU-update
And finally , tonight, it’s gone.
Sorry, but the page you requested does not exist.
Can as many people who are able sign the petition to stop this desigraceful behaviour at the CRU at: http://petitions.number10.gov.uk/UEACRU/
“We the undersigned petition the Prime Minister to suspend the Climate Research Unit at the University of East Anglia from preparation of any Government Climate Statistics until the various allegations have been fully investigated by an independent body.”
OOf, you have to keep your eye on the pea with this crowd. It seems the hyphen was removed and the content updated. CRU-update is now CRUupdate
http://www.uea.ac.uk/mac/comm/media/press/2009/nov/homepagenews/CRUupdate
Rolling out the big guns now. Let’s hear the Pro-VC:
Statement from Professor Trevor Davies, Pro-Vice-Chancellor, Research
Masterfully scripted spin. Note the careful inclusion of “peer-reviewed” here. So since the graphic provided to WMO was not a peer-reviewed publication this statement does not apply to the graphic in question that Prof. Jones chose to comment on above all else.
So the Pro VC’s statement does not apply to the Mike’s trick email and the manipulation that was done to a graphic, not simply “in” the WMO Statement, but on the cover in full technicolour.
Don’t forget that his reassurance only applies to peer-reviewed publications by CRU. Prof Davis clearly choses his words much more carefully than P. Jones. Keep your eye on the ball here.
Hmm, sounds like a direct quote from the relevant legislation. So he is not saying that data has not been deleted, altered, or otherwise dealt with, just that such treatment was not done with the intent of preventing disclosure.
This then leaves the option of declaring data “lost” or deleted without this having been done with the intent to prevent disclosure which may of course be a criminal act. Why does the colloquial expression “arse-covering” spring to mind? Is that the sound of a draw bridge being raised?
It seems the good professor is seriously expecting legal repercussions. He may not be wrong.
Returing to Prof. Jones. This new page ends with a revised statement from P. Jones, the original graphic and a new one that shows what the data really looks like. The new version is strikingly different from the published one.
But you don’t “only show” this series do you, professor? You, by your own admission, merged the physical temperature record onto the end of the proxy data and the ensemble was presented by one continuous green line that was labelled as Briffa (1999).
So even at this late stage he is still not being straight.
Can this man be trusted to head an organisation with such importance to future world energy policy.
I don’t believe he can.
Steve’s a bit distracted right now, but let’s all remember the blog rule…no E and no C.
Re: John M (#293), My apologies! I’ll withdraw the E&C if Titanium Dragon will. 🙂 I do think, however, that the assessment of the quality of the catastrophic AGW hypothesis in the context of other well known and accepted science is valid.
The real scandal is not in the emails but the code!
They just programmed the climate curve (hockey stick) into the application which draws the curve – no matter what data it uses. This is the ‘trick’ they talk about in the emails. Here is the portion of the code, which manipulates the curve. It creates a mask, shich manipulets the data from 1904 on, dealing with the decline and then artificially magnifying the curve by 2.6 for the last years:
original code (..FOIA..documents..osborn-tree6..briffa_sep98_d.pro)
;
; Apply a VERY ARTIFICAL correction for decline!!
;
yrloc=[1400,findgen(19)*5.+1904]
valadj=[0.,0.,0.,0.,0.,-0.1,-0.25,-0.3,0.,-0.1,0.3,0.8,1.2,1.7,2.5,2.6,2.6,$
2.6,2.6,2.6]*0.75 ; fudge factor
if n_elements(yrloc) ne n_elements(valadj) then message,’Oooops!’
;
yearlyadj=interpol(valadj,yrloc,timey)
Re: elvis (#295),
Do you have a link to who “they” is?
At the risk of having bender hop in here and tell me to read the blog 🙂 can someone refresh my memory on whether a reason was ever proferred as to why reliable tree thermometers suddenly switched to being unreliable tree thermometers circa 1960?
Re: Brian B (#297),
That’s the question. Don’t read the blog! You won’t find an answer! That’s why we’re guessing all over the place, the same way the dendros are: what caused the divergence? Why is it such a widespread phenomenon? Why is it focused at high elevations? If Wilson, Salzer, Wilmking et al. know the answer, I’ve not seen it. Educate me, boys.
Re: bender (#298), thanks bender.
I thought the only reason ever given was that the trees had “moved on” from recording temperatures but didn’t want to accuse any dendros of not having advanced some plausible reason this occurred if they actually had.
Re: Brian B (#297),
P.S. You can search CA for the phrase “divergence” and find a thousand speculations as to what’s going on. Nothing from the authorities, curiously enough.
I choked on my coffee and really laughed out loud this morning listening to the ABC Radio National. This CSIRO scientist, Peter Osman, uses the word trick in a tricky way, to say the least. Here is my transcript of the last 20 seconds of the 5-min radio segment related to reducing household CO2 emissions.
“…there’re all sorts of tricks making that relatively comfortable to do. And if you are buying appliances, go for the very high star-rating ones, especially things like TVs. There are all sorts of tricks. There is no single really big one, but there is all sorts of tricks.”
UC 289 and others
My question is: “Why the mean of the thermometer record” Why not the natural log of the mean to the power of pi divided by euler’s number squared?
DOesn’t taking the mean sound fancy but is basically still meaningless?
I would like to thank the individual who had the courage, and capability, to put the CRU data public. You have done more for the integrity of science than will be understood for decades.
You have immensely helped to clear up the confusion of the people who are barraged by propaganda, a mix of sciency political green stew.
And the data set is a Gift that’ll keep on Giving!
Sincerely.
[snip/Jean S. You have nothing to say about the topic, and you are adding nothing to discussion. Roman really tried to discuss with you, in vain. I’m not that pationed.]
Did anybody notice, it was not a hacker, but an insider?
Here the evidence:
If that means they have had IP-address protection before the “hack”,
this could only mean it was an INSIDER!
NOT a hacker!
I notice that, following my post at 273 above, the UAE have uploaded a statement on their website addressing the issues raised. Can we infer causation from this correlation? Are they avidly following this thread?
Clearly, they are circling their wagons around the pre publication peer-review process. An immediate point to make is that “Mike’s trick” is a trick originated under the auspices of another institution, and whilst they maintain their confidence that no-one in their institution has sought to undermine the pre-publication peer review process, they do not seek to extend that confidence to other institutions and in particular the progenitors of the “Hockey Stick”.
A second, obvious point, is – they simply havn’t had time to determine whether their confidence in their own staff is well placed or not. With the best will in the world this will take months, the inference is that no review whatsoever has taken place.
Prof Jones adds a brief “explanation” of his use of “Mike’s trick” in the context of his position as an advocate, outside of the peer review process.He uses two graphics, one very familiar, one far less familiar.
The familiar one is the data as presented wearing his hat as an advocate, the “persuasive” one. The second is the true position. The two are more strikingly different than ever I had imagined. First observe, observe that – oops, well I’m stumped – the page has been taken down already – but it did show that that proxies in the real graphic never rose above 0 anomaly, but in the “persuasive” graphic they rose to the highest positive anomaly in a millennium. Mmmmmm.
Furthermore, Not only does the proxy data fail to conform to the instrumental record over the truncated portion, but, in all, it fails to conform over about half the period of the instrumental record.
The other striking thing is, that Prof Jones appears totally unaware of this. He appears to be afflicted by that well known condition , which we all suffer from time to time, and I’m battling against even as I type – confirmation bias.
Clearly, outside the process of pre-publication peer review Prof Jones suffers from a severe case of confirmation bias, but has the UAE yet determined whether it has affected his published researched?
Congratulations! It is nice to see the truth fall out of the sky. They are already being Clintonesque in the debunking process. All I can do is go way back to a quote in the beginning of the Climate Change debate…
Dr. Richard S. Lindzen, the leading climate and atmospheric science expert from MIT
“In the long run, the replacement of the precise and disciplined language of science by the misleading language of litigation and advocacy may be one of the more important sources of damage to society incurred in the current debate over global warming.”
Just been into the email database, took a look at one text file at random to get an idea of how many of these emails had issues.
http://www.eastangliaemails.com/emails.php?eid=23&filename=853426848.txt
Gets you this at the bottom,is he trying to show the data was going the wrong way?
Dr Mike Hulme tel: +44 1603 593162
Climatic Research Unit fax: +44 1603 507784
School of Environmental Sciences email: m.hulme@xxxxxxxxx.xxx
University of East Anglia web site: http://www.cru.uea.ac.uk/~mikeh/
Norwich NR4 7TJ
Mean temperature in C.England during 1996 was 0.3degC below the 1961-90
average.
The maximum temperature in Norwich: Tuesday 13 January: 9.1degC.
As usual, trying to read RC on this topic leaves one more confused than at the start. Oh, not that it doesn’t go on here, the confusingnedess. But at least here you don’t have a party-line, with the regulars towing that party-line and making fun of the other side with an opposite perception of things.
Oh, and here, there’s not five or ten committee members putting inline comments after every-other-second-odd post here.
I was just flipping channels and ended up listening to AM radio for about 3 minutes. I heard Steve’s last name mentioned about 5 times by RL and it seems all of yesterday’s show was about these emails and climate change. No wonder the servers here are getting a workout. 🙂
Hmmmm, wonder if the RC servers are having a hard time. Hmmm. My, over 1600 posts over there on this.
Re: romanm (#283), More like “Without large numbers of people actually working to provide the energy some people happily use and even more happily complain about, you’d still be rolling your own in the dark while complaining about the lack of modern technology. And craving Doritos.”
heh, for some reason, I doubt many of the people in the “AGW is an immediate problem requiring strong methods to solve.” mind-set would be rejoicing about how the planet was much happier if we were back in pre-industrial times without all this technology and a much smaller world population.
“You know, without all this pesky technology, we could be enjoying ourselves taking care of the planet!”
http://www.hyw.com/books/history/Agricult.htm
+
if (iconb==0)
apad=mean(indata)*0;
[RomanM – snip – abusive comment. Where do people like this come from?]
Re: Dan W. (#321),
What do you wish to all of the folks posting here who have a great deal of experience working in laboratories and a great deal of knowledge about combining similar yet disconnected data sets from differing sources and more importantly a great deal of knowledge about when not to do it and the integrity not to hide it?
Is there any method of taking Mann’s Hockey Stick data graph and extrapolating back the projected data one would need to see from tree rings etc to produce such data using their own model in earlier timelines? Where I’m going with this is perhaps it is possible to dispute the hockey stick purely based on it’s internal validity. Seems like an ironclad method of detonating the warhead directly on the hull of their submersive vehicle.
Example:
“If we are to believe Mann’s Hockey Stick model we’d be forced to believe… tree rings… etc…. clearly this is impossible and a fantasy proving that Mann’s data is in fact due to skewing using a package of statistical tricks.”
snip – editorially there’s no point debating “big picture” items in one paragraph bites. Blog editorial policy
How many times and how long people let these guys twist the truth?
What is so freaking hard in understanding the words “adding in the real temps to each series”? Compare Jones’ own WMO figures, what’s the problem in understanding those? Or is it that my/UC’s writing/graphs are somehow unclear? Please let me know as I really can’t understand how this obsfucation can go on and on and on…
Re: Jean S (#326)
Gavin just posted on RC that all of the problems in the HARRY_READ_ME are related to HadCRUTv2 and they have been fixed in HadCRUTv3. Of course, he omitted the little bit about fitting the HadCRUTv3 results to the HadCRUTv2 results.
Chutzpah is not strong enough for these guys. We need a new word to describe their complete lack of shame.
Re: Jean S (#326),
It is quite amazing.. Well, what can we do, my data is here:
http://www.climateaudit.org/wp-content/uploads/2009/11/mbhsmooths.txt
Pl. someone tell another way to generate these (e.g. without Mann’s tricks)
Re: UC (#332),
No answers, but that was a trick question. You’ll need instrumental to reproduce MBH98 smooth:
[Jean S – snip – nothing to do with the post]
Neven: #69
“Mr. McIntyre, could you put a pack of all your private correspondence with Anthony Watts, Marc Morano and anybody associated to a think tank on a server, so we can download it and have a look? I mean, you are so honest and transparent that there is nothing in there that can be pulled out of context, right?..”
Do you mean “out of context” things like “beating the crap” out of people? Or describing someone’s death, (who disagrees with you, of course) as “cheering news”? Or discussing how to destroy a journal that has published papers sceptical of their science? OR … The list would be too long to post here, but here is a good place for you to start..
Somehow I would be very surprised if in his private emails Mr. McIntyre, (or Mr. Anthony Watts), discuss such things or even harbour such thoughts (about crushing dissenting opinion). In fact both their blogs are very open. I suppose if you are censored and repressed like in RC you have need to let of steam in private. (And if you do not reveal data etc in FOI requests you get into the habit of “hiding” things).
In fact because the emails are so seemingly controversial, that the context is being discussed here and elsewhere, to make sure what the context is and they are not “quoted out of context”
In this regard Pat Michaels seemed pretty certain that Phil Jones knew what “hiding the decline” referred to.
In my next post I would like to know the context of another email and whether this was also related the above email and if so how?
Jean S – I thought this email might be related to the one above. Would be grateful for your comments and analysis
It doesnt sound very good to me. The word “hiding” is used again and shows very intimate collusion between the parties.
From: Tim Osborn
To: mann@xxxxxxxxx.xxx,imacadam@xxxxxxxxx.xxx
Subject: Briffa et al. series for IPCC figure
Date: Tue, 05 Oct 1999 16:18:29 +0100
Cc: k.briffa@xxxxxx….
Dear Mike and Ian
Keith has asked me to send you a timeseries for the IPCC multi-proxy reconstruction figure, to replace the one you currently have. The data are attached to this e-mail. They go from 1402 to 1995, although we usually stop the series in 1960 because of the recent non-temperature signal that is superimposed on the tree-ring data that we use. I haven’t put a 40-yr smoothing through them – I thought it best if you were to do this to ensure the same filter was used for all curves.
The raw data are the same as used in Briffa et al. (1998), the Nature paper that I think you have the reference for already. They are analysed in a different way, to retain the low-frequency variations. In this sense, it is one-step removed from Briffa et al. (1998). It is not two-steps removed from Briffa et al. (1998), since the new series is simply a *replacement* for the one that you have been using, rather than being one-step further.
A new manuscript is in preparation describing this alternative analysis method, the calibration of the resulting series, and their comparison with other reconstructions. We are consdering submitting this manuscript to J. Geophys. Res. when it is ready, but for now it is best cited as: Briffa KR, Osborn TJ, Schweingruber FH, Harris IC and Jones PD (1999) Extracting low-frequency temperature variations from a northern tree-ring density network. In preparation. Keith will be sending you a copy of the manuscript when it is nearer to completion.
I have also attached a PS file showing the original Briffa et al. (1998) curve, with annotation of cold years associated with known volcanic eruptions. Overlain on this, you will see a green curve. This is the new series with a 40-yr filter through it. This is just so that you can see what it should look like (***ignore the temperature scale on this figure***, since the baseline is non-standard).
With regard to the baseline, the data I’ve sent are calibrated over the period 1881-1960 against the instrumental Apr-Sep tempratures averaged over all land grid boxes with observed data that are north of 20N. As such, the mean of our reconstruction over 1881-1960 matches the mean of the observed target series over the same period. Since the observed series consists of degrees C anomalies wrt to 1961-90, we say that the reconstructed series also represents degrees C anomalies wrt to 1961-90. One could, of course, shift the mean of our reconstruction so that it matched the observed series over a different period – say 1931-60 – but I don’t see that this improves things. Indeed, if the non-temperature signal that causes the decline in tree-ring density begins before 1960, then a short 1931-60 period might yield a more biased result than using a longer 1881-1960 period.
If you have any queries regarding this replacement data, then please e-mail me and/or Keith.
Best regards
Tim
Calibrated against observed Apr-Sep temperature over 1881-1960
averaged over all land grid boxes north of 20N
Bishop Hill Smoking gun?
November 26, 2009
Climate On the code thread, James Smith has just posted this comment:
From the file pl_decline.pro: check what the code is doing! It’s reducing the temperatures in the 1930s, and introducing a parabolic trend into the data to make the temperatures in the 1990s look more dramatic.
Could someone else do a double check on this file? Could be dynamite if correct.
Update on November 26, 2009 by Bishop Hill
This is what all the fuss is about, but the reader who sent it thinks perhaps it may be a storm in a teacup. Still, it is strange that one would want to put an adjustment like this through a temperature series.
link should be
http://www.climateaudit.org/wp-content/uploads/2009/11/mbhsmooths1.txt
[Jean S: UC indicated to me that this file is missing the header:
% Year AnnualRecon Instrumental MB98SmoothTrick MBH98SmoothNoTrick MBH99SmoothTrick MBH99SmoothNoTrick]Re: UC (#333),
Thanks Jean, so there’s the data and everyone is welcome to try to generate those smooths without adding instrumental data. I know that this all is crap criticisms from the idiots
( http://www.eastangliaemails.com/emails.php?eid=423&filename=1092167224.txt )
But I can totally understand mike, having a code that includes trend matching to smoothed instrumental “(adjust and scale Jones et al (1998) and Crowley and Lowery (2000) reconstructions to match mean and trend of smoothed instrumental series)”, I’d be very careful too (keep the idiot statisticians away) 🙂
http://market-ticker.denninger.net/archives/1667-Hide-The-Decline.html
please watch this short clip. hide the decline. quite good.
regards
Just a quick thanks to RomanM for his very appropriate editing of my post (#292) – taking out the “off limits” material but still leaving in the relevant paragraph in which my key point was made “within limits”. If only some other climate change forums were so open and honest 🙂
Re: Richard (#335),
I see there are 2 Richards here. Will the real Richard please stand up.
I am the Richard of Richard (#329), Richard (#330), and Richard (#331), and I am a Kiwi.
Maybe you could suggest a way we could distinguish ourselves (by signing differently maybe? Like Richard the kiwi or the lionhearted)
Re: Richard (#337), Fair call Richard, I don’t post here very often but in future I shall use “Lionheart”.
Code for the NoTrick columns:
As there shoudn’t be any tricks in the MBH98 smooth (mike already confessed the MBH99 trick), I’m waiting for the code to generate the MB98SmoothTrick column
All of this detail is far less interesting than the timing. Just before Copenhagen: just in time to elevate the fear, uncertainty and doubt that may well result in yet another decade of business as usual.
Re: Colin Reynolds (#340), Re: jb (#346),
In some ways that is perhaps the greatest scandal here. This is one of the most important data repositories in the world and these people’s data management practices are nothing short of appalling. Still, I suppose that has suited their purpose.
Re: Colin Reynolds (#340),
The timing is not “interesting” at all. It is either coincidental (the hackers had been trying for some time and only recently succeeded), or it is deliberate (to achieve maximum impact). I suppose the latter is more likely.
But what does any of that have to do with the content and what it reveals about the state of climate science?
Arguing that the timing of the act (or its likely illegality) is somehow relevant to how we view the content of the liberated data, is typical of the woolly thinking that has held sway in the public debate to date. It’s another version of “if AGW is real it will be very serious, therefore we should believe it’s real”.
Re: Richard (the Lionheart) (#349),
and what a snide, schoolyard bully claim it is considering the plethora of scare-mongering pre-Copenhagen news releases that have been made since mid year.
regards
I made an illustration with three graphs on the same scale, which shows in detail how the trick was executed.
It seems that the decline of Briffa’s series started long before 1960. In fact the series end in 1960, or is the graph of CRU’s Nov 24th update also truncated?
Re: Johan Branders (#341),
Nice! Yes, CRU’s update is still truncated, see Steve’s post about it:
Has anyone asked Nature for an opinion about their magazine being known for having published a trick?
I thought that everyone knew that getting scientists to agree is like herding cats. Disputes, fueds and jealousies are the main raesons for the existence of many scientific journals.
“The trick” is too try to reconcile divergant data sets,ice core, tree ring, thermometer readings, into a coherent statement. As shown in the emails this has been going on for some time and will continue. The fact that attempts to reconcile problems are made, criticised and amended is a strength not a weakness. Using the real numbers for the 1960-2000 period is hard to criticise. Not using the real numbers would be unforgivable.
We should recognise that these data sets are used by other than climatologists and their critics. Archaeologists, biologists, botanists et al . All see a need to interpret the raw data. Climate scientists seem to be under attack for using sound science.
Re: John McManus (#343),
Very nicely rationalized. You might try commenting at Real Climate about this famous Michael Mann quote:
Re: John McManus (#343),
Some of the “real numbers” for the 1960-2000 period were “used” — specifically, the instrument numbers that show increasing temperatures were “used” by appending them to the tree ring record, thereby creating a phony tree ring record that appears to match the warming of the second half of the 20th century.
Other “real numbers” — specifically, the actual tree ring data from post 1960 — data that shows an inconvenient and unexplained decline in contrast to the instrument record’s increase — was not used. Why? Because this decline in the tree ring data calls the entire tree ring record as a temperature proxy into question, meaning that the nice, stable, flat handle of the hockey stick graph — the portion that makes it appear that temperatures were nice and stable prior to the evil influence of man on the climate — is potentially meaningless. If tree rings fail to respond to the modern warming, they may have failed to respond to similar warming in the past.
Using the data that supports one’s hypothesis while hiding the data that contradicts it is not “sound science” — it really isn’t any type of science at all.
The e-mails themselves are damning enough, – snip
That other 95% contains data sets, programming code, and comments from the scientists and statisticians working with them. Now that outside experts are having the chance to delve into them, what they’re discovering is that they’re utter garbage. The data is incomplete, corrupted, and has, in places, been made up. The programming code is full of bugs and the predictive models are flawed with poor predictive power. It’s no wonder that the guys at the CRU have resisted making their work public for so long.
snip – policy
From Harry_readme.txt
“Another problem. Apparently I should have derived TMN and TMX from DTR and TMP, as that’s
what v2.10 did and that’s what people expect. I disagree with publishing datasets that are
simple arithmetic derivations of other datasets published at the same time, when the real
data could be published instead.. but no.”
What does this mean? It implies substitution of estimates for real data which might contradict it.
Or this
And agreed a strategy:
AGREED APPROACH for cloud (5 Oct 06).
For 1901 to 1995 – stay with published data. No clear way to replicate
process as undocumented.
Replication is fundamental to science.
The question I have is why the data was not stored in a proper database package instad of all these files.
Yes indeed John McManus, it depends on what the definition of “real numbers ” is, doesn’t it?
Which brings to mind the famous quibble over what the definition of “is” is.
The tree ring data was not matching the actual measurements, therefore, they were deleted. I thought this was simple enough for the denialists to understand.
You are not the first to post such a naive and incorrect comment regarding this issue.
I have a novel idea for you. Try reading the contents of this thread and others on CA which explain how tree ring reconstructions are supposed to work. Once you have understand the concepts, you may possibly figure out why the “not matching” can very well invalidate the entire reconstruction. With this new information, maybe you will also see how and why presenting the graph after the deletion of that portion with the continued use of the rest of the reconstruction strongly resembles intellectual dishonesty.
RomanM:
Why did Jones refer to “Mike’s Nature trick” as a trick originating from Mike? Think about that. He didn’t need to say it that way, did he? And he didn’t need to mention the trick and who designed it in an email … yet he did. Why did he do such a gratuitous thing?
Probably, because it was so “clever” and “effective”!
Don’t you just love how those three curves put aside their earlier differences and unite in their proclamation of AGW? Man(n), you’ve gotta give him credit. 😉
Was Jones intentionally leaving a record of who to blame for this deception, should it ever become public knowledge? He KNEW the FOIA would not stop coming. He KNEW it would come to this.
I’m not sure that I would buy that, bender. The e-mail in the head post was written in 1999 before concern with FOI became a serious possibility. Furthermore, Jones states (bold mine):
The fact that he involves himself in this case is clearly evident.
However,it seems pretty clear to me from the wording that the three addressees in the email were all familiar with the previous use of the method.
So he was just bubbling with the excitement that he could play too? Could be. What a loser.
I read three posts by McIntyre on these issues. None of the addresses this issue. Perhaps you can provide a more concise summary or link to a proper explanation.
Tree rings are reliable proxy thermometers… except when they’re not. The “trick” basically erases the last four words of that sentence. Hope this helps.
Tree rings data, as with any other indirect form of evidence, is reliable as long as it does not contradict other independent pieces of evidence.
To be very simplistic, there was evidence that tree ring data was reliable in the past, and now there is evidence (direct measurement by thermometers) that it is no longer reliable. Thus, the decision to include them while they are reliable and omit them when they are not, is quite logical.
What are the “independent pieces of evidence” that tree ring data from the MWP are reliable?
Lotharloo’s Logic:
Tree rings are reliable thermometers some of the time during the instrumental period, therefore they are reliable thermometers all of the time during the non-instrumental period.
It wasn’t even logical to the Team. Thus “hide the decline.”
Just like a pharmaceutical trial, where you delete the drug test results that you find inconvenient because they diverge from your expectation.
@Michael Smith: Such as ice core or coral growth. You can calibrate or assess the quality of tree-ring data with these kinds of proxies. This is a big research area and I don’t pretend to know much.
@Sleeper: Sorry, you got it wrong. Read again.
Decline refers to the fact that according to the theory, tree rings should have been thicker but they are thinner. Why they should have been thicker? Because now we can directly measure the temperature and we can see that the climate is warmer. So the trees must have been enjoying the warm temperature, giving thicker rings. This is not seen in practice. The tree ring data shows a decline which does not make sense because we can directly measure the temperature. You are not addressing this issue.
@Bender: Incorrect analogy. The tree-ring data does not violate our “expectations”. It violates other pieces of stronger evidence. A proper analogy would be a heart-rate monitor machine which shows no pulse while the patient is clearly alive and talking.
Hee hee. Lecture me, Lothar. (This is gonna be fun.)
.
Please tell me why teh tree rings stopped being “reliable” after 1960.
@Bender: As far as I know, investigating why tree rings stopped to be reliable is one of the active areas of research. If you, me, or anyone else such as McIntyre, has ideas, they better submit to the related journals. I personally would not trust the opinions of a non-expert (i.e., McIntyre) in a not peer-reviewed medium (i.e., blog).
BTW, if you know relevant information please post a link.
@theduke: The tree-ring data is not infallible. Just like any other piece of evidence, you should constantly check it against all the other pieces of evidence. As far as I know, that was being done in the past.
You are dodging the point. Whatever caused divergence today could have caused it 1000 years ago. Any further dodging and I will say you are being willfully obtuse. Ok?
@Bender: One factor that is being investigated is pollution. 1000 years ago there was no pollution thus your statement is false.
@Jeff: See above.
pollution? Prove that “pollution” is affecting arctic treeline growth.
Prove that bristlecone pines right at treeline have an uptick in growth because of a lack of “pollution”, and those just metres downslope are suffering mightily from “pollution”. Read Salzer et al (2009) if you don;t get what I’m on about.
.
Pollution. This is getting good.
Lothar, this is called “special pleading” when you invoke a bogeyman explanation after the fact. When they discussed hiding the decline in the CRU emails they did not mention the need to do so because of “pollution”.
.
And before you say “acid rain”, search the blog …
@Bender:
Your quote: “Whatever caused divergence today could have caused it 1000 years ago.”
My answer: Pollution *could* have caused the divergence, therefore your statement is false.
You are setting up a strawman by claiming that I claimed pollution caused the divergence. This is silly, because, I have already mentioned that as far as I know nobody for sure knows why there is a divergence.
Lotharloo,
You really need to read a bit more on this site. We’re not exactly noobs about this topic.
There’s a huge, unproven, assumption in the principles of dendroclimatology: uniformitarianism. It is assumed to be true.
And now, divergences causes trouble. If it can diverge today, it could have diverged in the past. And can diverge in the future.
You are correct that nobody knows why there is a divergence. Which means nobody knows the answer to that question about the past.
We assume. And that’s the point.
Allow me to quote Terence Corcoran:
“What with sampling issues, missing data and other problems, by November of 1997 Mr. Briffa is struggling with results. While the Russian tree rings produce seemingly good results for past climate, results for the 20th century are a problem. On Nov. 3, he writes to Tom Wigley: “Equally important though is the leveling off of carbon uptake in the later 20th century.” The density of the tree rings also declines, a finding inconsistent with carbon-induced warming. “I have been agonizing for months that these results are not some statistical artifact of the analysis method, but I cannot see how.””
Any clues here as to why growth has slowed in some locations? What’s Briffa’s best guess? Pollution?
I read your comments before I posted, they don’t address my point but Bender’s doing a fine job so I’ll just read.
“If you, me, or anyone else such as McIntyre, has ideas, they better submit to the related journals. I personally would not trust the opinions of a non-expert (i.e., McIntyre) in a not peer-reviewed medium …”
The critical issue to emerge from the CRU email scandal is that there are no “peers”. Astoundingly, the world’s best climate review medium turns out to have been this very blog. Not only has Steve’s concerns turned out to be correct, but he is now the authority from which the Mann’s, Hansens, Jones’ etc must secure a tick of approval.
@Kimberley Cornish: I am sorry but I do not buy the conspiracy theory that all the climatologist are corrupt. I am not saying it is impossible, I am saying it more likely that pundits like McIntyre don’t get the details behind the scientific papers.
@MrPete:
The only significant underlying assumption is that the trees in the past are not genetically significantly different from those in the future.
Apart from that, I’m not sure why you say “assumed” to be true, as the “principle” can be tested and verified, through biological experiments. Actually, I don’t think things are considered to be that simple in real scientific papers. Probably the webpage contains a very simplified version of everything.
To explain this further, the tree-ring data is not a random sequence of numbers. It has some information. While a number different factors can contribute to the ring-width, the “width” is still a function of environmental factors, once you assume trees are not so different genetically.
Quit the dodge. If you want to agrue against the uniformitarian assumption by invoking a non-uniform factor such as “pollution”, then you are obliged to support that argument.
.
I have already given you a hint at what’s probably going on. And Briffa confirms that he shares the same hunch. If divergence is caused by this – and NOT pollution – then modern divergence should be paralleled by past divergences. In which case it is not justified to selectively remove data that doesn’t fit your hypothesis.
.
You’re not aducating anybody. And your logic is tortured. Bye.
@Bender: You are not making any sense.
1) I do not claim pollution is the cause. Pollution was used to refute your statement. Your statement still remain refuted.
2) Nobody cares about the hunches, or emails. Cite peer-reviewed materials if you want to claim something specific.
And on this:
“If divergence is caused by this – and NOT pollution – then modern divergence should be paralleled by past divergences. In which case it is not justified to selectively remove data that doesn’t fit your hypothesis.”
If this is the case, then the past data should be adjusted using the knowledge of the cause of the divergence. If you know factor X causes Y amount of divergence between the temperature and the ring-width, you adjust the graph by Y; you do not draw something which does not make sense.
Again, this boils down to my original criticism that you still dodge: that direct measurements of temperature are the most reliable pieces of data and using them cannot be blamed in this context.
Lothar, you are back-pedaling so fast you don’t know where you’re at. The issue here is not the instrumental record. It’s the comparison between modern instrumental vs. plaeolclimatic reconstruction. They diverge in modern times. You can’t delete the modern divergence without making the appropriate correction for historical divergences. You assert there might have been none. I ask you to prove that assertion. The principle of uniformitarianism works in my favor and against you. You have proven nothing. Whereas I have dismantled you. The uniformatiarian principle means that I do not need to explain the divergence; you do. You’re the one that wants to delete it when it suits your fancy.
I’m not back-pedaling. You’re just getting what was my position from the start, so I guess repeating myself a few times actually works.
Yes, the issue is the comparison. Yes, I say it *might* be the case that past tree-ring data do not have the divergence problem because we have a few other proxies to test the tree-ring data such as ice cores.
1. You can not wish away the tree-ring divergence problem. Did you not read Briffa in the CRU dump?
2. The other proxies, we can discuss those in apropriate threads. They all have problems. Did you read Tom Wigley in the CRU emails, to see what he thinks of Thompson’s precious ice cores? He corroborates the paper that Hu is writing. It’s junk.
1) Opinions (e.g., emails) do not matter.
2) I am not wishing away the divergence problem. Up there I acknowledge that it is a problem that is being worked out.
3) On “problems” of other proxies: Yes, science is neither easy nor straightforward. It is extremely detailed and it is not my job or your job to sift through the details. The peers are supposed to do that. And so far I have not seen the Mann papers retracted despite the enormous attention and scrutiny given to them. That implies, peers do not see substantial mistakes in their works. Of course, he can be proven wrong in the future, but until that happens, it constitutes our most uptodate knowledge (again, opinions and blog posts do not matter).
Hiding the decline by deleting the data was completely unjustified. It was a hideous deceipt.
Lothapoo says:
“Opinions (e.g., emails) do not matter.”
.
Umm, I eg to differ. I think the frank expert opinions of guys like Briffa and Wigley DO matter when it is smack in the middle of their area of expertise. And that is what you get in the emails I cite: frank and honest expert opinion favoring the paleoskeptical arguments on the legitimacy of “hiding the decline”.
Yes. Answer Bender’s question and then tell us how you know they did not become unreliable in, say, 1260 for a long period of time, thereby hding a steep rise in temperatures in that era.
theduke,
If Lothar had read the blog he would know the answer and he would stop posting and making himself look foolish to those who know better.
.
Lothar: there was a similar loss of sensitivity during the MWP. And because of that MWP temperatures are badly underestimated. Disprove me. Disprove the uniformitarian principle that the dendros like to invoke only when it suits their purpose. What’s that called again? Special pleading?
.
Teach me how to be smart like you, Lothar.
Bender has a new playmate.
It’s pretty obvious that if you can’t trust the trees over the recent hundred years you can’t trust the previous thousand. Lothar’s initial statement about reliability should invalidate Briffa’s MXD data.
His conclusions about ‘reasonable to eliminate’ wouldn’t pass muster in highschool science. The intent was to give a false impression of reliability to the HS plots and fool people into thinking they were looking at a temperature graph.
It’s official- willfully obtuse it is. Lothar, go to RC and high-five the Team. Maybe they’ll let you have a t-shirt.
-snip – don’t feed food fight
food fight
Here’s almost-turn-key for the Nature Trick http://signals.auditblogs.com/code/
I also updated the Hockey Stick code, http://signals.auditblogs.com/code-the-hockey-stick/
..and I figured out how the MBH99 CIs were computed(*)
Re: UC (Apr 1 04:27),
Wow! When are you going to reveal the secret?
Apr 1, 2011 🙂
38 Trackbacks
[…] to put some context into it, let’s go to Climate Audit and see how Jean over there explains the email from Phil Jones to Ray Bradley, Michael Mann, and Malcolm Hughes about changing the data […]
[…] Mike’s Nature trick […]
[…] The emails suggest that the authors manipulated and “massaged” the data to strengthen the case in favor of unprecedented CO2-forced AGW, and to suppress their own data if it called AGW into question. See for example emails 0938018124, 0843161829, 0939154709 (and the graphic here), and 0942777075 (and the discussion here). […]
[…] Climate Audit […]
[…] at the core of the issue. For more, here are some links to get you started. Story, Story, Blog, Blog, Blog. By David Paul, November 23, 2009, 6:56 pm […]
[…] the core of the issue. For more, here are some links to get you started. Story, Story, Blog, Blog, Blog, Blog. By David Paul, November 23, 2009, 7:18 pm […]
[…] Jones didn’t reveal the actual nature of the problem, and what was the trick. Climate Audit, a blog skeptical of global warming theory, has provided a neat visual demonstration of what the […]
[…] is the full email. Climate Audit did the analysis on Mike’s Nature Trick and put it into the correct context. (Due to the high […]
[…] The www is buzzing with discussions about the breech. Here’s a sample from Climate Audit. […]
[…] warrant for our scientific knowledge about historical temperatures. See the discussion by Jean S here, and posts by Steve McIntyre here and here. The emails contain many similar examples whose […]
[…] to the Jones’ trick, but different. (The Jones trick has been explained in previous CA posts here, here and consists of replacing the tree ring data with temperature data after 1960 – thereby […]
[…] 20 Nov 2009: Mike’s Nature trick […]
[…] […]
[…] Audit Steve Macintyre looks at Phil Jones and the "trick" Mike’s Nature trick Climate Audit The Trick Climate Audit and IPCC and "the trick" IPCC and the “Trick” […]
[…] Mann, of hockey stick fame and Mike’s Nature Trick” fame, has written a letter to the editor of The Wall Street Journal. You’ll see […]
[…] manipulación de datos, […]
[…] isn’t to determine whether there is abrupt climate change occurring. Given that Mann is known for using “tricks” to finesse his data, the National Science Foundation will not be pleased with the […]
[…] I wonder what the 1945 problem is? Read more here. […]
[…] discussion of these issues is at Climate Audit here here here and more recently by Jean S here. Jean S and UC report at CA that the puzzling end point properties can be replicated by replacing […]
[…] of East Anglia Norwich Email p.jones@xxxx.xxx NR4 7TJ UK Full explanation can be found here. And here's trying to circumvent the peer-review process… […]
[…] Weasel. Both Marc Morano at American Thinker and Coyote at Climate Skeptic, as well as Steve McIntyre at Watts Up With That?, demonstrate exactly the deception Jones and his colleagues were up to when they tried to hide the decline. […]
[…] Date: 25 Nov 2009, Jean S […]
[…] Verney-Caillat sur Rue89.com. Les sceptiques ont leur réponse. Jean S, sur le site ClimateAudit, montre des graphiques de diverses sources qui permettent d’illustrer les affirmations de manipulation de […]
[…] Eindeloos wordt er gefilosofeerd of deze “trick” nu kwade opzet behelst of dat het een gewiekste, maar integere zet is van een wetenschapper die een breinkraker oplost. Ook de onderzoekscommissie van het Britse parlement heeft zich hierover gebogen en Phil Jones vrijgepleit van bedrog (zie rapport). De essentie van Mike’s trick is al op 20 november 2009 uitputtend beschreven op Climateaudit.org (link). […]
[…] Date: 25 Nov 2009, Jean S […]
[…] Date: 25 Nov 2009, Jean S […]
[…] One version of the trick is used in IPCC TAR. In this version, Mann replaced post-1960 values of the Briffa reconstruction with instrumental values, then did a smooth, then truncated the Briffa reconstruction back to 1960. Post-1960 instrumental values affected the smooth by the arithmetic of the smoothing filter. The truncation of the Briffa reconstruction in IPCC TAR was first reported at CA in May 2005 here; the construction of the smooth in the IPCC diagram was dissected by Jean S and UC and reported at CA here. […]
[…] Mike’s Nature trick […]
[…] […]
[…] […]
[…] wonder how long it will take, if ever, before the likes of Oreskes, Michael Mann, James Hansen, Kevin Trenberth & Co. figure this […]
[…] Tricky graph: Climate Audit – Mike’s Nature trick […]
[…] […]
[…] lucrative government research grants worth millions. In particular, evidence reveals a statistical “trick…to hide the decline” in reliability of proxy data in Mann’s […]
[…] them were Michael Mann, Professor of Meteorology at Penn State, whom the emails revealed had been engaging in data manipulation to keep the blade on his famous hockey-stick graph, which had become an icon for those determined […]
[…] last 20 years (i.e. from 1981 onwards) and [sic] from 1961 for Keith’s to hide the decline,” wrote professor Phil Jones of University of East Anglia in an email to […]
[…] cast it’s veto and then the warmist arguments degraded to hiding the decline and doing “The Nature Trick.” Now we get The Great Global Cooling Scare of […]
[…] cast it’s veto and then the warmist arguments degraded to hiding the decline and doing “The Nature Trick.” Now we get The Great Global Cooling Scare of […]