In a recent post commenting on Rich Muller’s lecture of March 19, 2011 (here) – of which the Climategate portion is more or less the same as his Oct 14, 2010 lecture (online here), John Cook observes:
It’s clear that “Mike’s Nature trick” is quite separate to Keith Briffa’s “hide the decline”. Muller has taken different sections of Phil Jone’s emails and morphed them into a single phrase. To understand how this is a misleading characterisation, it’s helpful to examine exactly what “Mike’s Nature trick” and “hide the decline” refer to.
I agree that Mike’s Nature trick is different from what can perhaps call “Keith’s Science trick”. Jones’ WMO diagram is an unholy combination of the two tricks. The taxonomy of the various tricks has been the subject of many CA posts.
Mike’s Nature Trick
Mike’s Nature Trick was originally diagnosed by CA reader UC here and expounded in greater length (with Matlab code here ). It consists of the following elements:
1. A digital splice of proxy data up to 1980 with instrumental data to 1995 (MBH98), lengthened to 1998 (MBH99).
2. Smoothing with a Butterworth filter of 50 years in MBH98 (MBH99- 40 years) after padding with the mean instrumental value in the calibration period (0) for 100 years.
3. Discarding all values of the smooth after the end of the proxy period.
The splicing of instrumental data with proxy data prior to smoothing has been established by UC beyond any doubt (as will be reviewed below.)
Nonetheless, both Mann and Gavin Schmidt have vehemently denied such a splice.
Mann and Schmidt have denied the use of the method – see UC’s chronology here.
Some of their vehemence undoubtedly arises from Mann’s original and notorious denial of digital splicing of proxy and instrumental records as follows:
No researchers in this field have ever, to our knowledge, “grafted the thermometer record onto” any reconstruction. It is somewhat disappointing to find this specious claim (which we usually find originating from industry-funded climate disinformation websites) appearing in this forum. Most proxy reconstructions end somewhere around 1980, for the reasons discussed above. Often, as in the comparisons we show on this site, the instrumental record (which extends to present) is shown along with the reconstructions, and clearly distinguished from them (e.g. highlighted in red as here).
In the wake of Climategate, Gavin Schmidt staunchly denied digital splicing e.g. here A reader had written in, accurately observing that Mann had spliced instrumental values prior to smoothing:
I don’t think the Nature trick has been described adequately in your post. It isn’t just graphing the instrument record for comparison, but graphing it to ‘hide the decline.’ They didn’t just cut off the proxy value and add on the instrument record from 1961 on; they used the instrument temperature values to calculate smoothed average value for earlier years as well. That is the ‘trick,’ to let the instrument record replace actual values of the data that are lower than you want.
Gavin responded with the disinformation that has become standard:
[Response: This has nothing to do with Mann’s Nature article. The 50-year smooth in figure 5b is only of the reconstruction, not the instrumental data. – gavin]
First, here is the relevant figure from MBH99. Note the closing portion of the smoothed reconstruction with a sort of upside-down S-shape at the end.
Next, on the left is a blowup of the latter part of the above graph.
The overprinted yellow line is a virtually exact emulation of the MBH smooth series: this was obtained by splicing instrumental data from 1981 to 1998 with proxy data up to 1980, followed by truncation after smoothing. (Here to about 1953.) On the right is a graphic also showing the smooth following Mann’s style without splicing instrumental data after 1980.

|

|
Left – Excerpt from MBH99 Figure 3 showing emulation of Mannian smooth with spliced instrumental record. Right – also showing (black) the smooth without an instrumental splice.
The trick is clearer in MBH99. The graphic in MBH98 (Nature) is much muddier and doesn’t show the trick as clearly. First, here is the (rather muddy) graphic from MBH98 showing the smooth:

Next, on the left is a blowup of the latter part of the above graph. The overprinted yellow line is an exact emulation of the MBH smooth obtained by splicing instrumental data after 1980 with proxy data up to 1980, followed by truncation after smoothing. (Here to about 1953.) If Mann had not spliced instrumental data after 1980, the smoothed series (following his methodology) would have looked like the version on the right – the orange line showing the result without the instrumental splice.

|

|
Although Mann and others have regularly described his “Nature” trick as nothing more than plotting both instrumental and reconstruction data in the same graphic, the “trick” was more than that: it was, as shown above, the splicing of instrumental data with proxy data prior to smoothing. On one occasion however, Mann implictly conceded the Climate Audit exegesis of his Nature trick, stating in an inline comment at realclimate as follows:
In some earlier work though (Mann et al, 1999), the boundary condition for the smoothed curve (at 1980) was determined by padding with the mean of the subsequent data (taken from the instrumental record).
From the precision of the emulation, it appears certain to me that the padding was by the instrumental data (rather than the mean of the subsequent data), but either method involves padding with instrumental data.
Far more serious than “Mike’s Nature trick” is Keith’s Science Trick – the deletion of adverse data (a trick that Mann supported as a Lead Author in IPCC TAR.)
[Note – this section was somewhat rewritten on Sep 5, 2012 adding the figure excerpts in response to a request for clarification of the various tricks.]
Keith’s Science Trick
“Keith’s Science Trick” is first used in May 1999 in Briffa and Osborn (Science 1999) and Jones et al (Rev Geophys 1999). It is nothing more than the deletion of data to hide the decline. The deletion of adverse data to hide the decline was first reported at CA in 2005 here in connection with IPCC TAR spaghetti graph.
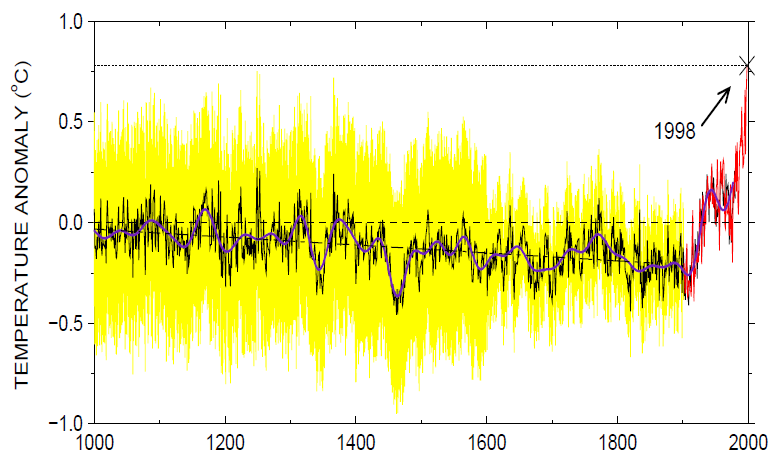
In the wake of Climategate, prior incidents of hiding the decline were discussed, including recent analyses of Briffa and Osborn (Science 1999) e.g. here. Following is a graphic showing Keith’s Science Trick – the deletion of adverse data – a practice continued in subsequent spaghetti graphs, including those in IPCC TAR and IPCC AR4.

Figure 2. Annotated version of Briffa and Osborn Science 1999 Figure 1 – see recent posts for derivation.
The Briffa Bodge
The Climategate documents included programs by Tim Osborn and Ian Harris, describing “fudge factors” or “very artificial corrections for decline” e.g. http://di2.nu/foia/harris-tree/briffa_sep98_e.pro. In a submission to the UK Parliamentary Committee, Tim Osborn denied that he had used ‘artificial corrections for [the] decline” in his published articles. While Osborn himself may not have used “artificial corrections”, Osborn carefully did not comment on whether other CRU scientists had used such “artificial corrections”. Briffa’s Tornetrask reconstruction (prominent in several multiproxy reconstructions) had received precisely this sort of adjustment – called the “Briffa bodge”.
In the narrowest sense, Osborn did not use the Briffa bodge (or similar artificial correction) to hide the decline in his articles published after September 1998 (the date of the annotation in the program briffa_sep98_e.pro.) Instead, CRU used Keith’s Science Trick – the deletion of data – to hide the decline.
Phil’s Combo Trick
Phil’s Combo Trick, as others e.g. Hu McCulloch have observed, is a combination of Keith’s Science Trick and Mike’s Nature Trick, leading to a particularly grotesque result.
Values of the Briffa reconstruction were deleted after 1960 (Keith’s Science Trick) and spliced with instrumental data prior to smoothing (Mike’s Nature Trick). But, unlike Mann, Jones didn’t peel the smooth back to the end date of the proxy data.
Cook
Cook’s article has a considerable amount of disinformation about proxy reconstructions, not all of which will be canvassed in this note.
Cook observes:
There is no “decline” in Mann’s reconstructions. As we shall examine shortly, the source of “the decline” come from temperature reconstructions calculated from tree-ring density at high northern latitudes (Briffa 1998). There are very few of these in Mann’s proxy data and hence his reconstructions never required removal of any declining tree-ring density.
As is well known, the long portion of the MBH98-99 reconstruction is little more than an alter ego for bristlecone chronologies and did not “require” removal of the decline. However, Mann et al 2008 contained many (over 90) Briffa MXD series. They deleted actual data after 1960 and replaced it with RegEM data – with the spliced data being used to supposedly demonstrate the statistical significance of the proxy population.
I disagree with Cook’s assertion that the decline was properly disclosed in spaghetti graphs in either IPCC or academic literature. The decline itself was indeed reported in early Briffa articles – indeed, I used these articles to first detect the deletion of adverse data in IPCC TAR – see here.
However, the adverse data was deleted in all spaghetti graphs comparing reconstructions in academic literature and in IPCC reports to policy-makers and the public. This practice should have been disowned by the climate community long ago.
I agree with Cook’s closing paragraph:
Thus it’s clear that “Mike’s Nature trick” has nothing to do with Briffa’s “decline”. There is no “decline” in Mann et al 1998 and Mann et al 1999. To conflate two separate techniques via the phrase “Mike’s Nature trick to hide the decline” is adding to the glut of ‘Climategate’ misinformation.
Yes, indeed. Mike’s Nature Trick and Keith’s Science Trick are two different tricks. Neither practice should be condoned. If I were judging the two as a sort of reverse beauty contest, I would rank Keith’s Science Trick as the most unacceptable.


60 Comments
Mr. McIntyre;
I greatly appreciate this overview article, and the naming of the different devilish practices.
Thanks for the clear statement of position.
Everyone has a point of view, but not everyone is candid about it.
Your leadership in this regard is worthy of emulation.
RR
Thanks for clearing this up, Steve.
Berkeley physicist Richard Muller unfortunately confounds the two tricks, but his video at http://wattsupwiththat.com/2011/03/18/you%e2%80%99re-not-allowed-to-do-this-in-science/ is still great viewing! Your post demolishes Cook’s critique of the Muller video at http://www.skepticalscience.com/Muller-Misinformation-1-confusing-Mikes-trick-with-hide-the-decline.html .
So what is the status on getting/having got
a.) the data they claim to have used to create their graphs (of which I count 4 graphs)
b.) minimally an explanation of the code they used to created them?
That would be their defense. Or are we still trapped in the FOI cycle?
Steve — Can you recommend a CA post or two on the “Briffa Bodge”? The search engine doesn’t turn up much. Thanks!
Steve: A couple of articles are tagged:https://climateaudit.org/tag/bodge/. The first describes the original Briffa bodge (though the term was not known to me at the time.) The term “bodge” is first used in comments about Yamal just before Climategate – it is used in Melvin and Briffa 2008. I did a lengthy draft post on the topic in July 2010 in the wake of Muir Russell but did not publish it. I’ll return to it as it has good material.
Thanks — These go way back to the first year of CA!
Unfortunately, the figures in https://climateaudit.org/2005/04/02/modern-sample-bias-rcs-and-briffas-adjustment/ got disconnected in the WordPress conversion. Any chance they could be relinked?
Here’s another good post on the Briffa Bodge: “New Light on Old Fudge”, https://climateaudit.org/2007/05/26/new-light-on-old-fudge/ .
It’s getting increasingly hard to remember which Team trick is which. Since the CA search engine does a good job of finding article titles, would it be possible to create a new post on “The Briffa Bodge” with nothing much in it except links to these three vintage articles for the benefit of newcomers, and as a place to discuss this early and infuential “trick”?
Indeed. Looks like there has been trick ‘stacking’ and tricks within tricks.
What great articles these are and thanks for posting this link Hu. To me these read like brand new articles.
Re: Hu McCulloch (Mar 30 11:25),
Thanks, Hu. It’s remarkable this bodged horror is still being taken seriously by the CS “community.”
Steve, did Grudd ever archive his data? I can see why Briffa wants it kept private!
Bah. I used to think Briffa was something of a real scientist. No more. He may have private conscience twinges, but always, always toes the Team line in public.
Steve – I have a digital version of Grudd.
Re: Peter D. Tillman (Mar 30 12:27),
Rereading https://climateaudit.org/2005/03/27/briffas-tornetrask-reconstruction/ ,
I see this explanation for Briffa’s adjustment, from “Steve” (Mosher?):
It’s worse than we thought. Pure wish-fulfillment fantasy. Utterly indefensible, sfaict. This is science???
What will be interesting to watch is how the Team works their data to continue t support their preferred position of global warming in light of the actual cooling of the planet – cooling oceans, atmosphere, increased snowfalls and polar ice mass . . .
There is reality as Mother Nature does and then there are the computer models and artificial projections from the Team.
What will they do to bridge their reality gap?
Guys
This may not be a welcome email. By way of background, I am a physics graduate (many years ago) and have no grounding in climate science – effectively I am a laymen – other than what my son told me from his Environmental Geosciences degree from Edinburgh University (where it seems the professional staff are clearly pro-AWP). I am firmly a climate change sceptic (ie an open-minded disbeliever in catastrophic climate change) and I have no doubt whatsoever that Mann et al have manipulated their data for their own ends. I also have no doubt that this is also the case for the IPCC and I have recently been stunned by Pachauri’s comments of (thermal) sea level rises increasing the effect of the recent Japanese tsunami.
However, it seems to me that you are attempting to dance on the proverbial head of the pin. There is no doubt about the hide the decline scandal, the CRU email deletions etc. However, this does not matter a jot. You are expending huge time and effort attempting to prove what is obvious and, to the lay world (of voters and taxpayers) as a whole, this is a trivial (or irrelevant) issue.
In my view, what is needed is a way of convincing the world – and in particular the legislatures – that their approach to reducing CO2 emissions will send us back to the Stone Age. Today we have the EU wanting to ban cars from cities – as if that would make any difference to anything!
Despite my admiration for you and your efforts to seek the truth, it seems to me that what is actually needed is to knock down the AWP towers particularly as far as legislatures are concerned. They need to be made to know that their policies will simply be a waste of billions of dollars/pounds/euros and they must be made to realise this.
Consequently, although I can understand your desire to grind Mann, Briffa, Jones et al into the dust – they deserve it – this will not do anything to improve the lot of humanity. What we need is for you (and your like-minded professional colleagues) to use your efforts in two arenas – firstly in the lay arena to help to educate lay people about the current known science (and its limitations) and to guide them about false prophets, Secondly, you need to become involved in the political arena – I personally don’t want huge amounts of my tax pounds funding inefficient and unnecessary wind farms.
To be honest – great spaghetti graphs but – at the end of the day – what does this do for us? Let’s all get on (or create) the right bandwagon.
Steve said the following in 2005 and I believe it is still true …
“Today we have the EU wanting to ban cars from cities – as if that would make any difference to anything!”
This is a absurd statement. Of course it would make a great difference to many things. Consider, if applied universally, it would save t he US importing most of the six million barrels of oil a day consumed to run the car and light vehicle fleet — mostly in cities.
And why is it such a great idea to use a noisy, pollution-creating, ton-and-a-half mobile living room with leather arm-chairs and a 200-horse-power motor to haul some commuter’s arse across town at an average speed of about eight miles an hour. As a physicist, I would have thought you could have come up with a better idea!
Whatever the reality or otherwise of AGW, it is evident that most of the energy we use is wasted in ways that demonstrate the remarkably incompetent engineering of the modern world.
snip – policy
snip – policy discussion
Re: Speed (Mar 29 11:33),
Kim Swain,
The last thing we need on a site like this is people urging us to get on a “band wagon”. There are a myriad of politically oriented sites carrying out their particular propaganda wars and pep rallies for their causes. The cause of this site centres around good science in the area of paleoclimatology. The issue of relevance with respect to political action on possible climate change is necessarily irrelevant. That is the very strength of this site and the influence of Steve McIntyre. By sticking to his area of developed expertise, Steve’s reputation is almost unassailable by his critics. Too many in this field have wandered away from their field of expertise and left themselves open to ridicule.
Pointing out the ‘tricks’ used to circumvent inclement facts by the giants of modern climatology is far from being an abstruse activity. It is one of the most important pieces of scientific detective work ever undertaken. The work that Steve is doing in decoding and documenting the tricks is extraordinary.
Kim:
I think that you misread the purpose of Steve’s efforts – they are simply to ensure the integrity and rigor of scientific work in the area of paleoclimatology and dendrochronology in particular. It is truly amazing the extent to which Steve and his colleagues have changed the norms around the analysis and archiving of data in this area.
The current deconstruction of the inappropriate data manipulations will undoubtedly change the behavior of contributors to the next IPCC report.
Your policy concerns are better addressed at WUWT and other skeptical sites.
In many ways, science and academia are broken (see McCullough and McKitrick https://climateaudit.org/2009/02/18/mccullough-and-mckitrick-on-due-diligence/ ).
I think the intent is to insist that the work be done properly. In the long run, that has to be the goal. If the science is done properly, we can then argue about the politics and economics from an accurate base.
Don’t try to minimze the importance of getting it right. Fundamentals matter. When the fundamentals are ignored, all kinds of messes get created.
Kim
I think this is some of the education that you are speaking of. You now have to spread it and quote it. You will know this is correct if you try post a reference on an AGW site.
Re: Kim Swain (Mar 29 11:06),
I am impresed by the clear evidence of the shear multiplicity of methods of trickery and deception, together with the multiplicity of separate individuals involved in developing these separate treacherous techniques. It is only by meticulous exposure of the number of men involved that one can realize how entrenched and preconceived their aganda to “prove” AGW really is. Sadly the continued utterances of Schmidt and Mann et al at Real climate and elsewhere shows how neccessary it is to bring facts into the open, and gradually improve insight.
I hail from Edinburgh University (some time back) and would adjure Kim Swain to bear these points in mind when considering Steve’s dissections of the matter. Maybe Kim S could persuade his son’s geoscience tutors to give CA serious consideration! (assuming his son has not been suborned already.)
I do agree with Kim S however that Steve’s field of fire is very narrow and to this extent sometimes appears to dance on a pinhead. If he could be persuaded to examine even wider aspects of the “consensus science”, I am sure we would find that this preconceived agaenda lies ready for exposure in many other fields. But how much can one retired statistican do, despite his heavy oily and greasy funding. I note that despite this oily largesse he has actually had to take on odd temporary contracts over the recent years! Truly if he had gross oily support or better still Government funding he could very adequately and advantageously direct a broader range of critical reappraisals of what the consensus has been up to! Finding personnel to join him would be difficult because the young scientific career is still so dependent on towing the line. Steve’s brain however seems born to the task!
I doubt if you’ll ever persuade Steve to take up public political cudgels!
I couldn’t disagree more.
What Steve et al have shown is that research purported to show modern warming as unprecedented in the last 1000-2000 years is seriously lacking. And without that precedence, modern warming can’t be taken as anything other than within the range of natural variability.
Proxies of any kind are, IMHO, given much more weight and accuracy than they deserve. Sure, they’re all we have, but we have to be honest about how much they really tell us. It is extremely clear to me that without the use of stripbark Bristlecones in a small part of the Southwestern US, one tree in Yamal, and inverted Finnish varve data, there is no unprecedented warming, at all. This IS the main crux of the AGW machine, period.
Please – no more pontificating on the purpose of the blog or whether I should be doing something else. Readers who are interested in other topics are free to read other blogs.
Indeed. I have read CA and other climate blogs far less in the past few weeks but this is such a helpful summary to come back to. Thanks as usual.
Steve, I didn’t do either of those things. I was pointing out what your work has shown me. If I’m wrong, I stand corrected.
Steve, good concise summary. The variety of tricks used and the use of smoothing to tidy-up the splice(s) have not been fully examined outside of CA. Dr. Muller will be testifying before Congress in 2 days about the process of climate science. I hope he reads this post before testifying. If anyone out there knows Muller, they might want to send him a link (it does appear that he has read CA in the past).
Knocking out individual bricks eventually leads to the collapse of the wall.
Steve thanks for this detailed post. I read the account in Sceptical Science and was amazed at the scale of subterfuge and jesuitical argufying going on. The fact that Dhogaza weighed in at one point was enough to confirm me in my belief that sleight of hand was being exercised. Romm and the team really have Muller in their sights at the moment and a bystander can only wonder why. Every reference to BEST includes “financed by Koch” in one of those stupid attempts to smear people.
Kim Swain – are you aware of Climnate etc. n It nis gradually building up a powerful head of steam by bringing together groups from both sides of the “debate”. This site is invaluable for showing the lengths to which the IPCC crowd have gone to mislead the public. For this purpose, forensic and obsessive attention to detail is mandatory. It is clear that the IPCC does not possess such rigour.
You say, in regards to Mann’s 11/09 RC comments at http://www.realclimate.org/?comments_popup=1853#comment-143623 ,
While the Schmidt statement is untrue, Mann’s admission here to have padded the reconstruction with the instrumental data before smoothing amounts to a confession of what you and UC have been charging.
In fuller context:
Perhaps his more recent approach of double-flip endpegging looks more like the published graph than his stated method does. However, the relevant portion of the figure he provides is almost completely obliterated by the annual instrumental series overlain in red, so it’s hard to tell.
In light of this, perhaps an additional distinction should now be added between “Mike’s Old Nature Trick” and “Mike’s New MR Trick” (for Minimum Roughness). His New MR Trick makes the Old Nature Trick superfluous — until an inconveniently cold year shows up, as we have seen on occasion!
In Phil’s Grand Combo WMO Trick, how does he endpad the graphs? Is he actually combining all three tricks?
Mann:
Rephrasing this,
“It is somewhat disappointing to find this specious claim (which we will herewithin speciously claim originated from industry-funded climate disinformation websites) appearing in this forum.”
Let us not overlook that Mann’s statement may simply be complaining that such a claim “appeared in the [RealClimate] forum”! How DARE anyone make such a claim at RC.
The practical man naturally enquires “if they had good data that proved their point why would they bother doctoring it?”.
I do disagree with Ken Swain’s proposed objective for this blog. What Steve Mc and contributors have done here and continue to remain focused on is a spectacular acheivement from this layman’s point of view. I have learned so much. For me the “tricks” described here were never obvious. In fact I would never have figured any of this out by myself. Steve Mc’s high integrity and specific focus remain extremely important. Moreover, the importance of methodically and fully flushing out these “tricks” can not be overstated. This is still science. It just ain’t pretty! But it remains important.
In some earlier work though (Mann et al, 1999), the boundary condition for the smoothed curve (at 1980) was determined by padding with the mean of the subsequent data (taken from the instrumental record).
These inline comments by Mann and Schmidt are untrue.
What is untrue about this statement? It looks like he was making a weaselly non-admission admission. Padding with the mean of the instrumental period, is close to splicing and smoothing. Have you ruled out that this was not done?
Steve – as I said in the discussion, MBH98 and MBH99 padded after 1980 with actual temperatures, not the mean of the instrumental period .
Using actual temperatures is the same as taking data from the instrumental period. So the only error you are claiming by Mann in that statement is that he claims to use the mean, and you say he used the individual data points. Is that right?
I’m wondering how you can be so sure of this.
The average GISTEMP from 81-95 is .212, while 1981 is .26. Are you able to detect a difference of .05 which is much smaller as weighted in the filter?
I realize this wouldn’t be the specific temperature set being used, but I would expect the same effect.
For that matter padded with the mean of the instrumental period, could mean padded with a running mean.
Any further analysis of DeepClimate’s rejection of Mike’s Nature trick in TAR? http://deepclimate.org/2010/06/29/revisiting-tar-figure-2-21-part-1-another-false-claim-from-steve-mcintyre/
Waiting for part 2 🙂 The discussion kind of ended too early on
I’m still waiting for part 2 as well UC. I think DC was going to use part 2 to supposedly explain the offset used for the Briffa series in the TAR. Have you been able to deduce an explanation?
If DC ever does get around to posting part 2, it will be an interesting discussion comparing the TAR graph caption describing the stated methods of calibration, smoothing, endpoint padding with the methods actually used for each series in your replications.
I would say Mike’s Nature trick is the worse of the two. They deleted data to get an agreement with other charts, but the overall chart is still increasing, if you add both parts back in.
Mike’s Nature trick doesn’t hide a decline, it artifically creates an incline at the end. Given that the incline’s relative size is what is so important for the hockey stick graphs, this is the worse feature.
The IPCC is tasked with performing a root cause failure analysis of the Earth’s global thermostat (to borrow a term from Willis Eschenbach). The way to prove that a thermostat is broken is to show a long stretch of normal operation, followed by an anomalous excursion representing the failure. The attempt to show just that from hopelessly messy proxy data – a “nice, tidy picture”- is now called the Hockey Stick. Contrary to most stated opinions, the Hockey Stick matters. If your best efforts fall well short of conclusively showing that a (thermostat) failure has occurred, performing a root cause analysis is a perilous undertaking. How do you do “attribution” of failure to a root cause by reductionist logic if you are unsure whether the data you are trying to explain even represents failure? Climate science remains firmly mired in block 1 of the root cause process, which is where you validate that a failure has occurred. The tricks and bodges all have the common purpose of showing that the thermostat is broken.
I wish Mann would sue me for writing The Hockey Stick Blues…my company could use the publicity.
http://www.gather.com/viewVideo.action?id=11821949021918437
The “Briffa Bodge” is new to me. Perhaps I have misunderstood it, but at first sight the apparent quotations from Climate Dynamics are quite astonishing. At least this “bodge” was fairly clearly disclosed, but the supposed justification is extraordinary.
Yup. While the bodge was disclosed in the original article, when the Tornestrask series was used in multiproxy studies (the ones used by IPCC), the bodging of one of the key series wasn’t reported in the multiproxy article. Nor was there any allowance in the calculation of uncertainties for the existence of the bodge.
A Tornetrask series is used in every multiproxy reconstruction,
In the Jones et al 1998 reconstruction, there were only three series in the medieval portion: the bodged Tornetrask series, the Polar Urals MXD series (also in the Briffa MXD reconstruction) and a Greenland ice core series that has little centennial variability.
Reading up on more valuable CA threads through the years. Can anyone comment or point me to the most up-to-date understanding of some of these “tricks” and the “Briffa bodge” etc.? Mann and friends don’t seem to correct or update much of anything in a forthright manner, but is any of the “record” being corrected quietly or even surreptitiously? I found this timeline helpful:
Isn’t the confusion because Jones said he used Mike’s Nature trick on both Mike’s and Briffa’s series? They very well could be two techniques, but didn’t Jones do the Nature trick on Mann’s data and then apply the same technique on Briffa’s data where he had to remove the decline before applying the trick?
Am I wrong?
Then again, maybe it’s just that people think Mann hid the decline, when it was Briffa and Jones.
“Reverse beauty contest” is a nice phrase.
Mirror mirror on the wall, which climate scientist’s mind is the foulest of all?
I have now obtained a copy of Briffa et al. Clim. Dyn. (1992), and Steve’s summary extracts from the text posted at Briffa’s Tornetrask Reconstruction seem fair to me (there are as couple of minor typos, and he has interpolated some commentary in square brackets).
Steve’s point about disclosure in subsequent articles is an excellent one. While the original article is completely open (both in the main text and in the caption to Fig. 7) about the nature of the ‘correction’ (to use their own words, scare quotes in the original), it is difficult or impossible to ensure that subsequent articles which rely on this ‘correction’ report its nature accurately. This is, of course, the reason why it is best to avoid such ‘corrections’ as far as possible.
Steve: the reconstruction that is most dependent on the Briffa bodge is Jones (Briffa) et al 1998. The Briffa bodge is discussed in the Muir Russell report, who condemned critics (i.e. me) for objecting to it. I drafted a post on this last July – one that I didn’t quite finish. I’ll look at it again and see if I can finish it.
Steve and others, not really wanting to add any burdens for all of you far more worthy to comment than I am, but only to say that I find some of the exchanges prompted by Rob Wilson’s visit to Bishop Hill to be intriguing. For those of us relatively new and/or inexpert this is proving to be an “interesting” thread even if awfully disjointed and chaotic:
http://www.bishop-hill.net/blog/2012/11/26/lonely-old-mann.html
Comments certainly illustrate some of the variety of interests and agendas people bring to these discussions.
second link is broken, https://climateaudit.org/2009/11/20/mike%E2%80%99s-nature-trick/
I’ve moved the relevant posts to CA :
Maybe Schmidt didn’t know about Mike’s trick ? I think MBH99 smooth uses mean of instrumental, so Mann’s comment seems to be true. MBH98 smooth seems to be padded with instrumental itself ( the Nature trick ) but it is interesting that Mann mentions MBH99 in that comment. MBH98 would be inconvenient to mention after the Schmidt comment?
UC, How can you tell the difference just looking at the charts whether they are padded with mean of instrumental or actual instrumental?
I just go them through pixel by pixel,
MBH98:

MBH99:

Of course, this doesn’t proof anything, my overlay scaling might be wrong etc.
See also
http://www.reproducibleresearch.net/index.php/How_to , items 5 and 6
Thanks.
Looking at Mann’s statement again, I don’t see anything untrue there. He was referring to Mann 99. He made the statement in a way that was true while looking like he wasn’t conceding the point.
Stephen, you are doing an amazing job of crawling through the detail of data analyses, that deserves acknowledgement even by people who think your conclusions are incorrect. You are patient.
One thing that jumps out at me is the huge divergence of the deleted data (pink line) at both ends. Doesn’t the early part (pre 1550?) call into question at least the validity of the entire data set? Yet if I understand correctly it was used for the time period in which it was close to other data. IOW, one shouldn’t selectively use data just because it is close to other sources.
Mind, if the gray area in your March 29, 2011 post is an uncertainty estimate of the Mann data, I question the whole process. Not being knowledgeable on such statistical analysis, I am extremely wary of data where the magnitude of variation exceeds the potential trend being looked for , as I’ve long noted about human-measured Arctic temperature data.
Here is an interesting graph that might explain the divergence problem in Briffa’s data. Consider that Briffa’s data is not a proxy for temperature, rather it is a proxy for solar activity. Solar activity peaked in 1980, the same time Briffa’s data peaked.
Here is another interesting graph : http://img4.imageshack.us/img4/7853/anomch.jpg
Anomalies de fonte (3 glaciers) : Huss et al. 2009. Densité des cernes : 70 swiss MXD series from Schweingruber.
Very interesting — The graph is titled april-sept temperature anomalies for Switzerland. The red line is the official instrumental series, the orange line ending around 1970 is “ring density,” presumably the 70 Schweingruber Swiss MXD series mentioned by phi, the green line is “melt anomaly”, presumably from the Huss article on glacial melting, and the blue line is the “instrumental series with a correction of -1.5dC per century since 1890”.
Is this your own graph, phi, or is it from Huss or some other souce?
Anyway, the red instrumental temperatures don’t correlate well with the orange MXD series by themselves, so the blue line “corrects” the instrumental series with a constant time trend.
First, it’s odd to be correcting the thermometer record to conform to the MXD (and melt) record rather than the other way around. The melt record only boes back to about 1920, but presumably MXD goes back centuries if not millenia. If the early portion of MXD is fairly flat, this “correction” implies that mercury thermometers that hadn’t been calibrated to treerings would have been reading about 15dC lower in 1000 AD than during the 20th century.
Alternatively, if the instrumental series is taken as the more valid, a flat MXD series would imply that actual temperatures in 1000 AD were about 15dC warmer than during the 20th century. A Medieval Sauna Period!
The glaring divergence between MXD and the actual temperature series could be at least partially explained without an ad hoc time trend by introducing CO2 into the relationship. But then there would be a lot more uncertainty to the correlation with temperature.
The stronger correlation of the green melt series to the orange MXD series than to the red instrumental series is perplexing. Perhaps melt responds to long-wave GHG radiation differently than to solar radiation or to air temperature itself? Just a guess.
Back to the topic of this thread, does the orange MXD series really end in 1970, or was it truncated there per Keith’s Science Trick to Hide an inconvenient Decline?
Hu McCulloch
Thank you for the clarification in english. I am very bad in that language but I’ll try to clarify few points (with some help of google).
Correcting the instrumental series rather than MXD and melt anomaly is quite normal for the following reasons:
1. Of the 3 series, two are consistent. It is therefore more logical to correct one set than two.
2. We have no specific reasons to correct the melt anomalies and MXD while we have a good quantity which encourages us to do so for instrumental data. Thinking a singular event caused the fall of MXD since 1960 is very strange and unsupported. The explanation of Huss et al. for the divergence of melting by shortwave is also vague and unproven. In addition, the physical phenomena involved in both cases are very different and it would be surprising that bias of completely different nature affect parallely trees and glaciers.
3. Official data are adjusted upward by 0.5 ° C per century to remove discontinuities. These adjustments should be broadly neutral and we have no reasonable explanation for this bias. These data are not reliable.
4. We know that disruption of the stations (UHI and local effects of urbanization) are not taken into account but have a significant effect.
5. UAH (and RSS) TLT for land in the northern hemisphere trend is so colder than 1 °C per century over CRUTEM while the hot spot effect should cause an opposite trend.
I used the example of Switzerland for the wonderful proxy of Huss and al but the issue is the same at least for all land in the northern hemisphere (comparison CRUTEM HN and Schweingruber entire collection). The only difference is that the divergence is 1 °C per century since 1920.
Note : the curves are weighted averages over 10 years.
I gather that you did construct this graph yourself, in order to compare the Huss glacier melt series to the Swiss Schweingruber MXD series and Swiss instrumental series.
I see now that I misread the graph in my previous post — the orange Schweingruber MXD series continues to about 1994, and so is not truncated.
It’s odd that this narrowly Swiss MXD series does not tank after 1960 the way Briffa’s broader series does. Instead, its “divergence problem” is entirely pre-1940.
But still, while it’s true that even instrumental temperatures have potential problems, “bodging” the instrumental series to fit MXD is a novel way of hiding a divergence!
“It’s odd that this narrowly Swiss MXD series does not tank after 1960 the way Briffa’s broader series does. Instead, its “divergence problem” is entirely pre-1940.”
The problem of divergence is perhaps a little more complicated than that. Depending on how you calibrate the MXD (linear relationship), the difference may seem to appear at any particular date. As I said earlier, for the full Schweingruber collection (http://noconsensus.files.wordpress.com/2009/11/before-and-after1.jpg?w=553&h=368) this divergence seems to appear as early as 1920 and not 1960.
“But still, while it’s true that even instrumental temperatures have potential problems, “bodging” the instrumental series to fit MXD is a novel way of hiding a divergence!”
That is the question, hide a MXD decline or correct an instruments bias ?
Take the issue from another angle : the melting anomalies are they a good proxy for temperature ?
Huss uses in his paper the station of Davos for reference, he compares the melting anomalies with homogenized temperatures. It should be noted that homogenization adjustments allow to obtain a good signal for high frequency to the detriment of long-term trends. However, this is what gives the comparison of melting anomalies with Davos raw temperatures : http://img837.imageshack.us/img837/5687/fontea.jpg
The curve “homogénéisation partielle” take correctly into account two adjustments (but not all).
Melting anomalies are in fact a good proxy for temperatures. And the decline which is hidden is the temperatures one.
Re: Science mag. and climate science
A WUWT comment notes that recently Science mag. got a new Editor who is a geophysicist with interest in statistics. While direct repudiations of past failures may be too much to hope for, there may be more receptivity there to independent statistical perspectives??
Why are flashy journals like Nature and Science so resistant to sound ethical practices, such as publication of corrections and critical comments?
Here is a fascinating (non-climate) episode which shows Nature editors unwilling to allow correction of fundamental errors in “the record” of their journal:
http://retractionwatch.wordpress.com/2013/06/19/why-i-retracted-my-nature-paper-a-guest-post-from-david-vaux-about-correcting-the-scientific-record/#more-14664
9 Trackbacks
[…] how did they hide this real data? Well, there are a series of now infamous graphs and studies which actaully ‘hid’ the long term temperature data which supported the weather balloon […]
[…] Glossing over the implications of the divergence problem post 1960 (and of the other divergence problem, which wasn’t mentioned at all). The implication of these two issues is that tree ring data […]
[…] Clearly, there’s more to tree growth than a simple linear relationship with temperature, and this finding shows an inverse relation with temperature to tree height. Maybe this is why Briffa had to truncate uncooperative tree ring data post 1960 and Mike’s Nature trick was used to “hide the decline”. […]
[…] Clearly, there’s more to tree growth than a simple linear relationship with temperature, and this finding shows an inverse relation with temperature to tree height. Maybe this is why Briffa had to truncate uncooperative tree ring data post 1960 and Mike’s Nature trick was used to “hide the decline”. […]
[…] Clearly, there’s more to tree growth than a simple linear relationship with temperature, and this finding shows an inverse relation with temperature to tree height. Maybe this is why Briffa had to truncate uncooperative tree ring data post 1960 and Mike’s Nature trick was used to “hide the decline”. […]
[…] 1.0 is self summarized by the famous line: Mike’s Nature trick … to hide the […]
[…] {Note: also see IPCC and the Trick, Keith’s Science Trick, Mike’s Nature Trick and Phil’s Combo […]
[…] Marcott et al. used Michael Mann’s hockey stick trick to co-join two data sets of very different resolutions to come up with the spike, in other words […]
[…] There are important issues in connection with the Mann corpus. This is not one of them. Too often, Mann’s opponents make irrelevant and easily rebutted criticisms. Unfortunately, this makes it easier for Mann to avoid more substantive criticisms. For a full explication of the differences between the various incidents, I refer people to the following CA post: https://climateaudit.org/2011/03/29/keiths-science-trick-mikes-nature-trick-and-phils-combo/ […]