NASA blogger Gavin Schmidt has once again fabricated claims against Climate Audit’s posts on bucket adjustments.
CA readers are aware that I discussed bucket adjustments on a number of occasions long before Thompson et al 2008, in particular, questioning the absurd IPCC assumption that all SST measurements switched from buckets to engine inlet on the day after Pearl Harbour. In March 2007, a year before Thompson et al 2007, in light of new historical information bucket usage, I provided a scoping estimate of the potential impact of a different changeover scenario, based on then-just-published Kent et al 2007. The direction of the impact is precisely the same as that shown in the present HadCRU estimates over 4 years later. The difference between the two appears to be that the present HadCRU estimate assumes that bucket changeover impact has ended by 1970, while, in my 2007 post (based on Kent’s evidence of widespread bucket usage in the 1970s), I presumed that the changeover continued until the 1990s.
In May 2008, upon publication of Thompson et al 2008, I reviewed the prior CA posts and slightly updated the March 2007 Climate Audit graphic made a year before Thompson.
Despite Schmidt’s sniggering, it seems to me that I was entirely correct to raise the issue of bucket adjustments and correctly foresaw the direction of required adjustments long before the publication of Thompson et al. HadCRU’s estimate of the size of the adjustments is about half of the estimate based on my interpretation of the Kent et al information; they also appear to assume that the changeover was complete much earlier than I had scoped.
My original issue with bucket adjustments was that they are quantitatively as large as the trend being measured and rest on a rather frail historic foundation. As a result, in my opinion, the bucket adjustments in any SST temperature calculation need to be clearly shown and discussed in any publication of HadSST or HadCRU in the “literature”. (Accompanying the data being released is a new Hadley Center article on bucket adjustments that provides a LONG overdue review of bucket adjustments, one that looks thorough. I’ll try to cover this on a future occasion.)
Once again, Schmidt misrepresented Climate Audit. Schmidt sneered at me for becoming part of a “cottage industry” responding to Thompson et al 2008. In fact, I had looked at this problem long before Thompson et al 2008 and the diagram criticized by Schmidt was only slightly modified from a diagram made nearly a year before Thompson et al. Nor did I attempt to “predict” how HadCRU would implement the errors discussed in Thompson et al 2008 article on HadCRU. If I were predicting HadCRU’s calculations of the impact, I would have predicted that they would say that the error didn’t “matter” to the recent temperature record, as indeed they now appear to be saying. (“Recent” in this case being 1975 on).
[Update July 11 4.30 pm: An RC reader has observed that I made the following response to Peter Webster in a comment here on May 29:
If the benchmark is an all-engine inlet measurement system, as seems most reasonable, then the WW2 blip is the one part of the record that, oddly enough will remain unchanged, as it is the one part of the historical record that is predominantly consistent with post-2000s methods. Taking the adjustments at face value – all temperatures from 1946 to 1970 will have to be increased by 0.25-0.3 deg C since there is convincing evidence that 1970 temperatures were bucket (Kent et al 2007), and that this will be phased out from 1970 to present according to the proportions in the Kent et al 2007 diagram.
Recent trends will be cut in half or more, with a much bigger proportion of the temperature increase occurring prior to 1950 than presently thought.
The comment, like the post, is hardly a “prediction” of what the Hadley Center would do.
Further on May 31, 2008, in a head post, I stated;
Further on May 31 in a head post here, I stated:
A CA reader emailed me, observing that there may be relevant differences in insulated and uninsulated buckets in the post-World War 2 period, which could easily affect adjustment schedules. This makes a lot of sense to me and might reconcile a few puzzles and opening others.
Let’s say that the delta between engine inlet temperatures and uninsulated buckets is ~0.3 deg C (and here we’re just momentarily adopting one of the canonical Folland numbers as this particular number surely deserves to be cross-examined). Insulated buckets would presumably be intermediate. Kent and Kaplan 2006 suggest a number of 0.12-0.18 deg C. So for a first rough approximation to check our bearings on this – let’s suppose that it’s halfway in between. Maybe it’s closer to engine inlets, maybe it’s closer to uninsulated buckets. We’re not trying to express viewpoints on such conundrums here – we’re merely examining what assumptions are latent in the temperature estimates.
The new Hadley estimate contains two new adjustments” 1) an adjustment for the transition to insulated buckets being complete by 1975 or so. This was presented as a mitigating point by a CA reader on May 30 and immediately incorporated into the head post; 2) an adjustment for a “cold bias” in buoys relative to engine inlet after the 1980s.
The Hadley Center adjustment seems to be about half the amount in the 2007 calculation (and the May 28 refreshed version), pretty much along the lines contemplated by the insulated adjustment.
[End Update]
Climate Audit on Bucket Adjustments
I’ve done a number of posts on bucket adjustments – which, as I’ve observed on a number of occasions – is a much under-discussed topic.
Very early in CA history (for example here), I had pointed out the critical dependence of SST trends on “bucket adjustments”. In particular, I pointed out the importance and apparent implausiblity of the Folland assumption of an instantaneous change from buckets to engine inlets at Pearl Harbour – an assumption that was common to seemingly “independent” SST estimates. The Folland assumption was stated as follows:
The abrupt change in SST in December 1941 coincides with the entry of the USA into World War II and is likely to have resulted from a realization of the dangers of hauling sea buckets onto deck in wartime conditions when a light would have been needed for both hauling and reading the thermometer at night.
Fast forward to March 2007. I noticed the following remarkable graphic showing that, as of 1970, buckets were still very much in use:
CA reader Carl Smith commented:
…it looks to me like the WWII records were dominated by engine-warmed intake data, perhaps because the chaos meant much of the bucket data did not get recorded, and after WWII it was business as usual with mostly bucket data resuming.
The next day, I re-examined the Pearl Harbour hypothesis, carrying out a calculation on the basis of Carl Smith’s suggestion as follows:
Let’s suppose that Carl Smith’s idea is what happened. I did the same calculation assuming that 75% of all measurements from 1942-1945 were done by engine inlets, falling back to business as usual 10% in 1946 where it remained until 1970 when we have a measurement point – 90% of measurements in 1970 were still being made by buckets as indicated by the information in Kent et al 2007- and that the 90% phased down to 0 in 2000 linearly. This results in the following graphic:
In December 2007, still long before Thompson et al, I discussed bucket adjustments again, noting the impact of the Folland adjustments on earlier work (referring to Paltridge and Woodruff 1981).
When Thompson et al 2008 was published, Nature announced that the new article called “attention to a previously overlooked discontinuity in the record at 1945”.
In the CA post, I referred to the discussions the previous year and showed the illustration under “Carl Smith Assumptions” once again and once again listed those assumptions (based on the Kent diagram).
In my commentary on Thompson et al, I quoted the following paragraph on bucket methodology changeover:
The most notable change in the SST archive following December 1941 occurred in August 1945. Between January 1942 and August 1945, ~80% of the observations are from ships of US origin and ~5% are from ships of UK origin; between late 1945 and 1949 only ~30% of the observations are of US origin and about 50% are of UK origin. The change in country of origin in August 1945 is important for two reasons: first, in August 1945 US ships relied mainly on engine room intake measurements whereas UK ships used primarily uninsulated bucket measurements, and second, engine room intake measurements are generally biased warm relative to uninsulated bucket measurements.
I compared this information to the assumptions that I had made the previous year as follows:
In our estimate, we hypothesized a wartime changeover to about 75% engine inlet, with business as usual after the war, then gradually going to the 1970 distribution of Kent et al 2007. Thompson et al estimate 80% changeover to engine inlet during the war, with a return to business as usual after the war.
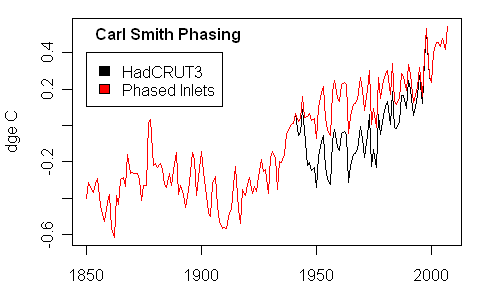
I then provided an “updated version of the graphic posted up last year using data downloaded today” (this is the graphic shown by realclimate – see below).
In the post in question, I made a slight update of a graphic showing the implication of a bucket scenario proposed by reader Carl Smith – a graphic that had been placed on CA a year earlier. All of this is very evident in the CA post linked by Schmidt.
Now here is Schmidt’s account:
Back in 2008, a cottage industry sprang up to assess what impact the Thompson et al related changes would make on the surface air temperature anomalies and trends – with estimates ranging from complete abandonment of the main IPCC finding on attribution to, well, not very much. While wiser heads counselled patience, Steve McIntyre predicted that the 1950 to 2000 global temperature trends would be reduced by half while Roger Pielke Jr predicted a decrease by 30%. The Independent, in a imperfectly hand drawn graphic, implied the differences would be minor and we concurred, suggesting that the graphic was a ‘good first guess’ at the impact (RP Jr estimated the impact from the Independent’s version of the correction to be about a 15% drop in the 1950-2006 trend). So how did science at the speed of blog match up to reality?

Far from the graphic at CA being a rush to judgement as Gavin Schmidt alleged, the CA graphic was a very slight modification of a graphic made over a year earlier, incorporating new information from the Thompson article. Nor did I, as Schmidt alleged, “predict that the 1950 to 2000 global temperature trends would be reduced by half”. The article did not contain anything remotely a “prediction” of how HadCRU and similar organization would deal with the apparent error.
Had I been making a prediction about how HadCRU would respond to the apparent error published by Thompson et al, I would have predicted that they would say that it didn’t matter for recent trends.
The New HadCRU Graphic
Despite Schmidt’s sniggering, the new HadCRU graphic has important points in common with the March 2007 Climate Audit graphic – a comparison which may shed a little light on what the Hadley Centre has done. Here is the new graphic (red and black are reversed from the CA graphic shown above).

As in the March 2007 CA graphic (long before Thompson), there is a noticeable post-war divergence between the revised and original data, though the difference is not as great in the HadCRU graphic. If you look at the HadCRU diagram, there is a W-shape around 1974 and in their calculation the two series have come together by 1974. In the CA calculation of March 2007 (refreshed in May 2008), on the basis of the Kent evidence of continued bucket use in the 1970s, it was assumed that the inlet adjustment would be continuing through the 1970s and 1980s. It would be both interesting and important to know precisely what evidence is used by HadCRU in their present implementation on transition from buckets to engine inlets.
July 11 9 pm: On May 31, 2008, I followed up on the reader’s observation about insulated buckets – see here.
A CA reader emailed me, observing that there may be relevant differences in insulated and uninsulated buckets in the post-World War 2 period, which could easily affect adjustment schedules. This makes a lot of sense to me and might reconcile a few puzzles and opening others.
Let’s say that the delta between engine inlet temperatures and uninsulated buckets is ~0.3 deg C (and here we’re just momentarily adopting one of the canonical Folland numbers as this particular number surely deserves to be cross-examined). Insulated buckets would presumably be intermediate. Kent and Kaplan 2006 suggest a number of 0.12-0.18 deg C. So for a first rough approximation to check our bearings on this – let’s suppose that it’s halfway in between. Maybe it’s closer to engine inlets, maybe it’s closer to uninsulated buckets. We’re not trying to express viewpoints on such conundrums here – we’re merely examining what assumptions are latent in the temperature estimates.
and
However, let’s suppose that there was a transition from predominantly uninsulated buckets immediately post-WW2 to predominantly insulated buckets as at 1970 or so. Then the 0.3 deg C total adjustment would be spread proportionally between the two periods – with the delta between uninsulated buckets and insulated buckets being allocated to the 1945-1970 period or so (together with other relevant instrumental changes) while the delta between insulated buckets and engine inlets would be allocated to the 1970-2005 period (again together with any other relevant instrumental drifts e.g. changing proportion of hull sensors, buoys, whatever.)
This seems entirely consistent with the HadCRU information released today. [end]
As I observed in 2005, the bucket adjustments are as large as the trend being measured. Therefore the bucket adjustment methodology and the bucket adjustments themselves need to be prominently illustrated and adjusted in any SST estimate that purports to be scientific.
And, by the way, attentive CA readers may recall that the CA post criticized by Schmidt today was also criticized in a notorious Climategate email as follows:
891. 1212063122.txt
>> Mike,
> Can you delete any emails you may have had with Keith re AR4?
> Keith will do likewise. He’s not in at the moment – minor family crisis.
>
> Can you also email Gene and get him to do the same? I don’t
> have his new email address.
>
> We will be getting Caspar to do likewise.
>
> I see that CA claim they discovered the 1945 problem in the Nature
> paper!!
>
> Cheers
> PhilFrom: Michael Mann
To: Phil Jones
Subject: Re: IPCC & FOI
Date: Thu, 29 May 2008 08:12:02 -0400Hi Phil,
laughable that CA would claim to have discovered the problem. They would
have run off to the Wall Street Journal for an exclusive were that to
have been true.
I’ll contact Gene about this ASAP. His new email is: generwahl@yahoo.com
talk to you later,
mike
When one compares the CA diagram of March 2007 and the further discussion of May 31, 2008 to today’s HadCRU diagram, it seems to me that the CA posts properly drew attention to an important problem. And far from the initial effort to show the potential effect being risible as Schmidt says, it showed that bucket adjustments might very well “matter” and my most recent thoughts seem rather prescient in retrospect. After several years of work, the Hadley Center have done a thorough review of bucket adjustments. This was long overdue. Their analysis is that the substantive impact of changeover from buckets to engine inlets had been mostly accomplished by the mid-1970s. They also incorporate a new adjustment for drifting buoys, which become very dominant in recent years and which are believed to run slightly “cold” relative engine inlets – and merits attention just as much as the changeover from buckets.
Regardless of the merits of the particular adjustments, I would have thought that modelers would be keenly interested in cross-examining the bucket adjustments very closely. As I had surmised in 2007, eliminating the erroneous handling of World War II bucket adjustments has a large impact on the previously-believed in decline in temperatures in the 1950s and 1960s. Had the bucket adjustments been examined earlier, this might well have had an impact on modeling results. I would have thought that modelers would want to clearly understand the merits of HadCRU bucket adjustment procedures before spending a lot of time and energy on modeling HadCRU temperatures in complicated models.


91 Comments
Steve, when it comes to Gavin and you, we know whom to trust. It’s not Gavin for sure.
Why are there adjustments in the 19th century in HadCRUT3v?
Just to mention that nick will be along soon to point out that Marie Antoinette was not French and did not own a bucket so you are all wrong as stated in the SI for an edition of the Beano in 1956.
Hehe, you beat me to it. The countdown is underway.
At some point the constant rewriting of history is going to catch up with these climate scientists.
Mark
some people just never learn.
They need to watch “Cool Hand Luke”
This film may give them a better idea whom they are dealing with.
Gavin Schmidt couldn’t carry your bucket, Steve.
But at least in this instance, as opposed to the “Mystery Man” incident, Gavin isn’t taking credit himself for an error you had found.
This is an important finding because the IPCC bases its claim for AGW on “unexplained” warming post 1950. Since climate science can’t explain why it warmed, the warming must be due to CO2 according to the IPCC.
I tried to discuss this on RC but my post was sent to the borehole. The IPCC rational falls apart if the explanation is a data error. The bigger question then becomes why climate science and the IPCC did not consider that one possible explanation – and indeed the most likely – is human error in compiling the data.
Time and time again scientists have reported new discoveries, and time and time again these new discoveries have later been found to be caused by data problems.
That isn’t to say that new discoveries don’t happen. Rather that a lot of “science” is not new. Most likely someone has already looked at the question in some detail in the past, and if your finding doesn’t match theirs, the first thing to suspect are your methods.
Human beings subconsciously introduce bias into all experiments and it requires very careful design to avoid this. We see this when new findings correct old mistakes. The correction does not happen all at once. Rather, each new study tends to move only part way towards the correct answer.
We are likely to see the same thing in this case. RC has put forward a figure of 17% and is trying to support this by heaping scorn on Steve and others that first pointed out the problem. As such, the 17% figure likely represents the lower bound of where the correction will eventually end up, as further studies case light on the problem.
Therefore we a likely over time to see a much larger fraction of the IPCC “unexplained warming” attributed to “data error” than what RC is currently suggesting.
Shouldn’t the statement
“And from the initial effort to show the potential effect being risible as Schmidt says . . .”
Instead read something like
“And far from the initial effort to show the potential effect being risible as Schmidt says . . .”?
Good job – as always, you give the complete context, which is always illuminating.
Well, here we all are once again, discussing bucket adjustments. It was about the time of the Bucketgate discussions where I first hopped on board this train [summer 2007], so I get to be the one to ask… are we talking insulated or uninsulated buckets today??
It’s on day’s like this that I begin to feel total despair for progress in human understanding. Have I been asleep and have woken back up on GROUNDHOG DAY – AGAIN?!!
Gavin and his crew [team] are
snip
/rant
Your despairing friend,
W^3
Steve: Whether the Hadley Center article holds up under scrutiny is not known, but it is a reasonably diligent attempt. Unfortunately, Schmidt seems uninterested in assessing the reasonableness of the assessment, preferring instead to snigger at someone who (correctly) questioned the Pearl Harbour assumption and (correctly) observed that a more reasonable analysis would raise 1950s and 1960s temperatures from those reported by HadCRU, long before Thompson et al 2008.
The core issue here is really: “Whence comes GS’ impregnable sense of impunity from the consequences of issuing transparent distortions as brilliant insights?”
The roar of the wings of squadrons of chickens coming home to roost must be drowning out cautions and warnings from friend and foe.
If the temp anomaly is based on 1950 to 1980 and they had to adjust 1950 – 1975, then shouldn’t all the values prior to 1945 be adjusted in parallel based on a new normal?
Steve – the choice of period as “normal” doesn’t affect any calculations. Please consult other discussion on this matter.
So you basically make your own calculations on what the differences may lie, and because someone else made a different calculation, therefore you are wrong and just plain silly?
Hmmm.
But in RC, there’s an interesting comment by Sphaerica. Here:
http://www.realclimate.org/index.php/archives/2011/07/revisiting-historical-ocean-surface-temperatures/comment-page-1/#comment-210335
Might not be polite, but there’s an argument here.
Except that “What is shockingly ill-advised to me is that the Pielke and McIntyre projections both required, in order to fit with their hoped for story line” is really a petty statement. I didn’t realize Steve had a hoped-for story line, except that climate science be less shoddy than it is.
Schmidt’s comment about the “projections” fitting with my “hoped for story line” is deranged. For what it’s worth, I observed at the time that the post-WW2 decline in temperatures presented a problem for models, given the relatively continuous increase in CO2 levels and the SST changes seemed to me to make life easier for modelers seeking to link 20th century temperature changes to CO2. I’m a little puzzled why Schmidt took such exception to this comment.
That wasn’t Gavin’s comment, that was a different commenter.
Gavin would have approved it … and sock puppets do exist.
But, if it appeared in the RC comments, and stayed there… Then Gavin DID approve it!
Making fun of quality control efforts…real scientific Gavin.
They don’t call him Gavin Smirk for nothing, Steve. He’d better be careful or when he grows up his face will stay like that.
My 2008 post also observed:
The changeover from uninsulated buckets to insulated buckets is a major premise of the Kennedy et al 2011 article – precisely along the lines anticipated in the CA discussion. Allowing for this effect – clearly discussed at CA – would result in the lines being synchronized in the 1970s rather than the 1990s.
Now that I think of it – the reader’s comment about the change to uninsulated buckets – a change that looms large in Kennedy et al 2011 was, to my knowledge, first mentioned at CA though the reader was perhaps familiar with thinking at Hadley Center.
Tamino’s code drop
Should be able to drop it into my package RghcnV3 it an hour or so.
Documents, testing, package building, demo testing, arrgg. will probably hit CRAN later this week
Steve
Judith Curry posted a Critique of the HADSST3 uncertainty analysis
You may wish to explore the bias due to the change in measuring times during WWII. See my preliminary guestimate of this bias: Diurnal Sampling Bias
Kennedy et al. noted:
From this:
John Kennedy affirmed, including:
————————-
PS Note also:
Branch, R., A. T. Jessup, P. J. Minnett, E. L. Key, 2008: Comparisons of Shipboard Infrared Sea Surface Skin Temperature Measurements from the CIRIMS and the M-AERI. J. Atmos. Oceanic Technol., 25, 598–606. doi: 10.1175/2007JTECHO480.1
@Steve McIntyre
I believe Gavin is referring to a comment to the post he linked to that ends with:
“Recent trends will be cut in half or more, with a much bigger proportion of the temperature increase occurring prior to 1950 than presently thought.”
I know too little of the context to say what exactly that quote means, but I am almost certain that is the part he is referencing.
Hmmm, the comment in question is here and, interestingly, was a response to Peter Webster’s inquiry about Phil Jones’ refusal of CRUTEM data here – an exchange that is interesting to re-read in light of the subsequent FOI requests.
Webster, for same time, has been very interested in the post-1950 blip and the potential impact of bucket adjustments.
In the comment in question, my response was clearly expressed as a conditional on the phasing of the changeover:
This (May 29) is clearly a conditional observation “according to the proportions in the Kent et al 2007 diagram”. On the following day (May 30), I reported that a reader had observed that the changeover to insulated buckets would mitigate the calculation – a point recorded in the head post.
Further on May 31 in a head post here, I stated:
I urge readers to re-read the follow-up CA post on May 31, 2008 reviewing and discussing initial comments. See here .
In another 2008 CA post, I criticized the following statement by Thompson et al:
the data before ~1940 and after the mid-1960s are not expected to require further corrections for changes from uninsulated bucket to engine room intake measurements
In fact, the change from uninsulated bucket to insulated bucket was an important effect.
Gavin is using this — “Recent trends will be cut in half or more, with a much bigger proportion of the temperature increase occurring prior to 1950 than presently thought.” from comments you made in response to Peter Webster to justify his assertion of a prediction by you that 1950 – 2000 global temperature trends would be cut by 50%.
I am also trying to get Gavin to correct his bad misrepresentation of my comments on this subject. I have just left this at Real Climate, my third request:
“Roger Pielke Jr. says:
Your comment is awaiting moderation.
11 Jul 2011 at 2:44 PM
Thanks Gavin, on Prometheus I provided 3 emulations (and requested others if people did not like those 3), they were:
1. What I interpreted that McIntyre said (50%)
2. What I interpreted that you said (30%, which you dispute, fine, I accept that)
3. What I interpreted that the Independent said (15%)
Once again, at no time did I generate an independent prediction. I am now for the third time asking you to correct this post.
I did however say that any nonzero value would be scientifically significant, which I suggest is more interesting than the blog debate that you are trying to start.
Please just correct it, OK? It is not a big deal. Then let’s get back to the science.
Thanks!”
Its posted. FIY
Schmidt just a cowardly bully , he would never take on opposing views in a situation he could not control . RC allows him to play god it shows.
Meanwhile his no choice but to defend all the Team spouts .no matter no silly , his entry professional career is now totally tied up with it .
I have written a post on this as well:
http://rogerpielkejr.blogspot.com/2011/07/making-stuff-up-at-real-climate.html
My last comment on this issue at RC after Gavin’s latest dodge:
“Roger Pielke Jr. says:
Your comment is awaiting moderation.
11 Jul 2011 at 4:25 PM
-24-Gavin
Last time 😉
On the question of whether or not I offered an independent prediction of how ocean temperature adjustments would work out, there is an objective answer to this question — as I have carefully explained to you here, I did not. Anyone can read my posts and see that this is the case. It is not a matter of interpretation.
More generally, if you want to avoid a playground fight then don’t write posts like this one, because as you have seen, both McIntyre and I have taken issue with your comments (what did you expect?). That is always a danger on a playground, if you call people out they will sometimes react … So maybe in the future stick to calling out Willie Soon and Fred Signer? ;-)”
Roger,
You notified us of your own post about five hours ago. No comments have yet been approved. I submitted my own about three hours ago. It read:
“if it is indeed the case that 17% of the global surface temperature trend that the IPCC thought it had fully accounted”
Roger, you weren’t so iffy in that 2008 post. Or speaking of 17%. You said:
“But we know now that the trend since 1950 included a spurious factor due to observational discontinuities, which reduces the entire trend to 0.06 [from 0.11]”
We know now…
And your bolded propositions for the IPCC that follow, leading up to “D. The IPCC statement needs to be fundamentally recast” rest on that new “knowledge”.
Nick I think your reading would get an low grade from me as a former English teacher. Let’s look at what roger actually said.
The first thing any astute reading would note is the question in the title. Roger is sly enough not to commit to anything. Moving to the meat–
roger actually tried to have it both ways: In one sentence he says, as you note, ” but we know now that the trend since 1950…reduces.. to .06. However, directly after making this apparent claim of knowledge, roger backpeddles somewhat and suggests that if the adjustment is in the ballpark ONE of the following must
true.. and in his list of options is C: the adjustment is off. So, a balanced reading of what roger wrote isnt one that focuses as your does on option D. Neither is it balanced to focus on option C. A balanced reading is one which recognizes that roger seems to want to have it both ways. On one hand claiming that we have knowledge that the trend reduces to .06 and on the other hand a recognition that this “knowledge” could well be wrong. This reading, that Roger has it both ways will doubtless upset him as he wants to point to his caveats, and his hedging. But it also, highlights what you apparently dont want to acknowledge. he claims of knowledge were not so univocal.
In any case we are not discussing the most important thing and that is the adjustment itself.
Seems to me you’re giving his writing a low grade.
But those thundering statements were in bold type – so you would think they were based on “knowing” something.
Steve: may I suggest that you make comments about Roger at his blog.
I’m giving you both a bad grade. Nick you are always ever so careful to look for every possible shade of meaning or uncertainty in a text when defending a cherished position. We all see that in you. When you don’t exercise the same kind of diligence with respect to Roger’s position we notice that as well.
“I cleaned up my act because otherwise I would have kicked the bucket.” ~ Lou Reed.
Is the new version of HadCRUT with the adjusted SST’s going to be available and supplant the old soon? One hopes they will keep an archive of the pre-adjustment data (though historically they have not) so that people can check for themselves how much sense these changes make. So when will the new data go into use? It looks to me like they are slightly reducing the early twentieth century warming as well as making the mid century cooling more gradual rather than a sudden shift after the war. The impact of this on our understanding of the twentieth century variability and change could be dramatic. Note that the IPCC’s “iconic” attribution statement refers to warming of the last fifty years, and these new estimates reduce the amount of warming that occurred since then. I’ve seen a lot of bizarre claims that the trend over that period being smaller somehow does not matter. I don’t think that makes any sense at all.
Maybe I’m way off on this, but as a “member of the public”, prior to you dealing with the “buckets” issue so thoroughly here at CA on those early posts, I had never seen or believed I could be reading such a seemingly esoteric discussion regarding climate data, that is in fact so far reaching as to the accuracy of the data that will ever be available regarding pre-1950s SST and, therefore, global temperatures. I’m surprised Gavin would so highlight the disagreement and pervasive uncertainties that exist in historic measurement of SST. It would ultimately seem counterproductive for the Team.
In any event it seems to me the only real issue here is indeed the level of certainty regarding historic SST.
This really is the only question, IMHO. I wouldn’t trust it with the accuracy portrayed.
This bucket/engine-intake discussion or controversy is becoming very intriguing, but I’d like to raise a point that worries me a bit. Perhaps I’ve missed something written earlier, but what occurs to me is that the talk is about differences that may be small (say 0.1C) or something that could have practical significance, say 0.3C. The difference between insulated and non-insulted buckets seems to be deemed to be around 0.1C, but still don’t know in which direction. My guess is that insulated buckets might give cooler values when there’s a substantial positive difference between air and sea temperatures, and vice versa. Has this already been discussed?
What I would be especially interested in knowing is something about the thermometers that were/are used. My experience is that typical industrial liquid in glass thermometers (not medical ones) tend to be calibrated in single degrees, or occasionally half degrees, at least in the places that I once worked. To be sensitive to 0.1 or 0.3C differences would require some pretty careful reading of the mercury as well as some skillful estimation of the analogue value of fractions of a degree. Whilst simple modern electronic (thus digital) thermometers, such as are found in “weather stations” are normally stated to be sensitive to 0.1C, their accuracy tends to be quoted as 1C. Such quantification may not be easy with non-electronic devices. Ignoring this potential accuracy problem, obtaining a reliable value for a given “observation” with liquid in glass instruments would entail numerous replicates of the measurement – something unlikely to be a routine in a ship-board environment.
Perhaps the ship thermometers are of a special type, accurately calibrated to a very few tenths, and regularly checked.
Just some thoughts!
Robin
Steve: start with the Folland articles.
Steve,
Excellent post. The Hadley Center claim that the inlet adjustment was not needed after 1974 seems very convenient and highly suspicious. Did they provide any historical evidence for the claim? Or were they speaking ex cathedra?
It seems to me this issue needs some thorough historical investigation. Perhaps you have already done so and will post on the topic later. If not, I hope you or possibly Anthony Watts will agree to take on the task.
I cannot be the the only post war former officer who called the engine room for the sea water inlet temperature when rough weather made the bucket method totally useless.
The temperature was recorded in the Met Office log book as though it were taken from the bucket.
And I cannot guarantee that my colleague in the ER actually went to check the sea water inlet or if he just looked at his log book and provided an earlier reading.
The Met Office didn’t exactly issue a truck load of thermometers and therefore dropping the bucket from a height of 30-50 feet required great care and a check as to the remaining quantity of thermometers.
In summary, I would not rely on SST data obtained from merchant vessels – too many variables.
Posted at RC (if it shows up):
ThomasL says:
Your comment is awaiting moderation.
11 Jul 2011 at 6:50 PM
I think Gavin’s reading of what McIntyre said is a bit off, though I can see how that could happen in this convoluted topic.
First of all McIntyre said, “If the benchmark is an all-engine inlet measurement system… all temperatures from 1946 to 1970 will have to be increased by 0.25-0.3 deg C since there is convincing evidence that 1970 temperatures were bucket (Kent et al 2007), and that this will be phased out from 1970 to present according to the proportions in the Kent et al 2007 diagram… Recent trends will be cut in half or more, with a much bigger proportion of the temperature increase occurring prior to 1950 than presently thought.”
Obviously, that large an impact was predicated on the “benchmark” of “all-engine inlet” measurements in the “proportions in the Kent et al 2007 diagram.”
“If” the reference really was “all-engine” and if the proportions really matched Kent 2007, then half of “recent” trends could be affected, with more warming occurring prior to 1950. That is a lot necessary conditions to fill.
You’ve represented that in the post as a prediction that “the 1950 to 2000 global temperature trends would be reduced by half.”
That isn’t quite what he said in two ways. The first, because of the erasure of all the “ifs” and predicates. The second, is that he did not say that the trends from 1950-2000 would be cut in half. He said that the recent trends might be cut in half with more of the remaining warming present prior to 1950 than is shown now. Those are not equivalent, interchangeable statements. As a mental shorthand, it might be fine to reduce the complexity into more simple and memorable portions, but when attributing a statement to someone, it would be better to use the full complexity version of what they actually said, rather than the reduced complexity mental shorthand version of what they said.
Moreover, that wasn’t his only commentary on the topic. Three days later (2008-05-31, over three years ago, and fully search indexed) he publicly speculated on a smaller magnitude based on different types of buckets, “Let’s say that the delta between engine inlet temperatures and uninsulated buckets is ~0.3 deg C… [i]nsulated buckets would presumably be intermediate. Kent and Kaplan 2006 suggest a number of 0.12-0.18 deg C.”
He also refers to the previous writing as, “[M]y first cut at estimating the effect,” obviously implying that this and future estimates might be better than his “first cut.”
While I can see how one might misread what he said, particularly given a haze of three years, there are some important differences between what he said, and what this post claims that he said.
And of course none of it at any point is predicting what Hadley would say, but I didn’t bother to raise that since I was afraid it was getting too long.
I see that Schmidt has responded with the following inline comment:
In a post on May 31 (to which Schmidt linked), I observed:
Schmidt complained that I “never came back to the issue”. That still doesn’t justify Schmidt misrepresenting the position articulated on in the post of May 31, 2008 that Schmidt linked to.
In addition, when one squints at the present HadCRU figure, the estimate in the May 31, 2008 doesn’t look bad.
Schmidt says that I “speculated wildly on how this would undermine all the previous D&A work”. I’m interested in precisely where these speculations occurred. I certainly observed that the changes were large enough that modelers should be attentive to them. In today’s post, I said that the adjustments “might well have had an impact on modeling results”. Perhaps I used stronger language than that somewhere else, but do not recall any specific speculations about “D&A”.
Contrary to Schmidt’s assertion, I did revisit the SST information a few days later here and here. In the latter post, I touched on the issues pertaining to individual decks that are discussed in the recent Hadley Center post.
In this post, I praised the cooperativeness of the ICOADS project, contrasting their openness with CRU obstruction.
Wading through the SST issues is not a small job. While Schmidt seems to feel that I should do the work for dozens of climate scientists, there’s only so much that I can do.
I’ve urged attention to bucket adjustments for many years and am glad that Hadley Center have re-visited this – it’s now six years since the problems of the WW2 adjustments were first discussed at CA.
I’ve tagged a number of CA posts discussing buckets as https://climateaudit.org/tag/bucket/.
ThomasL (Jul 11, 2100 at 6:52 PM) —
> Posted at RC (if it shows up)
Your comment has passed RealClimate’s moderation.
Thanks for re-posting your local copy. RC readers should probably thank you more — this helps make their discussion less one-sided.
Gavin’s inline remarks:
Meh, my comment of Jul 12 at 6:21 AM merely repeats information already noted by SMcI, upthread (or downthread) on Jul 11 at 8:35 PM.
All,
there are a lot of rules about taking data, and you are all ignoring all of them. In the first place, guessing how a data point was taken is absurd. In the second place, debating trends in the tenths, when the data were taken to the whole number, is even more absurd. In the third place, how long ws the bucket out of the water before the temp was taken, and was the air cooler or warmer? How many tenths would that throw the reading off?
Admit it, no one can say what the temperatures were with any degree of accuracy, anywhere, before World War II if not before the Vietnam War.
Climate science is an engineering farce. Did you not learn of significant digits in high school algebra? May as well read the tea leaves. Do bristlecone pine needles make good tea?
U of Michgan BSE-Mechanical Engineering ’81
JCM comments to your point, Michael. My experience with the land surface stations is that once people have the temperature numbers, they are only interested in arguing about those. The basic instrumental quality control becomes unimportant to the argument, and is carefully ignored. The argument itself is central. Few are willing to pay attention to the fact that the numbers they’re arguing about are almost meaningless.
Here is what Lamb said about bucket adjustments in “Climate: Present, Past, and Future Vol.II” page 506 footnote 1:
“The reversal of the trend since 1940-50 may have been greater than currently accepted sea surface temperature figures indicate because of the general adoption since the same time of water temperatures measured in the intake to the ships’ engines instead of by the former canvas bucket method. Investigation by Saur (1963) of the results obtained by the two methods indicated that, on average, the intake temperatures were 0.7 degrees C. higher.”
The J.F.T. Saur paper was “A study of the quality of sea water temperatures reported in logs of ships’ weather observations” J. App. Met. 2 pp. 417-25.
Thanks for the pointer reader. Here’s the abstract from Saur’s 1963 paper:
“The differences between sea water temperature reported in the Log of Ship’s Weather Observations and specially observed sea surface temperature were studied for 6826 pairs of observations taken in the Pacific Ocean from 3 Military Sea Transport Service ships and 9 U.S. Navy Radar Picket ships during 92 different trips. For each trip the mean difference (trip bias), using the surface temperature observations for the reference, and the standard deviation of the differences were computed. These results were combined to give similar measures for each ship (ship bias and standard deviation) and estimates of these measures for a large number of ships (fleet).
“Reported sea water (injection) temperature observations vary considerably in quality. The fleet bias, or mean difference, of injection temperature observations as compared to surface temperature observations is estimated to be 1.2±0.6F and the standard deviation of differences to be 1.6F. Among the 12 ships, the ship bias, or mean of all differences derived from observations of a given ship, ranged from −0.5F to 3.0F, which is probably due to variations of the thermometer accuracy and of the thermometer installations between ships. The standard deviation about these means was 1.3F, which is a measure of the variability of present data records, provided that the bias for each ship could be determined and a correction applied.
“The variability of differences in the observations from a single ship is attributed to the system of taking and reporting sea water temperature observations from an injection thermometer. To improve the reliability of reported sea water temperature observations, a change to an electrical resistance or thermistor thermometer, specially designed and installed to measure the sea water temperature and having a remote indicator on the ship’s bridge, is recommended. If this change were made, it is estimated from trip data that the standard deviation of differences would be reduced to less than 1.0F.”
Did anyone ever see those sorts of systematic measurement errors propagated into the reported SST trend?
Intended or not, your post gives the impression that you spotted this problem before Thompson et al [2008]. The problem has been known in scientific circles for decades. The Saur 1963 paper dealt with it and as a result the Navy undertook its own analysis, QUANTITATIVE ANALYSIS OF SOME BATHYTHERMOGRAPH ERRORS Hazelworth, 1966.
Correcting for bias in these measurements was difficult – early attempts at using reference thermometers actually introduced larger uncertainties than the uncorrected measurements. At one point the Navy’s calibration requirements were for an accuracy of .1F – but rigorous analysis showed the instrument’s actual accuracies were probably no better than .5F
In other words, identifying the problem was never an issue – what to do about it was. The original measurements are what they are, for all their imperfections. The scientific community’s informed opinion was that despite these imperfections the data would not invalidate results and conclusions based on their use. That opinion seems to have been the correct one. Those who were wildly waving red flags do not appear to be accepting this very gracefully.
Steve: When I wrote, all the SST indices incorporated the Pearl Harbour adjustment. I wrote that the adjustment was absurd in light of known information about the use of buckets post-war. This criticism has been fully vindicated. I was entirely correct to wave a red flag at this ridiculous assumption.
Hadley argues now that the impact is mitigated by two other adjustments that were not included in the major indices as at 2006 – the changeover to insulated buckets and the changeover to floating buoys.
Given the impact of adjustments on the overall trend, I observed that these adjustments needed to closely examined. My estimate of the combined impact of the changeover to insulated buckets and to engine inlets on May 31, 2008 looks consistent to me with the present Hadley Center analysis.
As to “wildly waving red flags”, I’m not sure what you’re referring to.
“wildly waving red flags” would be anyone who does quality checks or points out errors. Add that to the euphemism dictionary.
snip
– settle down
As we’ve discussed recently, we’ve seen that the “informed opinion” of the science community is that it doesn’t matter whether the Tiljander proxy data is used upside down by Mann et al or contaminated. Of course, the opinion of the “science community” in that case is incorrect as dozens, if not hundreds of readers realize. Unthinking endorsement of such untrue statements by the wider “community” do not enhance its reputation.
Nor in my opinion is a too-quick and over-reflexive assertion that noticeable adjustments to the 1950s don’t matter. They might very well affect the GISS theory of past aerosols, for example.
Given that the HadCRU results have only been out for a short time, I don’t understand how they can be so confident that the changes would have no impact on anything.
If Berkeley really does a good and proper job, then I expect to see similar adjustments to the land temperature record that should remove some of the mid-century cooling – again challenging the current GISS thinking on aerosols.
Watching the Pea and the Thimble, we now have bracketed the period from buckets to lakebed sediments. One influenced by changing the measurement
style, the other influenced by contamination from encroaching development.
How much does the modern record change with one or the other (but not both)removed? How ’bout both?
KNMI has added the HADSST3 data to the Climate Explorer. I finished a quick initial post comparing the HADSST3 and HADSST2 datasets for the term of the data and for the two warming periods and the mid-century cooling period:
Steve, I am a bit dense so is this right? These adjustments, if right, are going to bring the slope of the blade to a more flat alignment?
Whoops, just went to Bob’s post and answered my own question – Never Mind!
If just one of the Had-Cru desk jockeys had gone to sea and compared temperatures recorded simultaneously by various types of buckets, intakes, buoys, and satellites under a variety of conditions, we might have a good reason to believe or disbelieve their estimates of biases.
Bottom line you cannot accurately adjust for a problem if you do not know precisely what the problem is or want its impact was. All you can do is ‘guess’, and intelligent guess perhaps but still a ‘guess’. And in this situation is far too many ‘human factors ‘ in place to make the adjustment anything but a ‘guess’
As for Schmidt if he told you time of day , you do well to cross check for validity , his role now being mostly to run PR for the ‘Team’ while on the government coin.
re bucket adjustments I just cannot believe that data from such an uncontrolled method could possibly be taken too seriously, at least to establish SST on a global basis. ship’s engineers are interested in SW temp only insofar as it is cold enough to effectively provide engine cooling. they could not give a toss about it for other reasons. why would you go on deck in foul weather to throw a bucket over the side etc etc. i think this just goes to the (lack of ) substance to the warming alarmism. the recent ‘rediscovery’ of sulphates as a ‘cooling’ is just another bookend on what is a library of nonsense. lewis carrol must be wondering why he didn’t think of it.
just to get off subject though, i just saw gavin schmidt’s photo at real climate. are he and michael mann twins?
‘Real’ as in Real Climate has little to do with what most of us see as real, but is all about what Gavin sees as being real. Understanding this makes it very easy for me to avoid Real Climate completely on the grounds that it is frequently quite surreal. I may have a different take on unreality, though – as a small boy, ‘Through the Looking Glass’ did not appeal to me at all.
Or “Real” in the sense of “Real Madrid” in that it’s all about the money…
Obviously Steve doesn’t make predictions. He makes projections based upon various scenarios. He projected various scenarios for resolving the adjustments issue. He did attempt to project how HadCRU would resolve the issue.
I accept the Team’s account that this was a known issue prior to Steve’s earlier posts. However, that may bring up a bigger problem? Why wasn’t this addressed in earlier papers? Is this a case of omitting inconvenient facts? Was pal review a factor?
Re: AJ (Jul 12 10:50),
Saying that it was “known” prior to my posts is a typical piece of Schmidt misdirection. Of course, it was known prior to my posts – that’s how I learned about it. However, just because some climate scientists can show that they talked about the problem in workshops doesn’t mean that they were dealing with it. At the time that I started commenting on the Pearl Harbour hypothesis, it was embedded in the SST indices and nothing was being done about it.
Nor was the problem well understood by Susan Solomon – see the contemporary nature puff piece.
I agree. It’s a mystery to me why it wasn’t addressed sooner. Gavin has admitted that it was a “known unknown” so it should have been accounted for in the literature.
I wonder if the Team gets locked into a certain narrative and finds it hard to materially alter it.
BTW… I meant to type “He did’NT attempt to project how HadCRU would resolve the issue.”
There have been a lot of papers on SST measurement and its issues, starting with the 1963 Saur paper cited by Kevin O’Neill. This search brings up a selection of the older ones.
Re: Nick Stokes (Jul 12 16:51),
1. The bucket issue was is the literature, THAT is where he learned about it.
2. starting in 2005 or so he starting blogging about and questioning the adjustments.
3. the “real” scientists eventually got around to the issue (fixing the problem)
4. Steve never claimed to have FOUND the problem. he highlighted it.
5. The science community miscontrued his highlighting. They argue that HE argued that he found the problem.
They should have just said, thanks for highlighting the problem. Attention is good.
6. Steve publishes a estimate of what the correction WOULD look like under certain ASSUMPTIONS.
7. Many people miscontrue this as a settled position of steve’s
8. in 2011, 6 years after steve highlighted a known problem, science corrects itself.
9. days later, gavin rushes to “correct” a blog post by person he doesnt read.
I think people have their priorities wrong. I think they should be reading more carefully. I think they should be correcting published science rather than rushing about misreading and ‘correcting” blog posts. Had people like gavin worked with the same speed on science as they do on blog posts, Ar4 would have been a better document.
AJ asked “Why wasn’t this addressed in earlier papers?”
So I showed where they were. That’s all.
I’m taking his question to mean why wasnt it corrected in earlier looks at the data.
I should have asked “Why wasn’t it accounted for in the HadSST product?”
The 1963 article had nothing to do with Folland’s Pearl Harbour adjustment that I objected to in my 2005 and 2007 posts. That is an entirely different issue from the concept of a differential between engine inlets and buckets. In other CA posts, I reported even earlier discussions than Saur’s on this topic.
I cited Saur et al in my May 31, 2008 post on the topic here. The section of this post (wooden buckets) is itself a very interesting topic as an elaborate theory of bucket adjustment in the 19th century is built up by Parker and Folland on studies of a wooden bucket for which there is no evidence that it was used for SST measurement (as opposed to swabbing decks) – a point stated by Folland and Parker themselves, though subsequently ignored by themselves and the “community”.
Steve Mosher:
Thanks for the succinct summary. As Roger Pielke Jr noted Gavin’s obsession is really odd. I also find it really strange that it took those responsible for this data set so long to come up with any adjustment at all. I certainly believe that this is also a case for maximum transparency as to what was done to what actual data set.
“Saur (1963) compared simultaneous bucket and engine intake SST on 12 U.S. Navy ships in the Pacific. A specially designed insulated bucket was used as a standard and large errors in the intake temperature were found.”
Nick, 1963 was long time ago. 48 years later they probably still have it wrong.
Forgiving for the moment Gavin Schmidt, the advocate, for his science shortcomings in this matter, reading the article in question brings into sharp focus the lack of attention in the past to potential biases in the temperature records and particularly the SST record. It is good, as SteveM notes in this thread, that scientists have taken another look at the SST uncertainties and biases, but reading from the article (see comment in quotes below) one still comes away with a sense that we have no final hard and fast objective measure of the uncertainties in the temperature measurements. I have a nose for uncertainty and the article being discussed here appears to be open and frank about that matter.
“Despite the wealth of metadata that is now available, it is not possible to estimate the biases in an exact manner so an attempt has been made to assess the potential uncertainties in the biases that arise from assumptions made in the process of aggregating the information. The bias estimates are used to adjust the SST data to create a new, more homogeneous data set of anomalies relative to the 1961-1990 average. The adjusted data are presented as an ensemble of 100 interchangeable realisations and together with the new uncertainty estimates described in part 1 of the paper (Kennedy et al. [2011b]) they constitute the third set, HadSST3. The HadSST3 data set is publically available from http://www.meto_ce.gov.uk/hadobs.
It should be noted that the adjustments presented here and their uncertainties represent a first attempt to produce an SST data set that has been homogenized from 1850 to 2006. Therefore, the uncertainties ought to be considered incomplete until other independent attempts have been made to assess the biases and their uncertainties using different approaches to those described here.”
Also of interest is what affect did an amateur blogger have on motivating the push for more refined analysis of a measurement system with adjustments that would appear to be far from complete and satisfying.
Our Gav! whatever have you been doing at school. The headmaster called me in today and told me that you been picking fights with the prefects. Oh you are a silly one. How many times have I told if you have to pick fights only pick them with boys your same age or better still the smaller ones?
Now while I was there he said you have a wonderful imagination which is great for making up stories in the english class but you must stop doing it in science classes even if they are just bucket chemistry experiments/ 🙂
He dodges examination by cybershocking anyone touching the handle to the science museum.
============
“. . . debating trends in the tenths, when the data were taken to the whole number,”
Is this really so? If so I’m shocked (and I thought I couldn’t be shocked anymore by climatology). Jeez, we learned about significant figures in high school!
. . . . . . . . . .
Something else I wondered about when the bucket issue first arose: How were the temperatures actually taken? That is, did they stick a thermometer in the bucket as soon as it was hauled up, or take it to somewhere? How big were the buckets, and what is the “thermal inertia” of sea water? (sorry – don’t know the official term); if there was a lag between hauling and measuring, was that accounted for?
The last type of ‘bucket’ I used was a cylinder with a wall about 1/8th inch thick with internal supports for the thermometer to prevent breakage. Prior to that the canvas bucket was used to bring water up and then the temperature was taken
All equipment provided by Met Office.
At fixed times I would go to the bridge wing and attempt to lower the cylinder to the required depth and then haul up the bucket a height of up to 60 feet and try to ascertain the temperature as it rose or fell due to the air/sea difference. Although mariners knew the value of the data for weather forecasting they never knew it would be used many decades later for climate studies. I know many of my colleagues made the call to the ER for the sea temperature on a regular basis and entered the data in the the weather log without leaving the chart room. One person on the bridge was the norm and the weather report was often a secondary concern when more important tasks were at hand.
Its these ‘Human factors’ which are the problem, there simply no way of knowing how these had an effect or what that effect was . So you have to resort to ‘intelligent guessing ‘ . In science its usual but not totally unknown, however it comes with very big caveats and cannot hope to give you the short of precision some are claiming for these measurements, such as being down to two decimal places .
You can’t accurately correct for a error if you don’t accurately know what the error is .
“There have been a lot of papers on SST measurement and its issues, starting with the 1963 Saur paper cited by Kevin O’Neill. This search brings up a selection of the older ones.”
I think the current article under discussion here points clearly to a number of assumptions required to make adjustments to SST that are and continue to be a not be well documented or understood. The current article attempts to deal with the assumptions by assigning uncertainties while at the same time noting that establishing uncertainties (and biases) is a work in progress. If I were using these data for scientific papers I would think my science instinct would be more inclined to point to the need for further study (as the current paper suggests) and as SteveM’s blogging spoke to than to merely insist (or hope) that future adjustments and the concomitant results will not change any conclusions already made in scientific publications.
Let us see: we started in 1963 and the latest paper says we need more analyses. That surely sounds like a work in progress and those who use these measurements should be thanking anyone who pushes for further analyses and not attempt to downplay those efforts.
I just reread the May 08 CA post, and, unless I missed it, I don’t see any form of a prediction or quantitative certainty laid down by Steve. It just points out that there are overlooked errors. Besides, isn’t this the more important item anyway???
Reading back through some of the old bucket posts here I noticed that it was said that the original forms from the 1940s Merchant Marine were “unfortunately shredded” back in 1970’s. I looked up how the Merchant Marine were recording their obs. back in the 1940’s and it looks like they used a Weather Bureau Form 1910 AB. There is a place to indicate whether the temp. was taken by bucket or intake. When the records were digitized, does anyone know if that information was included?
The form I am looking at is in Wm. Donn’s “Meteorology with Marine Applications” p.216 from the 2nd ed. 1951.
Correction on above comment; the form is 1210 AB and I found the info on the ICOADS digitization on another of the ICOADS posts. So “never mind”.
In Donn’s preface to his book he mentions that “As of January 1, 1949, the new International Weather Code, both land and marine, replaced the previous code in effect since 1942. The forms of reports from both land and marine stations were also changed considerably.” I expect I will find this has been dealt with as well.
I very much doubt the thermometers used by the ER to determine the sea water inlet temperature were of the same quality standard as those supplied by the Met Office for recording weather information. If the inlet thermometer was inaccurate by 2 or 3 degrees it was of little concern. Just another variable amongst too many.
Gavin sounds jealous that he didn’t find the problem and thus is trying to compensate by belittling the importance.
Steve,
Gavin has to earn his RC pay. He is having to work hard to keep the RC faithful in line. For well paid professionals like those at RC and the other AGW promo sites, truth is no hindrance for making big claims.
All temperature reconstructions suffer from one VERY arbitrary assumption in relation to the measurement method of sea surface temperatures SST (buckets of various types, engine):
For the HadSST3 temperature data set and successors, it was assumed that 30% of the ships shown in existing metadata as measuring SST by buckets actually used engine inlet:
“It is likely that many ships that are listed as using buckets actually used the ERI method (see end Section 3.2). To correct the uncertainty arising from this, 30+-10% of bucket observations were reassigned as ERI observations. For example a grid box with 100% bucket observations was reassigned to have, say, 70% bucket and 30% ERI.”
The supposedly supporting argument for overwriting of data is as follows:
“It is probable that some observations recorded as being from buckets were made by the ERI method. The Norwegian contribution to WMO Tech note 2 (Amot [1954]) states that the ERI method was preferred owing to the dangers involved in deploying a bucket. This is consistent with the rst issue of WMO Pub 47 (1955), in which 80% of Norwegian ships were using ERI measurements. US Weather Bureau instructions (Bureau [1938]) state that the \condenserintake method is the simpler and shorter means of obtaining the water temperature” and that some observers took ERI measurements \if the severity of the weather [was] such as to exclude the possibility of making a bucket observation”. The only quantitative reference to the practice is in the 1956 UK Handbook of Meteorological Instruments HMSO [1956] which states that ships that travel faster than 15 knots should use the ERI method in preference to the bucket method for safety reasons. Approximately 30% of ships travelled at this speed between 1940 and 1970.”
It is very hard to believe that this reasoning justifies overwriting of data to such a huge extent. And it is absurd to say this alteration was done “to correct the uncertainty”. Not believing and overwriting data increases uncertainty and does not correct it.
This particular alteration increases the difference between 1940s and recent SST from about 0.2 to 0.3 degrees and hence accounts for about 50% of the warming since then.
———————–
Facts and quotations assembled from climateaudit:
One Trackback
[…] and Engines, The Team and Pearl Harbor, Bucket Adjustments: More Bilge from RealClimate, Rasmus, the Chevalier and Bucket Adjustments, Did Canada switch from Engine Inlets in 1926 Back to […]