Temperature stations are known to be affected by numerous forms of inhomogeneity. Allowing for such inhomogeneities is an interesting and not very easy statistical problem. Climate scientists have developed some homemade methods to adjust for such homogeneities, with Menne’s changepoint-based algorithm introduced a few years ago in connection with USHCN among the most prominent. Although the methodology was entirely statistical, they introduced it only in climate literature, where peer reviewers tend to be weak in statistics and focused more on results than on methods.
Variants of this methodology have since been used in several important applied results. Phil Jones used it to purportedly show that the misrepresentations in the canonical Jones et al 1990 article about having inspected station histories of Chinese stations “didn’t matter” (TM- climate science). More recently, the Berkeley study used a variant.
Anthony has today drawn attention to a statistical discussion of homogenization procedures, in which Demetris Koutsoyannis is a a coauthor.
In commentary on USHCN in 2007 and 2008, I observed the apparent tendency of the predecessor homogenization algorithm to spread warming from “bad” stations (in UHI sense) to “good” stations, thereby increasing the overall trend.
I requested a copy of Menne’s algorithm at the time of its introduction, but was refused. While information on the algorithm has subsequently improved, I haven’t subsequently had occasion to re-visit the issue. At the time, I observed:
Menne’s methodology is another homemade statistical method developed by climate scientists introduced without peer review in the statistical literature. As a result, its properties are poorly known.
I expressed a particular concern that Menne’s algorithm might be spreading UHI warming at low-quality stations to better-quality rural stations through biased detection of changepoints. In a comment on the Berkeley study,which used a similar method, I noted their caveat that the methodology had not been demonstrated against systemic biases (such as widespread UHI)
however, we can’t rule out the possibility of large-scale systematic biases. Our reliability adjustment techniques can work well when one or a few records are noticeably inconsistent with their neighbors, but large scale biases affecting many stations could cause such comparative estimates to fail.
In a post on the application of changepoint methods to radiosonde data, I cited Sherwood’s similar criticisms of changepoint methods for homogenization, noting that his criticisms were similar to mine on USHCN adjustments:
Finally, when reference information from nearby stations was used, artifacts at neighbor stations tend to cause adjustment errors: the “bad neighbor” problem. In this case, after adjustment, climate signals became more similar at nearby stations even when the average bias over the whole network was not reduced.
Working through the homogenization algorithms is not a small job and, unfortunately, it’s one of many issues that I haven’t pursued. Nonetheless, I’ve continued to be somewhat wary of changepoint algorithms as an automated method of curing defective data. My own instinct, based on practices of geologists, is that, for practical purposes, it’s best not to assume that all data is of equal quality, but to work outwards from the “best” data, “best” being in terms of ex ante standards. In the case of temperature data, long rural stations with known and consistent measurement methods.
I do not plan to parse the new study or to examine the impact of the biases identified in this study on the major temperature indices. It is evident to me that it is presently warmer now than in the 19th century – a point that has never been disputed at this site. However, the statistical properties of changepoint methods deserve very close examination, and the new study by Sterou and Koutsoyannis will help to mitigate the neglect thus far of this important issue by the “community”.


120 Comments
“I do not plan…”
Well, of course not. It’s much easier just to use it as a jumping off point for unsubstantiated insinuations about how stupid climate scientists are for not talking to statisticians. If you did look into though, you’d find that the analysis is all about detecting changepoints within a single series – with no nearest neighbour comparisons at all. Thus you would have been hard put to suggest that this study indicates that ‘bad data’ was being spread around. So, you are right. Better not to look into it and stick to uninformative smears instead.
And your interpretation of the Sterou and Koutsoyannis study is what exactly?
Gary, is there anything specific in my post that you believe to be untrue or unsubstantiated?
As happens far too often, people put words into my mouth and criticize me for something that I didn’t say.
You accuse me of stating “this study indicates that ‘bad data’ was being spread around”. I don’t see anywhere in this post where I said that. Nor did I make a specific endorsement of this study other than as a contribution to a topic (changepoint algorithms as a homogenization methodology) that deserves close attention. I quoted from an article by Sherwood in the peer_reviewed_literature and from a caveat from the Berkeley study.
I re-read my post in light of your criticism and don’t see the inaccuracies that you allege. So again I would appreciate clarification.
Briefly (if it’s possible) why is working through homogenization algorithms not a small job? Assuming that you have access to the algorithm in the first place that is.
Give it a try and you’ll see.
@Paul Penrose
You’d be waiting a very long time for something useful out of me on that score.
But from my limited perspective, all of the checking processes involved look like a sheer cliff face. I just wondered why this was anticipated to be especially difficult.
Talk about “unsubstantiated insinuations” . . .
As I understand it, the point being made is that homogenisation algorithms risk introducing bias if their properties are poorly understood (as with any other algorithm).
Novel algorithms not subject to expert scrutiny are self-evidently at higher risk of having an unexpected effect. A lack of statistical expertise is acknowledged (a point made by the ASA amongst others)
The fact that the algorithm is brought to bear on what you want to subsequently regard as a single series is neither here nor there.
Consider the physical reason for an inhomogeneity and the perceived requirement to adjust for it in the first place; sensor failure? change of position? upgraded equipment? If a “single” series is created by changepoint detection and splicing, how do the two series affect one another at the point a join is made? Do end-of-life / settling in errors bleed through from either direction?
Well done for being first incidentally.
Gary, are you familiar with the methods used for homogeneity adjustment? IIRC, Dr. Koutsoyannis explains that the Standard Normal Homogeneity Test method used by GHCN forms a “single” time series as a function of a candidate series (subjected to test) and a number of reference time series. The SK12 simulations create synthetic time series of candidate and reference series and then apply the SNHT method.
Hmm. yes he describes the process of correcting GHCN v3 as SNHT.
hmm. I pretty sure that the PHA algorithm is not SNHT.
The detection of the breaks in the pairs in PHA is the same as the one used in SNHT. The rest is not. It is a matter of taste what to call it. At least the PHA is clearly more accurate as the standard SNHT method.
Thanks vvenna.
I looked at PHA code a while ago and even at that early stage it was clearly not a simple SNHT. Someday, I hope to get around to doing it in R, but many other things to do b4 that.
PHA = predecessor homogenization algorithm Obvious to me only after it’s obvious. Did not find it in acronym link
Well Gary, climate scientists not talking to statisticians is pretty stupid considering how they’ve blundered around in a discipline in which they have no formal expertise. And it is hypocrital considering how some of them take offense when non-climate scientists dare try to have an informed opinion on their subject.
Re: Bob K. (Jul 17 14:04),
I’d still be very interested to know exactly what qualifications, expertise and/or experience is needed before one can claim to be a ‘climate scientist’. And hence distinguish oneself as supposedly superior and more capable to those who ‘aren’t a climate scientist’.
There are departments of atmospheric sciences as a few universities, but most of the celebrity climatologists (Mann, Hansen, etc.) don’t have those degrees. So yes, that’s a very good question.
“climate scientists not talking to statisticians”
How do you know they don’t?
Here is in interesting talk given by Matthew Menne and colleagues at the Statistical and Applied Mathematical Sciences Institute (SAMSI).
Re: Nick Stokes (Jul 17 18:03),
H’mmm
A 45 minute(?) overview talk given three years ago isn’t much evidence of a strong collaboration.
And I’d have been more interested in the statisticians comments to the climatologists rather than the other way round. The point at issue isn’t that statisticians need better climatological skills……..
“isn’t much evidence”
But it’s some. What’s your evidence that they aren’t talking?
Ok, Nick, how about no statisticians as coauthors or listed in acknowledgements, how about being unaware of some basic statistics, how about making up new methods and never testing them or relating them to the literature, and how about not understanding statistical arguments on blogs? And no, evidence of 1 conversation does not let them off the hook.
Here is some additional evidence that climate scientists do collaborate with statisticians, but also a call for greater interaction.
http://www.amstat.org/news/climatechange.cfm
Steve: I made a narrow point that the use of changepoints algorithms for homogenization was not well understood statistically. Your link does not demonstrate the involvement of knowledgeable statisticians in the topics of primary coverage at Climate Audit.
@Steve
I was following up on Nick’s point. It was a general point about statisticians and climate science. But as to your point, did Koutsoyannis work with any statisticians when preparing his abstract? Or any climatologists for that matter?
Nick, thanks for bring this presentation to our attention. Although it doesn’t show that statisticians have collaborated, Menne and his coauthors understand that such collaboration is needed, and I greatly respect them for that. Perhaps the collaboration they seek will come to fruition and serve as a model for other climate scientists to follow.
“the analysis is all about detecting changepoints within a single series – with no nearest neighbour comparisons at all.”
IMAO, detecting changepoints in a single series and then calling these as non-climatic shifts in the data is even more dubious than doing it when the station shifts relative to a neighbor. That method risks identifying actual shifts of climate as being due to something like a station move or whatever. Such an analysis would find that something like 90% of temperature stations in Alaska need to be adjusted circa 1976-77…
Re: Gary (Jul 17 09:11),
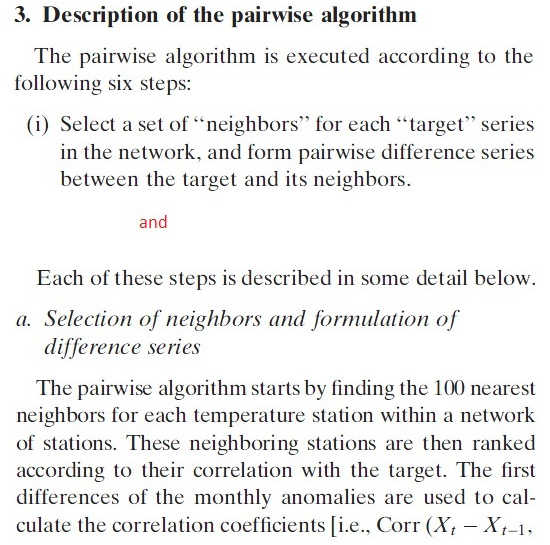
Is Gary referring here to GHCNM? He leaves this vague, but this seems the most likely homogenization in this context. As Menne, M. J., and C. N. Williams Jr. (2009), Homogenization of temperature series via pairwise comparisons, J. Clim., 22, 1700–1717 is the reference for homogenization in GHCNM v3, perhaps he would like to expand on how he reconciles the description in that paper (extracts, page 1702, below) with the claim quoted above?
One wonders why it always seems as if many of those who come here to criticise, like Gary, Roger and others, aren”t satisfied unless and until they say something offensive. That may be the mode on RC and some of the other blog sites, but it is certainly not the norm here.
Gary,
My take away from this was quite different from yours. Here is what I took away. It’s a hard problem to determine what the actual temperatures are and were. The negative in the commentary was that the algorithms were “hidden,” “I requested a copy of Menne’s algorithm at the time of its introduction, but was refused.” I think that’s fair game, when a relatively small number of people are advancing an agenda that the world is warming and the entire economy has to be restructured to “green” technologies. Yet, from what I gather reading here, Climate scientists have tried to not share their data, with the excuse their professional careers are more important than double checking the work. Climate Scientists really are like the Catholic Church prior to the Renaissance: believe the word, sorry you can’t read it.
Other than that, I suspect this is interesting because it’s a hard statistical problem, and one that requires some deep thinking. Like polling, it’s merely a reflection of the reality. That to me is more honest, which is to say, “I don’t know the truth, only don’t expect me to believe you just because you think I should.” Isn’t Science supposed to be all about replication and verification of results? If you’ve been reading Nature, you will there is a large concern over bias, hopefully unintentional, though not always, it has become a rather large topic. Climate Scientists should clean up their act as Steve has suggested. This is merely another example of why it’s important.
1057, Peter Thorne to Phil Jones, June 3 2009:
“Of the analyses that seemed robust, they tend to find little or no uhi bias in homogeneity adjusted data. My view is that this is because the adjustments to account for sudden changes in the micro and local scales which, by the very nature of comparison to neighboring stations, adjusts for subtle meso scale biases. Everybody wants to add an estimate of what UHI bias might be into their error bars, but it seems to me that
rather than trust folk lore that there is a uhi bias, they first need to find one systematically in the network. Until they do that, the former is just hand waving to appease the know-littles. Jim Hansen adjusts his urban stations (based on night-lights) to nearby rural stations, but if I recall correctly (I’ll send that paper shortly), he warms the trend in 42 percent of the urban stations indicating that nearly half have an
urban cold bias. Yet error analyzers want to add a one sided extra error bar for uhi…..”
Is this implying that the urban is adjusted to the rural (so that you can say that you did), then bodged? I assume there is more to it than that, but am unsure how a homogenization method can tend to favor one direction of adjustment.
Matt, I believe he is saying that in ‘some’ cases they ‘adjust’ in the other direction from, um, what you’d ‘expect’.
So, I guess I could say it’s even worse than you appear to have been thinking.
RTF
Excellent summary of the state of play, Steve.
I would like to say that in my opinion, the reason why the things that “don’t matter (TM- climate science)” really matter (as I’m sure you are aware) is because when you put together enough of all those things that “don’t matter (TM- climate science)” you have a net effect that can “matter” quite a bit. And not just over 100 years or 112 years, but over, say, ~75 years, or say, ~33 years.
RTF
One issue that I’ve thought was strange was why homogenize at all? If there is a site that is believed to be UHI contaminated then it would seem more reasonable to just remove it from the data set than to try to adjust it. Adjusting it is just guessing. Just approximate the data from the remaining sites.
Unfortunately, there are very very few records without gaps or changes in location/instruments/time of data collection over 100 yrs. That is why you need to homogenize.
Craig —
I agree you need to make adjustments for (or otherwise take into account) the changes you meantion, but homogenization goes far beyond that.
The Delaware, OH USHCN station, for example, hasn’t had a daily reading since 1/31/01, yet in the homogenized USHCN2 monthly data it has been churning out evidence of warming ever since then.
There is a big difference between mere adjustment and outright fabrication.
My preference on the changes you mention would be to just treat them as multiple stations each with its own mean over its own period of observation, rather than to adjust using questionable assumptions, but that’s a different topic than homogenization.
I haven’t looked at the details of the homogenization process but trying to modify group of discrete series to merge them into one long record does not seem like a very robust method on the face of it. All of the adjustments are guesstimates. As Hu suggests why not treat each piece as an individual station with a separate mean and trend? Wouldn’t UHI (for example) then show up as uncertainty in the answer (admittedly a bias) rather than being drowned in the adjustments?
Barry —
UHI is more subtle than a station move or equipment change or TOB change, since it is gradual. Thus, when the Columbus OH station moved from a rooftop downtown to the airfield c 1948, there was a recorded station move that could easily be treated as a new station. But since 1948, aviation has grown enormously, and so has the “airfield”. This has presumably caused a gradual UHI bias that is much harder to quantify.
This solution is to discard such airport readings and try to stick with reasonably good rural stations. Out of 28 Ohio USHCN stations, not all are good, and some (like Urbana) are really bad, but at least 0 are airports.
But out of 10 CRU stations in OH, 8 are airports. We now know this thanks to Willis Eschenbach’s 2007 FOI for CRU station IDs. (I’m counting “Cincinnati” as being in OH despite its presence in KY.) So CRU seems to be going out of its way to include UHI. (Likewise GHCN)
Even sticking to rural stations can be problematic. Rural stations are more sensitive to specific (i.e. not relative) local socio-economic changes than urban stations. Pielke Sr. would probably argue that a rural station that has gone from wilderness to farmland will have a warming bias.
I view this as a confounding problem which I’m not certain can be adequately addressed. Land stations are almost always sited where there is human activity. One could argue that because well sited urban and rural stations show similar trends that the issue has been resolved. Here is a two-bit analysis that demonstrates otherwise 🙂
00 – rural negative bias, urban negative bias
01 – rural negative bias, urban positive bias
10 – rural positive bias, urban negative bias
11 – rural positive bias, urban positive bias
When both bits are the same, 00 or 11, then the two populations can show the same trend but the bias hasn’t been removed.
[quote]Unfortunately, there are very very few records without gaps or changes in location/instruments/time of data collection over 100 yrs. That is why you need to homogenize.[/quote]
Actually this was one of my very first clues that the IPCC had little to do with Climate and everything to do with Change. If they truly cared about climate back in 1990, AR1 would have recommended funding for upgrading climate monitoring systems in areas of the world where data was lacking. It would have identified uncertainties in the available data and funded research into improving the uncertainties. This silence was continued in 1995 etc.
One of the things that I noticed when comparing the TOBS data with that “corrected” for the different states of the Union (see Bit Tooth Energy for the results by state) is that the r^2 values for the correlations between temperature and elevation, temperature and latitude and temperature and adjacent population frequently got worse after the homogenization.
Craig, I would prefer fewer, more reliable stations contributing to the datasets, rather than more less reliable ones.
If there, as yousay, too few of these then we should turn adjustment methods on their head and only use the best, least UHI affected, stations to adjust the less good ones.
Make it a one way process, only “good ones” adjust “bad ones”. Unless a specific microclimate effect(s) can be shown to make a completely rural station unreliable, then the adjusted slopes of nearest urban sites should mirror that of the rural.
What do you think the effect of this would be?
Unfortunately, the UHI effect is not the only inhomogeneity in the climate record. Then removing such stations would be a good solution. However, every long time series contains some inhomogeneities. Much happened in the last one or two centuries.
There is a cooling effect due to deurbanisation of the network, for example, because many city stations moved to airports. In the 19th century temperature measurements were made at a North wall, in the beginning of the 20th century often in shelters that were open to the bottom. In the US you have the time of observation bias and the transition from observations to automatic weather stations. Thus homogenization is always needed.
After homogenization you do not see a difference in the trends anymore between urban and rural stations. Thus homogenization seems to be able to remove the UHI effect successfully. It does not only remove jumps, but also gradual changes happening at one station.
In homogenization a candidate station is compared to its neighbors. As they all have about the same regional climate signal, a small jump in the data can be much more easily detected in a difference time series.
If you work with pairs, as the USHCN does, and you detect a break at a certain date in the difference between A and B and between A and C, but not between B and C, you can attribute the break to station A. With more stations this become much more reliable. This is the way neighbors are used, the candidates data is not replaced by an average of its neighbors, as is often suggested in these circles.
More information on homogenization:
http://variable-variability.blogspot.com/2012/01/homogenization-of-monthly-and-annual.html
yes victor. I’ve seen some work ( and done some work) where the UHI effect visible in unadjusted data is absent or diminished in homogenized data. Since UHI is modulated by synoptic conditions one can see that rather than a gradual change over time it can manifest itself and does menifest on a seasonal basis. Not in all cases but typically in severe cases. in other words UHI has a high frequency component and suppositions that it is entirely low frequency aren’t based on a solid physical understanding of the processes.
Dear Steven, indeed homogenized data is not homogeneous data. It is not perfect. For computing long term trends, decadal variability or modes in the climate system it is quite good, but you should know the limitations. The best example would be someone interested in city climate and the relationship between weather and health. They should use the raw data and stay clear of the homogenized data.
The methods that you draw attention to, whatever their merit or lack of merit, are, to my kniowledge, “homemade methods” developed by climate scientists. As noted in the post, I do not believe that the properties of these methods are well understood in a statistical sense and would believe that the methods would be more convincing if presented in statistical journals prior to important applied uses.
Steve: I’m mainly self-taught in statistics, so I’ve read hundreds of papers to try to learn what I can. One of the things that you get a feel for after reading (not necessarily comprehending) all of those papers is how a skilled statisticians, fisheries scientists, engineers, and economists think and write. Their papers have a certain feel and precision.
I’ve tried reading several key climatology papers and they definitely don’t feel the same. In fact, they feel a lot like term papers I wrote in graduate school. They really aren’t in the same class as statistical papers, and often rely on ad hoc methods that feel like a clever undergraduate wrote them, clearly having done no investigation of what statisticians and economists had already invented.
There seem to be some very talented folks involved in modeling, but they seem to have no concept of how large the uncertainties in their models/data are, nor how to propagate the uncertainty through their model to their results.
I think “homemade methods” is pretty much the key point here.
Wayne, if you consider how statistical methods are used in the academic literature taken as a whole you will find a lot of variability in quality. In many of the “soft” sciences statistical methods are nothing more than tools for overcoming the obstacle of getting a significant p-value: how you do it is less important than doing it. One professor of speech communication that I knew used to run SPSS on his data with the “give me everything but the kitchen sink” option and troll the voluminous output for any p-value that was less than .05. But even some of the “hard” sciences use statistical technques rather poorly, too. And, some disciplines maintain higher standards of statistical practice, with economics (“econometrics”) and psychology (“psychometrics”) having contributed to statistical science as a whole. Where does climate science (paleoclimate reconstruction) rank in all of this? My guess would be somewhere between the 40th and 60th percentile of quality.
So Victor, why have these stations been adjusted multiple times in the past few years, and why are they still being adjusted down in the past and higher today?
Dear Hum. 🙂
I am not sure whether this statement is true, but I have seen it often in the blogosphere. Good reasons for trends being stronger nowadays are improvements in the detection power of the homogenization algorithms (state of the art algorithms decrease the errors a factor 2 more than the traditionally used SNHT) and that nowadays more and more data is being digitized. Inhomogeneities are detected by computing the difference of a candidate station with one or more of its neighbors. If there is more data, these neighbors will be better correlated, have a more similar regional climate signal. The noise of the difference time series will thus be smaller and the breaks are easier to detect.
For both reasons the quality of homogenized data is nowadays better than it used to be. As the measured temperature values before 1950 used to be too high due to radiation errors, removing more inhomogeneities could increase the trend.
Is the “artificial climate data with known inhomogeneities” used in the HOME project to test the homogenization algorithms available somewhere?
Dear RomanM,
Yes, you can download them from my homepage:
http://www2.meteo.uni-bonn.de/mitarbeiter/venema/themes/homogenisation/monthly_homogenization_HOME.html
Have fun analysing the data.
[RomanM: Thank you. I will take a look at what is there.]
The trick of course is defining ‘reliability’
of course some people will say that unless the thermometer is quad redundant and calibrated daily and located in the middle of nowhere and never moved it isnt reliable. And the conclusion will be that we have no knowledge, except that it was cooler in the LIA and warmer in the MWP and sunspots explain the record that nobody trusts and oh ya we trust everything recorded in 1936.
A neat test would be for folks to take the 100 most reliable sites. Use only 50 and see how well you can estimate the temperature at the location of the other 50.
Give me the other 36,500 and i’ll do the same estimation.
The problem is not calculating the average temperature of the world. the problem is estimating the temperature at unobserved locations.
Question: The post you reference Zeke pointed out this to you
https://ams.confex.com/ams/19Applied/flvgateway.cgi/id/18288?recordingid=18288
did you get a chance to look at that or this
http://www.clim-past.net/8/89/2012/cp-8-89-2012.html
Is this the kind of testing you would suggest?
Anthony Watts is referring to the “paper” to which Demetris Koutsoyannis is coauthor as a “peer reveiewed” study, when in fact it is nothing of the sort. It is merely an abstract for a presentation at a conference organised by Koutsoyannis himself.
As anybody who has ever presented at a conference knows, abstracts are not peer reviewed. The “authors” could write anything they wanted and because it isn’t subject to review, it will be published as an abstract.
When this is taken into consideration, it certainly makes a large number of Anthony’s regular contibutors look a bit foolish as they gesticulate wildly, holding this “paper” up as “proof” that global warming is “man-made”. Some even go as far as claiming this one non peer-reviewed conference abstract as evidence the world is actually cooling.
Steve: I understand your antipathy to commenters “gesticulating wildly” and seizing upon a single paper as
Unfortunately, this tendency is quite widespread, not just at Anthony’s blog. His commenters have their faults, but I wouldn’t rank this particular fault as among the most serious.
Perhaps you should look at their study before concluding that it has to be wrong because it wasn’t peer-reviewed.
They may well be right Tom. My point is the misrepresentation of it. Steve understands that as he rightly refers to it as a discussion.
Steve: in this case, I think that it would be more accurate to say that Anthony made a mistake in referring to the paper as “peer reviewed”, a mistake that he promptly corrected when informed. The mistake seems inconsequential to me, since being “peer reviwed” is not a talisman of truth in climate science, particularly when pal review seems to be far too prevalent.
Mr McIntyre
uknowispeaksense has been writing about the people who read your blog.
http://uknowispeaksense.wordpress.com/2012/07/18/denier-comment-of-the-day-july-18-2012/
It’s a free world.
peaknonsense and lack are a real class act – their conversation at the link you gave confirms their playground maturity level. Ignore them.
Tom.
What i saw was set of powerpoint slides.
Hardly soemthing that merits comment.
he tested SNHT and made the weird claim that GHCN V3 was adusted with this method. But the data he looked at was GHCN v2. he doesnt provide a station list so you cant tell if he really selected long stations. Point of fact a long record in GHCN v2 is not necessarily a long station. why? because records get stitched together in GHCN v2.
So he looked at GHCN v2. which isnt used. no station list.
he studied SNHT and claimed that GHCN v3 is adjusted with this method. its not. PHA is used.
Weird.
What I find most odd is this UHI issue has been around a long time, and it doesn’t appear any one has really got in to it to compare rural vs. urban vs. suburban in a reliable comprehensive way. Even a Regional study would be useful to rough size issue. But more importantly focus on how to account for which I think was the main focus of the “slides”.
The study may be flawed, but it hints that there may be some there there. I would so like to read a study to know if it is a significant issue or as Phil Jones says nothing at all to be concerned with. I just can’t take his word for it.
So how is it that it doesn’t get worked on with all the climate funding around?
GHCN V3 and V2 differ only slightly. Just the small warming increase happening with about every update. Why should that matter ?
Don there are several regional studies. typically they study large cities versus rural sites. Those studies bound the problem. For large (mega) cities you see UHI bias ( average over time ) of around .05C to .125C per decade. That’s the US, Japan, Korea. Same in China. Thats the worst cities you can find. City studies, London, brussels, a few others, long term you find the same thing. Now, pick a big city and pick the worst day.. 5,6,7 C. Those studies are focused on finding UHI max. Most of okes famous work is on UHI max.
Suburbs? problem. we are now just building objective measures of different kinds of urban zones ( all with different UHI) different kinds of rural zones.
Global studies? hansen jones.. parker and peterson, not really on point.
its pretty simple why people dont study it. Toss all the mega cities out of the database and your effect shrinks to undetectable.
Manfred. it matters because.
A. was is V2 or v3. auditors like to know these things.
B. why does he test SNHT to evaluate homogenization?
15 different techniques were blind tested and scored,
yet he doesnt reference that work which shows objectively how well various approaches work, including that applied to v3.
C. people thump their chest reading an abstract. nobody asked for data or code. nobody reads. people like the ‘conclusion” so they promote grey science.
Given v2 is referenced throughout the presentation, and v3 is just referenced once, I wouldn’t rule out the possibility of a typo on that one, although if so it is a particularly unfortunate typo. Have you tried asking the author?
If their 163 stations include stitched together stations, then it certainly weakens their conclusions. Presumably, given that one of their criteria was the availability of raw data, it should be possible to identify whether the 163 are individual stations or amalgams with reasonably high confidence. I don’t know whether the authors did this or not, or whether their sampling criteria may bias to select one way or the other, just noting it should be feasible to check with a little work and the right databases to hand.
Oh and the irony of a blog comment dismissing a conference presentation for not being important enough to take note of is not lost on me 😉
‘If their 163 stations include stitched together stations, then it certainly weakens their conclusions. Presumably, given that one of their criteria was the availability of raw data, it should be possible to identify whether the 163 are individual stations or amalgams with reasonably high confidence. I don’t know whether the authors did this or not, or whether their sampling criteria may bias to select one way or the other, just noting it should be feasible to check with a little work and the right databases to hand.”
The work of finding this is quite tedious.
For example, in the following post I took unadjusted data worldwide to search for cooling sites.
Basically you find cooling sites typically have a structural break in the data. Like the site
I detail here which moved from the city to the airport on the outskirts
And if you want to know why an airport is more cool than the city, that’s even more work
Dismissing a conference proceeding with a blog comment may look strange to you. But there is a bit more behind that comment than merely the words.
Uknowispeaksense_ I will call you out to show where Anthony said “peer reviewd” anywhere in his post. He said it was presented at the European Geosciences Union meeting. Fess up you post inaccurate information.
I missed where he did but one ofhis readers didn’t. If you scroll down through the comments, Anthony admits his mistake. I have a screenshot at my blog.
I saw it earlier myself. As Steve said, he made a mistake and corrected it. Given the nature of the findings and that he gave a presentation of the paper at an EGU meeting, I’m sure there will be lots of peer review in the future.
Stay tuned, uknowispeaknonsense.
Steve, neither would I. I find it comical and sad at the same time.
“Steve: I understand your antipathy to commenters “gesticulating wildly” and seizing upon a single paper as “proof” that global warming is “man-made”.”
What I read in WUWT is that HALF of the warming might be due to FAULTY homogenization.
So which of these versions is the precise one?
Steve: I thought that the larger debate was whether global warming was anthropogenic. I was amused by the idea of WUWT commenters gesticulating wildly that global warming was man-made – conduct surely more characteristic of sites like CLimate Progress or Desmog.
“Steve: I thought that the larger debate was whether global warming was anthropogenic. I was amused by the idea of WUWT commenters gesticulating wildly that global warming was man-made – conduct surely more characteristic of sites like CLimate Progress or Desmog.”
Some jokes are inevitable (“the hockeystick is Mann-made global warming”), and what I saw at WUWT was commentators PRETENDING to gesticaulate wildly in the style of warmists. Some add a smiley, some add “sarc”, but sometimes the reader has to do the work himself to understand that it is supposed to be a joke.
Whereas the strength of Climate Audit is that it is “just” a technical blog, the strength of WUWT is that it is not.
Victor Venema,
“There is a cooling effect due to deurbanisation of the network, for example, because many city stations moved to airports.”
Seriously? Airports are vast expanses of concrete and asphalt pavement. Certainly in the summer there is a warming not a cooling bias.
The rationalization of the airport moves causing cooling is based on the fact that the airports were much smaller when they were first created and out in the country. Many were basically little more than grass/dirt strips when they were first created. Now however they are often surrounded by asphalt and concrete as well as containing large amounts themselves (not to mention jet engines instead of a few prop planes). Washington National is a prime example of an airport that has been surrounded by urbanization.
Its more complicated than that.
A city transforms the landscape reducing evapotranspiration. That can lead to a decrease of cloudy days. Its actually pretty easy to test. data is all there , I’ve got a post on an example of how you do this
In reply to Lancifer:
It depends where the airport is and the surrounding area. The weather station for Los Angeles was moved from downtown out to LAX airport, which is right on the
Pacific Ocean. It is several degrees cooler at the later location. Moving the wx station from downtown Fresno to the airport relocated it out into the countryside. With time, some of the airports have become surrounded with urbanization, and the temps likely have risen. I’m thinking San Diego, Portland, etc.
Actually in japan and other places some airports have a cool bias.
UHI effect is modulated by wind and surface roughness. Thats why its really bad in anti cyclonic conditions.
airports are often placed in locations with long fetches.
windy days, long smooth fetch gives you conditions that work against UHI. It’s not as simple as the picture some like to paint. also put an airport by a body of water and you have a whole nother can of worms. Finally, sometimes the station data indicates the station is ‘at’ an airport and its not.
Sorry unkow… I see he has changed the post, I read it after the change I guess.
Steve, you said, “The mistake seems inconsequential to me, since being “peer reviwed” is not a talisman of truth in climate science, particularly when pal review seems to be far too prevalent.”
Well de Freitas and Willie Soon can certainly attest to that at the Journal of Climate but only in climate science? Really? Surely there are journals like Energy and Environment for example that could be subject to the same criticism?
I guess I just can’t get past the idea of ‘adjusting’ data before analyzing it. You collect your data, and then you analyze it. If you have to do something to your data after you’ve collected it to make it respectable enough to use, then are you doing proper science?
The typical answer in these situations is ‘well, it’s the best data we have, and we can’t do the analysis without it.”
As if that’s a legitimate excuse. If I do an experiment in a lab, and I collect the data improperly, I don’t get to fudge it sideways into what I think would have been produced if I had used proper methods. Essentially, once you ‘adjust’ your raw data, it’s not ‘the data’ any more – it’s a product of your adjustment. In this case, you’re analyzing temperature readings that never existed.
The ultimate response to my ‘typical answer’ above should always be “if you think you have bad data, then tough tittie – you don’t get to publish. Statistics is not there to correct your methodological mistakes. I just don’t see how statistics can be used to go back in time and collect accurate data.
I think that readers are being far too negative.
Station data has inhomogeneities, but it’s the data that we have.
From a craftsmanship point of view, I think that homogenization by changepoint analysis warrants very close attention and any efforts to analyse it as a technique are to the good.
My preference would be for specialists to identify and discuss the very best stations in the world and to build out from them. I think that this approach would also be more convincing to those people who are dubious of the adjustments.
From my point of view it would be more proper to apply the change point analysis to identify the uncertainty of the measurement rather than change the actual data. For a rough example, if you ran an experiment measuring temperatures in 100 beakers and some showed anomalous results would you “adjust” the results of the ones that were different from the others? You might delete them if you could show exactly why they differed, but would you not show all of your results?
You need to rememembr that the purpose of the collection of the data was not to calculate global averge temperature. It was mainly because people were interested, weather forecasting, agriculture, calculating whether your plane was going to take off….So it’s not bad data (that is unfair on hard working observers in post offices and airports and agricultural colledges etc).
This is why “a few good men” or “the best of the best” is probably the right approach if you want get some accurate idea of whether and by how much the global temperature is changing rather than homogenising (“data torturing”).
Dear Steve
Thanks for the detailed explanations. I had previously thought that ‘homogenisation’ was simply the process by which historic temperatures were systematically lowered by up to 1 degree while recent temperature were raised to make it appear that CO2 was causing a steady rise in Global Temperatures as required by the IPCC.
Clearly there is more to this story.
From the Steirou and Koutsoyiannis presentation:
“Homogenization results are usually not supported by metadata or experiments(…)
Example: change of thermometers-shelters in the USA in the 1980’s
* No single case of an old and a new observation station running for some time together for testing of results is available! (…)”
This is science?
@Martin
“No single case of an old and a new observation station running for some time together for testing of results is available”
That is a killer blow. What we have here is a data series composed of “apples and oranges”.
No verification has taken place therefore no meaningful comparisons, or adjustments, can be made, pre and post change.
No this statement is not science. It is wrong. It is not always possible to make parallel measurements, you do not always know that a change needs to be made several years in advance, but if possible parallel measurements are performed at every change. And people also rebuild old measurements set-ups to be able to compare their measurements with modern ones and study the differences and its causes in detail.
This was definitely not the case in the USHCN station histories that prompted much recent consideration of the data. Or to my knowledge, in the past – not just in temperature stations, but other important indices like radiosondes. If this has become more standard practice, excellent. Hopefully, this has been a positive outcome of some of the criticisms.
This seems like an excellent initiative, though again it seems fairly recent and presumably the various criticisms have contributed to the interest in this sort of experiment. I was disappointed by the lack of interest in such experiments by institutions funded to examine the long-term instrumental record (notably CRU and GISS.) It struck me that both institutions were more interested in IPCC and the larger questions than in the important but less glamorous task of doing careful analysis and special studies of the instrumental record, which would lead to studies of the type that you describe. It is encouraging that such studies are now taking place.
As I’ve said on multiple occasions, I’ve never taken issue with the idea that it’s warmer now than the 19th century. I have taken issue with the lack of craftsmanship, even lack of interest in important details of the instrumental record, at CRU. It is encouraging that others, such as yourself, are now doing what you can to remedy that situation.
I do not work at a weather service, but I also have the feeling that making parallel measurements in case of a change of instrumentation is becoming more common and that that is mainly due to you guys. I can also only welcome all your work trying to get the data in the open. For someone working at a university that makes work easier.
Making parallel measurements in itself is quite standard and has been done from the beginning. Each time you develop a new instrument or shelter you compare it to the standard. It is so standard that often there are only reports. There are also many boring long WMO reports with intercomparison studies with many different instruments. The press is not interested in such craftsmanship, they like controversy.
Just have a look at this page of the WMO department for intercomparison studies:
http://www.wmo.int/pages/prog/www/IMOP/intercomparisons.html
Steve: On numerous occasions, I’ve expressed my support for more emphasis on technical reports and far less emphasis on articles in Nature and Science.
The WMO page seems to offer projects which compare newer instruments and housings with other older ones – as you describe, comparing to a standard.
It would not seem to be effort to conduct parallel comparison of stations.
Hi, vvenema.
Roughly what % get parallel comparison ?
Please ask again in a few years. I have written a proposal for a COST Action (a type of EU project) to gather these dataset and put them in one open database.
To write the proposal, I already found a dozen parallel measurements from literature, without looking much yet. These published ones are the long ones. The shorter ones performed for homogenisation only are typically kept at the national weather services. A lot of short ones are also informative, we will also gather those.
“it is presently warmer now than in the 19th century”: that seems plausible to me. What’s extraordinary is that after so much money has been spent, no demonstrably competent and honest estimate of how much warmer seems to have been provided by the, how shall I phrase it?, Climate Science entrepreneurs.
This may remind us of a well-known technique of meta-analysis. Let a group of experts judge the quality of time series studies without giving them the results. Next, the results can be contrasted with the judgments. Quite often claimed effects become smaller as the quality increases.
Higher amplitude warming at higher latitudes remains the only reasonably testable (that is, within our lifetimes) prediction that has emerged from AGW theory. Few stations there. Mosh says that infilling where there are few stations is the big problem, not deriving a global average. That seems right if you want to validate the key prediction of AGW. Others here say that the best way to proceed is to only use the very best stations. I guess it all depends upon what you are trying to accomplish.
“There is a cooling effect due to deurbanisation of the network, for example, because many city stations moved to airports.”
Strange.. would have though that this is precisely data that should not be adjusted as it is real.
That would certainly be a testable hypothesis. One would expect to see a sudden drop relative to those that did not move followed by a rise (back to the reference sites) as the area urbanized.
Yes, the data is real. However, if the station moved from the city to the airport in year 19xx, you will get a temporal jump in your time series for this region in 19xx. This jump is not real, this jump did not happen in the regional climate in the year 19xx, but an artefact.
You can chose not to combine these two time series, but then you have to solve the same problem he moment you use these shorter time series to compute an average climate signal over a larger region.
The deurbanisation of the Austrian network is described in:
Böhm, R., Auer, I., Brunetti, M., Maugeri, M., Nanni, T., and Schöner, W. Regional temperature variability in the European Alps 1760–1998 from homogenized instrumental time series, Int. J. Climatol., 21, 1779–1801, 2001.
“You can chose not to combine these two time series, but then you have to solve the same problem he moment you use these shorter time series to compute an average climate signal over a larger region.”
There is no problem to solve. You have two different time series. The pronlem comes when people think you need long series to reconstruct the temperature field. You don’t. have a look at how we handle the problem in the Berkeley Method.
Like I wrote, it can be done. I am working on this myself for trends in extreme weather; daily data is difficult to homogenize. Thus for daily data I can see the advantages of working with short time series of the homogeneous subperiods. Mosher, could you show that your method produces more accurate global temperature trends as one would get using homogenization? I would like to read that paper.
If you have a 19xx jump, it also means that you have had an increase in disturbance before 19xx. This steady increase is not corrected while the jump is. In conclusion, non-homogenized series are more reliable for long-term trends.
For regional or global averaging, the use of short or cut series actually gives results comparable to a means calculated from long homogenized series.
If you have a 19xx jump, it also means that you have had an increase in disturbance before 19xx. This steady increase is not corrected while the jump is.
Exactly. Instead of “correcting” out the “bubble” (the steady increase which is almost certainly mostly UHI), the entire time series prior to the step is “pushed down” to match the data after the step change. This is what causes the “past to cool”. BEST will not fix the problem either because it leaves in the rise before the step change, which is actually what should be homogenized away.
What is an “increase in disturbance”?
My simple example was just about that one break. If there are other breaks or local gradual changes, you also have to correct them.
I don’t know if this is exactly what phi had in mind, but here is just one example of a steady increase prior to the step change:
It is either quite a coincidence that the temperatures are trending up prior to the step and then trending flat after, or the steady increase is not a real climatic occurrence, but instead something else (such as UHI). When you homogenize the two time series, you “push down” the blue curve to match the green curve. This is what causes the past to cool.
vvenema,
Moving a station from city to airport (your example), you get a consistently lower temperatures. This drop corresponds to a correction of the UHI that grew in the city. The rise of UHI has a continuous character which is not identified and not corrected. You are probably familiar with Hansen et al. 2001 which describes this mechanism. Böhm et al. 2001 also recognizes that the bias of homogenization is mainly an effect of the UHI but it does not draw the logical conclusions.
JR,
Yes, that’s what I have in mind.
JR, homogenisation does not mean to simply put the end of the blue line at the beginning of the green line. One would need to have a neighbouring station to judge the situation. If only because the variability of the annual temperatures is 1 to 2 degrees and inhomogeneities are typically much smaller.
It could well be that in this case the move to the airport did not make much of a difference. The mean of the data up to 1942 and the mean between 1942 and 1970 seems to be about the same. But you really need some neighbouring stations.
vvenema
“And people also rebuild old measurements set-ups to be able to compare their measurements with modern ones and study the differences and its causes in detail”
Is there any evidence for this statement and if so where has it been published?
Recent well written papers are:
Böhm, R., P.D. Jones, J. Hiebl, D. Frank, M. Brunetti,· M. Maugeri. The early instrumental warm-bias: a solution for long central European temperature series 1760–2007. Climatic Change, 101, pp. 41–67, doi: 10.1007/s10584-009-9649-4, 2010.
Brunet, M. Asin, J. Sigró, J. Bañón, M. García, F. Aguilar, E. Palenzuela, J.E. Peterson, TC. Jones, PD. 2011. The minimisation of the “screen bias” from ancient Western Mediterranean air temperature records: an exploratory statistical analysis. Int. J. Climatol., 31: 1879-1895 DOI: 10.1002/joc.2192.
You will find many more older references on different weather shelters and their influence on the mean temperature in:
Parker, D.E. Effects of changing exposure of thermometers at land stations. Int. J. Climatol., 14, pp. 1–31, 1994.
My preference would be for specialists to identify and discuss the very best stations in the world and to build out from them. I think that this approach would also be more convincing to those people who are
Steve
Are you planning any work along those lines.?
Steve: no. that’s a job for people on the ground. There are many met services that should be doing this work on their own data. .
I have been looking at the breakpoint analysis used by GHCN V3 and I have posed several questions to Matthew Menne. He has replied to all my queries and noted where more work was required with the GHCN algorithm.
In my mind the key to using breakpoint analysis for making adjustments for non homogeneity for temperature series is being able to establish a realistic simulation of the non homogeneities and natural climate events that might occur in the real world and then testing the algorithm in question on that data. Various organizations have been attempting to do just that under a process they call benchmarking. If a realistic simulation can be developed for testing I would think that a good evaluation of the candidate algorithms would be possible and it would be objective. It could also be used for placing CIs on the final adjusted results.
What I have problems with in a number of these adjustment algorithms is how much the process depends on meta data – with meta data not necessarily being objective. I think the Best process attempts to do the adjustments without meta data, but I have not analyzed that process sufficiently to determine how well that exclusion works. Finding breakpoints is subject to the amount of noise in a series and some of the noise in individual series is reduced by actually doing the breakpoint analysis on difference series with nearest neighbors. Even with difference series the noise can hide all but relatively large breaks in the series. This is easy to show in simple simulations. Obviously, if meta data is allowed to key the looking for breakpoints or to assume a non homogeneity in the series, the meta data can help the process but only if the meta data is valid.
What I found with the GHCN algorithm was that I could continue to find breakpoints in nearest neighbor difference series after the TOB data was adjusted to the Adjusted series with the algorithm. I asked Menne if they were contemplating using more than a single iteration with the algorithm and he told me they were looking at it.
Several algorithms developed to adjust for non homogeneities in station temperature series were evaluated (benchmarked) by an European organization (see link below). The published results had some interesting results for the GHCN algorithm whereby they found it did well in obtaining true mean adjusted regional temperature series from the simulations but not so well in obtaining the true adjusted station series. I thought the benchmarking used in the European study was more comprehensive than that devised to specifically test the GHCN algorithm. These simulations need not only provide a look at realistic non climate non homogeneities but climate related ones as well. Also the simulations need to provide a means of looking at the adjustments with and without meta data.
Click to access 2011_cost_home_homogenization_benchmark.pdf
Some background is provided in my post today:
http://www.staatvanhetklimaat.nl/2012/07/18/credit-where-credit-is-due-more-on-homogenisation/
Victor Venema is commenting there as well and Koutsoyiannis is planning to write a guest post there in a few days.
Marcel
Thank you, vvenema,for the leads. Those few to which I could get without paying Wiley a fortune certainly support your argument. By the way did you notice the link between all the three papers that you quoted? – P D Jones, D E Parker and the Met Office.
You can go to your local university library and print it.
If Phil Jones would not be interested in homogenization you would also complain.
Did you read the book Heisse Luft by Reinhard Böhm? If someone is not an alarmist, it is Reinhard.
Feel free to redo the experiments yourself and expose this conspiracy. It is easy.
Steve seems to forget the most important error
Statistics are supposed to apply to identical samples.
Linear regression, if applied to time series, automatically emphasizes the least reliable information. “Trends” should be based on a small number of the most recent measurements, not on those of 100 years ago.
The idea that all errors are equally up and down is also wrong, as it fails to take into account persistent bias which may not be always identifiable.
Sea level is a good example as an upward bias is caused by storm damage to equipment and unknown land subsidence. Recent installation of GPS equipment has reduced or eliminated most :trends:
I wonder if I’d be allowed to cook … er … um … sorry … keep my books using a similar approach?
Heads up. Even though this site does not appear to run ads a Russian “ad server” is somehow interacting with this site and attempting to establish contact with the servers (and maybe even clients?) of those accessing this site.
Still working through all the comments… but one thing I’d like to see explored in the adjustment and homogenizing processes is how they deal with 60 year cyclical weather regime changes.
During cold phase of the PDO, for example, the jet stream is more loopy (deeper Rossby Waves) while during the warm phase they are more ‘zonal’. This means there can be a rapid and pervasive shift of the relationship between a station and it’s “neighbors” (as The Reference Station Method lets them be up to 1200 km away). So a relationship is established in one 30 year period, then can be applied in a period with dramatically different relationship (per what I’ve seen in the GIStemp code).
IMHO, that is a major potential source of error.
Right now the West Coast of the USA is having a quite cold time, while the East Coast is hot (all due to deep Rossby Waves of opposite direction, unlike in the prior warm phase of the PDO). Similarly, England is wet and cold while over in Russia hot air is headed to the N. Pole to dump its heat. Relationships changed…
So IMHO any statistical method to find “changepoints” also has to be able to allow for a periodic sudden break in relationship that is in fact quite valid. From what I’ve seen, the methods used do not address this point.
Its easy to test whether that Potential source of error, is in fact a source of error. dont use RSM. and dont homogenize.
answer doesnt change.
@vvenema
In my experience “Well written” and “P.D. Jones” are unlikely bedfellows.
Don, did you read the articles? Or is this just an example of your open-mindedness as a sceptic? 😉 (And well written articles often contain the most (small) mistakes. If the language is a bit difficult to understand this stimulates the reviewer to think more. Thus this combination would actually fit your prejudices.)
I can give you some other papers. How do you like these?
From a time before man-made climate change:
Margary, I.D., 1924. A comparison of forty years’ observations of maximum and minimum temperatures as recorded in both screens at Camden Square, London. Q.J.R. Meteorol. Soc., 50:209-226 and 363.
Marriott, W., 1879. Thermometer exposure — wall versus Stevenson screens. QJ.R. Meteorol. Soc., 5:217-221.
Or from a reliable Dutchman:
Brandsma, Theo. Parallel air temperature measurements at the KNMI-terrain in De Bilt (the Netherlands) May 2003-April 2005, Interim report, 2004. http://wap.knmi.nl/onderzk/klimscen/papers/Hisklim7.pdf
Van der Meulen, J.P. and T. Brandsma. Thermometer screen intercomparison in De Bilt (The Netherlands), Part I: Understanding the weather-dependent temperature differences) Int. J. Climatol, 28, pp. 371-387, doi: 10.1002/joc.1531, 2008.
Or from a reliable Norwegian guy:
Nordli, P. Ø. et al. The effect of radiation screens on Nordic time series of mean temperature. International Journal of Climatology 17(15), doi: 10.1002/(SICI)1097-0088(199712)17:153.0.CO;2-D, pp. 1667-1681, 1997.
I did not read all of these papers yet, but I guess the titles are already sufficient to disproof the original claim that there are no parallel measurements to validate the breaks found during homogenization. It is just not the kind of literature that makes it into Science, Nature or the New York Times. Luckily some colleagues still do it because it is important work.
This venom from Victor Venema may be worth commenting on.
How can we find the reference station for temperature homogenization?
I have 30 met stations temperature daily average data. Of these which one has tobe taken as reference and how?
8 Trackbacks
[…] Steve McIntyre concurs in a new post, writing: Finally, when reference information from nearby stations was used, artifacts at neighbor […]
[…] Interestingly, it is has been labelled as a “discussion” by Steve McIntyre over at his cite. He at least seems to have a grasp on what constitutes a […]
[…] Station Homogenization as a Statistical Procedure (climateaudit.org) […]
[…] Hockey Schtick. This blog then alerted WUWT? who brought the same news quite loudly and then also Steve McIntyre picked it up and Bishop […]
[…] temperature data homogenisation created some stir in the blogosphere after Watts Up With That? and Climate Audit paid attention to it. Koutsoyiannis has now written a guest blog to give some first […]
[…] Hockey Schtick. This blog then alerted WUWT? who brought the same news quite loudly and then also Steve McIntyre picked it up and Bishop […]
[…] https://climateaudit.org/2012/07/17/station-homogenization-as-a-statistical-procedure/ […]
[…] old (IPCC) method of station homogenization is discussed by Steve McIntyre at Climate Audit. He notes that the method used by the IPCC “is another homemade statistical […]