The apparent inconsistency of ring width chronologies with analysis of changes in treeline elevation has long been an issue that I’ve urged specialists to address. Unfortunately Briffa et al 2013 failed to address the inconsistency at Polar Urals, even though they took note of an obsolete Shiyatov article on treeline changes. (More recent work by Shiyatov’s group has reported that medieval treelines at Polar Urals were even higher than previously thought.)
Worse, there have been significant changes in treeline at Polar Urals over the past 1500 years, an inhomogeneity that needs to be considered in RCS standardization. With the indecisiveness that is so characteristic of Briffa’s work, Briffa et al 2013 noted the possibility of altitude inhomogeneity, but then failed to investigate the problem or demonstrate that they could ignore the inhomogeneity.
Treeline Changes
For a number of years, I’ve been very interested in treeline movements as an index of centennial-scale climate changes. A survey of such changes is long overdue. Shiyatov’s work at Polar Urals is one of the most detailed and remarkable analyses and it is very disappointing that Shiyatov’s work on altitude changes is not clearly analysed in Briffa et al 2013, an article purporting to be a definitive treatment.
I noted Shiyatov’s work on treeline changes at Polar Urals in an early Climate Audit post here, which relied on Shiyatov 1995 and Shiyatov 2003, quoting Shiyatov (1995) which stated:
The 12th and 13th centuries were most favorable for larch growth. At this time the altitudinal position of the timberline was the highest, stand density the biggest, longevity of trees the longest, size of trees the largest, increment in diameter and height the most intensive as compared with other periods under review.
Reconciling this conclusion with ring width chronologies that record little variation between the medieval and LIA periods is something that seems to me to be a prerequisite for using ring width chronologies as useful climate proxies.
Shiyatov’s Altitudinal Transects
Shiyatov’s recent work (see Mazepa et al 2011) has resulted in substantial revision to his diagram of upper treeline at Polar Urals since the earlier work discussed at CA here, which was based on the relatively inaccessible Shiyatov (1995) which I placed online.
Shiyatov’s earlier work reported results from transects that went above present treelines, but only to 340 m. Newer transects have extended the sampling to 420 m and show that medieval trees grew substantially higher than reported in Shiyatov 1993, 1995 or 2003. The revision is shown in the graphic below, which plots the treeline values of Mazepa et al 2011 (Figure 11) on the previous graphic from Shiyatov 2003.
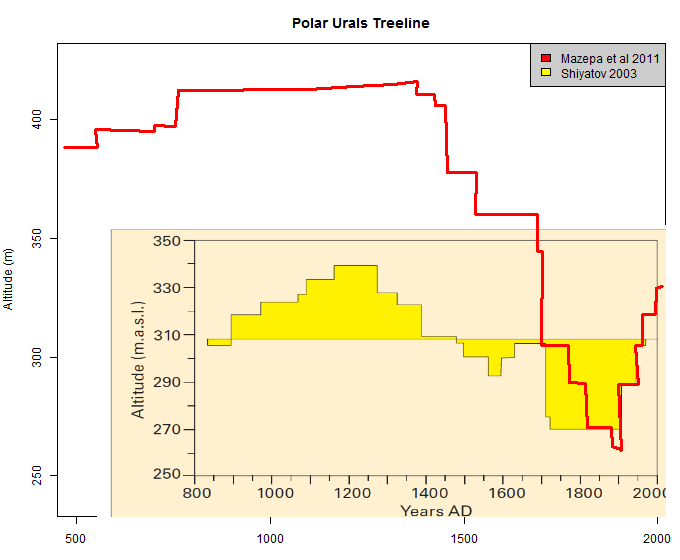
Figure 1. Treeline as shown in Shiyatov 2003 (PAGES) with digitized treeline from Mazepa et al 2011 Figure 11 shown for comparison.
Here is the actual graphic from Mazepa et al 2011:
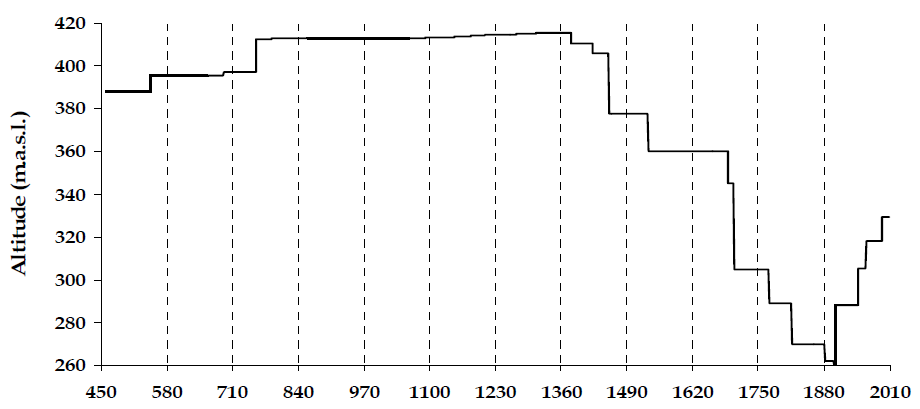
Figure 2. Mazepa et al 2011 Figure 11. Treeline elevation changes at POlar Urals.
The dramatic change is also evident in Shiyatov’s transect diagrams in which he plotted the floruit of each tree against time (vertical axis) and transect (horizontal). The diagram below shows results for the original two transects (up to 340 m). The high medieval treeline is evident by the trees on the left side of the diagram. The decline in treeline is shown by the developing gaps, with the complete absence of trees in the 19th century in the higher transect evident by the white space. Modern growth at about 250-260 meters is evident, with saplings and trees beginning to grow in the higher transect. Shiyatov observed that the modern treeline is rising rapidly and is limited by the rate at which seeds move uphill; he stated that the potential treeline under modern temperatures is higher than the present treeline. (Thus, to use treelines to compare medieval and modern temperatures, one needs to allow for the lag and allow for future increases in treeline. ) The left block of the diagram shows the higher 1983 transect (elsewhere Transect 2), while the right block is the lower 1968 transect. In the top margin, I’ve annotated an approximate altitude – only approximate to 10-20 meters since the slope is not uniform.
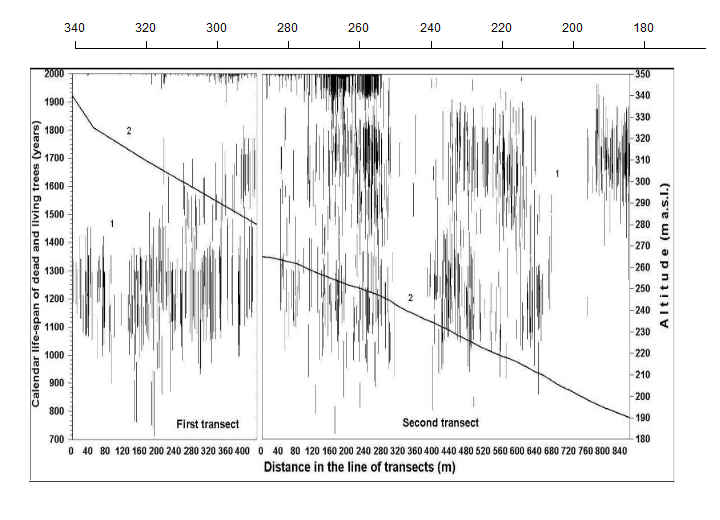
Figure 3. Tree floruits in two altitudinal transects from Shiyatov et al 2011 Figure 3. The y-axis is time. The x-axis shows the horizontal distance along each transect. The slope lines show the altitude (right axis) along each transect. The two transects go from about 340 m to 180 m. In the top margin, I’ve shown an approximation of the vertical altitude along the combined transects. It’s an indication as it presumes uniform slope. Shiyatov explains the gap at certain altitudes as due to local topography which results in high snow accumulation, slow melt and non-germination.
Although Mazepa et al 2011 was published in the same year as Shiyatov et al 2011, it includes information from new and higher transects and reports very different results. In the diagram below, I’ve spliced its Figure 10 – a much revised version of the upper transect – as the left panel below. (Visually the plot under 340 m looks similar to me to the earlier version though this is not stated in the article itself.) The new data shows that the medieval forest extended to the upper limit of the new transects (420 m), higher than previously reported. It also revises the time on which the great lowering of treeline took place.
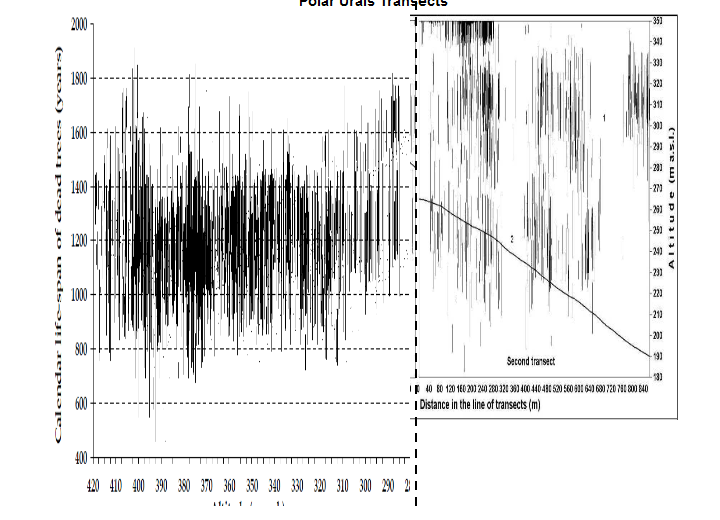
Figure 4. Splice of Mazepa et al 2011 Figure 10 with Shiyatov et al 2011 Figure 3, showing time vs altitude for Polar Urals transects.
From this data, Mazepa et al 2011 reported:
On the base of life-span for dead trees (more than 1200 pieces) which grew above current tree-line ecotone the estimation of the most high-altitude position of tree-line for the last 1500 years was received [sic – revised ?](Fig. 11). The most high-altitude position of tree-line during the medieval climatic optimum was estimated at altitude 400-420 m a.s.l. This border occupied the highest position during 13th and in the beginning of 14th centuries. After that the huge dying off of trees, decrease of sparse tree growth and light forests up to the beginning of 20th century has begun. Intensive decrease of this border and thinning of forest stands occurred in 15th and 16th centuries and especially in 19th century.
Briffa et al 2013 on Treeline Changes
Briffa et al 2013’s discussion of Shiyatov’s work on treelines is very inadequate. Here is a full quotation:
We note earlier work on tree-elevation changes on Rai-Iz Massiv, Polar Urals (Shiyatov, 1993) involving a survey of tree remnants extending over an elevational range from 280 to 340 m.a.s.l. during the period 850 to 1990 CE. This remains one of the most detailed studies of tree-line position and composition over time undertaken to date. This work showed an early phase of relatively high larch germination at approximately 1100-1250, a notable phase of tree death at 1300-1350 and a complete absence of germination along the whole elevational transect from 1650 to 1900. The strong phase of tree germination at high elevation at the start of the twelfth century revealed in Shiyatov (1993) implies a distinct warming at that time. While some high growth-rate intervals are evident in our chronologies during the 1100-1250 period (Fig. 9), they are neither continuous nor notably higher than earlier or later intervals e. g. in the 11th and 15th centuries. It should also be noted that while the study area was virtually devoid of living trees at the start of the 20th century, it is now covered in larch forest (Shiyatov, 2009).
With the perspective of the above review, one can see errors and omissions in the Briffa et al 2013 account arising in part from their surprising reliance on the obsolete Shiyatov 1993 (making no citation of Mazepa et al 2011, Shiyatov et al 2011 or even Shiyatov 2003. Briffa et al 2013 report medieval treelines only up to 340 m, though these results were superceded by the new transects to 420 m in Mazepa et al 2011. The die-off phase previously dated to 1300-1350 is dated later in Mazepa et al 2011.
They noted that high-growth intervals in their chronology were “neither continuous nor notably higher than earlier or later interval”, they did not reconcile the inconsistency between the chronology and the changes in treeline elevation. To more fully show the inconsistency, in the graphic below, I’ve overplotted a smoothed version of the Briffa et al 2013 Polar Urals RW chronology against Shiyatov’s diagram of treeline changes (showing the Shiyatov 2003 and Mazepa et al 2011 versions as above). I’ve centered the RW chronology to coincide with the reference altitude in Shiyatov et al 2003 and scaled the RW chronology to show the comparison of the RW chronology to the elevation changes. It is evident that the RW chronology has negligible centennial-scale coherence with the altitude changes. The failure of Briffa et al 2013 to grasp this particular nettle shows typical Briffa indecisiveness: the veiled allusion to the problem indicates their awareness and would be used by them as evidence of their awareness of the issue, but they failed to reconcile or even clearly report the inconsistency.
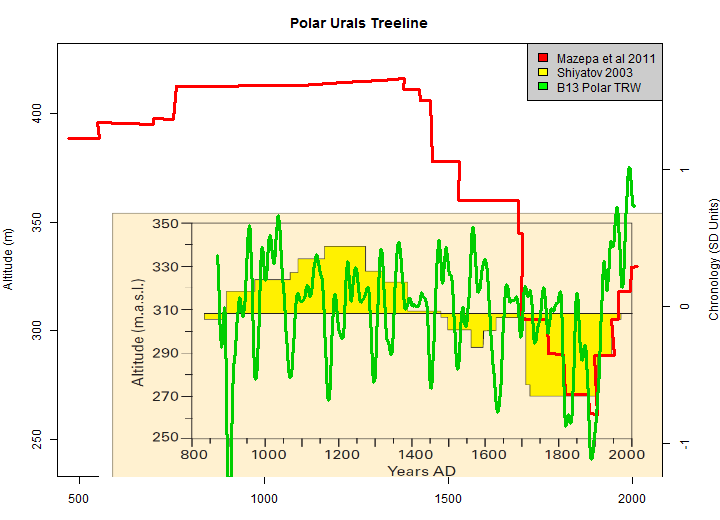
Figure 5. B13 Polar Urals RW chronology overlaid on treeline elevation of Mazepa et al 2011 and earlier Shiyatov 2003.
Altitude Inhomogeneity
It is evident that there have been substantial changes in treeline elevation on a centennial scale, presumably responding to temperature changes. On the basis that ring widths (and MXD) are proxies for temperature, altitude changes are an important inhomogeneity that needs to be allowed for: indeed, the problem of altitude inhomogeneity was raised in an early CA post here.
Unfortunately, Briffa et al 2013 completely dropped the ball on altitude inhomogeneity. They referred to the problem as a sort of CYA, but neglected to do anything about it. Here’s their only statement:
We have not investigated the influence of sample elevation on the absolute magnitude of tree growth or made any allowance for such differences in our analysis, but this may not be a very significant factor (Briffa et al., 1996).
The purported citation (Briffa et al 1996) stated the following as their “statistical” analysis purporting to discount the influence of altitude:
We examined the evidence for a time-dependent elevation bias in the reconstruction by regressing mean MXD against mean sample elevation for different age classes of trees … These results (shown in [their] Table 2) indicate no significant elevational influence on mean density, at least over the range of elevation involved in these calculations”
As noted at CA here, as too often, Briffa is totally at sea when it comes to even elementary statistical analysis. We know from first principles that temperature declines with altitude. Therefore, if ring widths (or MXD) are temperature proxies, then there must necessarily be a relationship with altitude. If, as Briffa et al 1996 claim, there is no (inverse) correlation between MXD (ring width) and altitude, then this, on its own, indicates a defect in the proxy.
On the other hand, since we know that the treeline has changed elevation over time, the supposed lack of correlation is probably nothing more than a failure on Briffa’s part to disentangle centennial climate changes from altitude. The original caption in Briffa et al 1996 stated:
The density data in each age class are averaged over different time periods so that effects of climate variability should hopefully largely cancel out.
This statement is no better than Briffa’s original attribution of the “Decline” to a cargo cult (see for example here). The high-elevation samples occur in the medieval period and were not averaged with Little Ice Age samples, because trees did not grow at high altitude in the Little Ice Age. In addition, there has been negligible recovery of medieval trees at lower altitudes because moss and other weathering have mostly destroyed lower altitude medieval trees. Low altitude trees are primarily from the Little Ice Age. The dismissal of altitude inhomogeneity in Briffa et al 1996 was based on worthless analysis, making the failure of Briffa et al 2013 to consider and analyse altitude inhomogeneity completely unwarranted.
In the new Polar Urals chronology presented by Briffa et al 2013, altitude inhomogeneity appears to be an extremely important issue, as the average altitude of living trees is notably lower than the average altitude of subfossil trees in the original Schweingruber sample. Briffa appears to have made the matter worse by incorporating the apparently inhomogeneous purlasi_sc dataset.
Briffa’s RCS methodology is extremely sensitive to inhomogeneity. Needless to say, CRU are very alert to inhomogeneities that go in their favor (e.g. root collar inhomogeneities), but obtuse to inhomogeneities that go the “wrong” way e.g. altitude at Polar Urals, purlasi_sc. Given Shiyatov’s unequivocal and convincing analysis of elevation changes at Polar Urals, it is unacceptable that Briffa et al neglected to even investigate the impact of sample elevation.


60 Comments
Attitudinal shifts in tree lines appear to provide a much better indicator of past temperatures than ring widths. How do the Urals studies compare with other regions, or is this work yet to be done?
Steve: there are a number of articles on treeline changes, but, as I observed in the post, there is no detailed survey. As an IPCC AR4 reviewer, I asked them to review this information, but they refused.
“Attitudinal shifts”. I love it!
Marc – Rob Wilson from the UK could answer that better than Steve/me, but Rob (as i understand) is in the process of doing this for Scotland.
forgot the link but start at –
http://www.geos.ed.ac.uk/homes/rwilson6
PS. some above links come up in non Scottish to me 😦
Steve: to my knowledge, Rob hasn’t written any previous articles on tree line changes. Would be nice if he took an interest in the topic.
found the link eventualy –
http://www.st-andrews.ac.uk/~rjsw/ScottishPine/
from Bishop Hill post – Feb 28, 2011 at 11:50 AM | Rob Wilson
as usual Steve your recollection is correct, for some reason i thought he was refering to a living tree/fossil tree line map of Scotland.
hope he pushes/has funds to achieve this, good luck on that Rob 🙂
Hi
I dont think Scotland would help for this specific issue as our pine woodlands have been impacted by man for so long that there is really no “natural” tree-line – the woodlands are all in a state of recovery. Also – bar bog and lake sediment, dead trees do no preserve well in our warm/wet climate, so finding potential “snag” material above current tree-line (~600m) is impossible.
NB. correct links are:
http://www.st-andrews.ac.uk/~rjsw/TRL/
http://www.st-andrews.ac.uk/~rjsw/ScottishPine/
Rob
Not sure if this is a typo or an abbreviation not referenced, or if I’m just missing something.
Figure 5 has TRW in the color key while the text refers to “RW”
“TRW” appears nowhere in this essay other than the color key.
Anthony – my guess is RW = Ring Width, and TRW is Tree Ring Width….
Quite a stark comparison in Figure 5 between Mazepa 11 (high Medieval treeline dropping off to a lower 20th century treeline) and Briffa ring widths with a 20th century hockey stick blade.
Is it the case that the treeline may have a stronger relation with temperature than ring widths, which can be affected by so many other variables?
The RCS method itself doesn’t seem ‘wrong’ to me. Taken at its intent, it is an ad-hoc method to separate age effects from environmental effects. I like it over purely mathematical signal separation processes as there is a forced continuity to the age signal. The age signal is more of a physical model than may otherwise be obtained. As Steve points out above (and Briffa also said in his critiques of a previous Yamal CA post in a climategate email) RCS can go wrong when applied to significantly different tree types or environments. The critique is reasonable and my limited experience with the RCS method left me with the feeling that this is an easy problem to encounter in the data mashing process.
This post is very good. Unlike tree ring widths, I don’t recall any viable explanation for tree line changes other than temperature. Hand waiving about long-term moisture changes kind of works but it doesn’t hold much weight when we are presented with an “improved” proxy of tree ring width or MXD. What more linear temperature proxy can there be than changes in tree line? It is hard for me to figure.
Keith Briffa is an interesting character. If he weren’t surrounded by so much scientific pressure, I doubt he would fall in the paleo-temperature sub-heading of dendrochronlolgy.
Steve: I think that people have given Briffa far too much leeway based on some emails in the 1990s in which he challenged Mann. Recall his role in the Briffa bodge, hide the decline and destruction of Wahl emails. He urged other dendros not to provide data to me. It was his nonsensical explanation of divergence that actually got me serious about the field: I found it impossible to believe that scientists could seriously accept such cargo cult. That he found some of Mann’s antics distasteful is not enough.
As an IPCC reviewer for AR4, I suggested that they mention some interesting studies of treeline changes as follows:
Briffa refused the suggestion as follows:
My memory was not correct. It was Phil Jones who made the critique (email 125423023):
The reason for AR4 rejection here is interesting because of the obvious lag in treeline temp response. Since treelines are unable to react to 30 year variability, and the treeline variance is pretty strong, it suggest that typical climate variance must be much higher than is shown in the TRW studies. What else can affect tree lines so dramatically and for so many years. A rejection for imperfect dating which inherently represses signal variance, completely ignores the contrary higher historic temp result. Unless they have a better reason for it than stated above, the reply is entirely unscientific.
Isn’t Phil Jones the “scientist” who could not make a graph with a linear fit in Excel? Not only that, since no one else was there, he could not do it in ANY program on his computer. I probably have ten different programs on my computer I can do a linear fit with. Or just get a free one online.
Says a lot about his abilities in other areas.
The biggest handicap that tree line movements present is that, as Steve states, they reflect centennial scale shifts. You lose the finer scale secular variation. If you look at paleobotanical studies along the west coast of the US, the evidence implies that the end of the Pleistocene witnessed a poleward shift of plant communities of roughly 1,200 km. In the Sierra and Cascades tree lines moved upward significantly, but I can’t recall the figure off hand. The chief aspect of these kinds of changes is that they reflect the migration of entire communities as they adapt to the changes in climate. Shorter term changes are not likely to be visible unless they are somehow reflected in growth rates, which is empirically logical, but not very convincingly supported by the available evidence. In California, the chief limit on Bristle cones seems to be geology more than any other factor. In the preserve in the White Mountains the discontinuity of plant communities at the contact between dolomite and sand is striking. I recall a ranger telling me that the sage brush living on the sand were surprisingly old. Some had apparently been around for up to three centuries.
Steve: the control between sagebrush and bristlecones at the dolomite contact was noted in McIntyre and McKitrick 2005 (EE) as follows:
Even in higher stands, their principal botanical competition in many locations is with big sagebrush [Wright and Mooney, 1965; Mooney et al., 1964] with bristlecones outcompeting big sagebrush on moister dolomite substrate. This effect is vividly llustrated by Figure 2 of Wright and Mooney [1965], where the sharp geological contact between the dolomite and sandstone is clearly shown by the change from bristlecone pines to sagebrush at the same elevation. The same effect is also perhaps shown in the charming 19th century painting (Figure 7), where a sharp change in vegetation at the same elevation is easily observed
Here is the Figure from Wright and Mooney 1985:

Also see this 19th century painting:

While on the topic of tree lines and Sheep Mountain:
What is particularly interesting is the advance of 10-20 year old seedlings (my estimate) toward the historical dead wood tree line. By comparing the foreground to the background, it is easy to see the live trees getting progressively smaller.
@Duster –
“If you look at paleobotanical studies along the west coast of the US, the evidence implies that the end of the Pleistocene witnessed a poleward shift of plant communities of roughly 1,200 km. In the Sierra and Cascades tree lines moved upward significantly, but I can’t recall the figure off hand.”
Would you be able to point me at or toward any sources on this?
The biggest handicap that tree line movements present is that, as Steve states, they reflect centennial scale shifts. You lose the finer scale secular variation.
Are you losing finer scale variation, or are you just gaining noise?
Nothing I have seen about tree ring widths suggests that I trust the fine graduations the dendrophrenologists love so much.
I do trust trees to have a “line” based largely on temperature, which is all the more reliable for not having any short term variation (fire, disease etc) show up in it.
Mooloo –
“I do trust trees to have a “line” based largely on temperature”…
This may seem a sensible position, unless one knows that biologists use tree rings as proxies for precipitation.
With a this other major forcing involved, extracting the forcing effects (which amount of TRW grow came from precip and which from temp) becomes hardly more than a guessing game. Maybe not even that.
As I think is often pointed out, bristlecones are sensitive to precip mostly, not temps.
Now, is treeline also sensitive to precip? I don’t hear anyone here asking that question so far. But I do hear some REALLY excellent questions and comments in this thread about other factors which may be more important. Still, “more important” can mean a lot of things. If the TRW range is X and precip contributes, say, 20%, that 20% can throw off the correct use as a proxy by a good bit – and one might never know it. And if it is 30%, all the worse. But looking back in our historical crystal ball Way-Back Machine, who can know whether it was 20% or 30% or 0% or 65% in any period? Assuming constant precipitation – is this a correct principle at all?
Excellent question. Tree line is in fact strongly affected by moisture. As one moves up a mountain the air becomes thinner and thus drier. In addition, the soil often becomes thinner. Initial establishment of forest on a peak may be a very slow process, but once established the forest builds up a layer of organic detritus that holds water, making it a better site for growth. Thus over hundreds of years the trees will grow better as this mat accumulates. The same thing has been documented on granite outcrops in the Canadian boreal. It can be observed that a fire that burns up a mountain peak forest can leave a bare region that does not regrow due to the consumption of this organic mat. I suggest then that mixing elevations of tree samples is perilous, and especially if the older trees are higher up.
There are multiple issues here that need to be kept in mind:
1. How do you convert an altitude value to a temperature value? I do not think that this is very straightforward as some sort of spatial calibration data-set would need to focus on trees (relic vs living) of similar age. However, the dead preserved snag material of the Medieval period sampled by the Russians likely represents mature trees (200-300 yrs old) while the living tree-line is most likely represented by young trees or saplings (i.e. you would need to wait ~150 years before the present tree-line is mature). These lagged responses need to be kept in mind. Going back to the Scottish example, we clearly have an expanding (up-slope) tree-line in some locations which has been occurring for the last 4-5 decades. However, at their maximal extent (ca. 650-700 masl), one would only find young saplings at this time.
2. From a RW/MXD point of view, even using RCS and related methods, we may NEVER be able to glean “true” millennial scale variability due to genetypical changes in the trees through time – i.e. during the present and Medieval periods, pines trees adapted to slightly warmer conditions would germinate, while in the LIA, individuals adapted to slightly colder conditions would preferentially germinate. Now – I have no idea how significant this latter point is, but it would potentially act as a high pass filter and dampen long time-scale information. To partly test this, one would need 100s of samples from different elevation for multiple periods over the last 1000+ years.
3. Incorporating the high (inter-annual to centennial) frequency information from RW/MXD with the longer time-scale information from such tree-line information would be an interesting challenge BUT the lagged response of tree-line and tree maturation would have to be taken into account. Other low frequency proxy records would help in this regards, but that opens up a further Pandora’s box of problems.
Rob
Steve: I entirely agree that “These lagged responses need to be kept in mind”. Shiyatov notes the lags and states that the present treeline is below the potential treeline – an entirely reasonable point and one that I meant to reinforce in the present post. I’ve added a sentence to avoid any confusion on this point. As to temperature-altitude relationships, the lapse rate is an obvious first approximation and one that is more sensible than ignoring the problem. What isn’t justified is ignoring the inhomogeneity as Briffa et al have done. As noted frequently, they are very alert to inhomogeneities that run against a Yamal HS, but very obtuse to inhomogeneities that go in their favor.
Rob asked: “How do you convert an altitude value to a temperature value?” That’s simple, you make the logical first approximation and multiply by a typical lapse rate of 0.65 degC/100m. The dynamic range on Steve’s Figure 2 is 140 m, a potential bias of 0.9 degC. If a potential bias this large is intolerable, you don’t publish until you have a satisfactory method for eliminating this bias (or data showing the actual bias isn’t as large as expected from this first approximation). If a bias this large is tolerable, then you have a duty to candidly discuss it in your paper and see if the referees agree.
Unfortunately, none of the information in this post seems to tell me what we really need to know: How did the altitude of the average tree contributing to Polar Urals reconstructions change over the period of the reconstruction? (Perhaps I’m missing something.) The 140 m shift in the tree line provides some hints about the potential size of the altitude bias, but nothing definitive.
Rob: “1. How do you convert an altitude value to a temperature value? I do not think that this is very straightforward as some sort of spatial calibration data-set would need to focus on trees (relic vs living) of similar age.”
How does statistical rescaling convert a tree-ring metric into a temperature, Rob? What physics grounds the “calibration”?
There is one very good reason for the inconsistency of ring width chronologies when compared with analysis of changes in treeline elevation.
“Cherry-picking”, as described by Esper et al.(2003) Tree Ring Res. 2003, p.92
“However as we mentioned earlier on the subject of biological growth populations, this does not mean that one could not improve a chronology by reducing the number of series used if the purpose of removing samples is to enhance a desired signal. The ability to pick and choose which samples to use is an advantage unique to dendroclimatology”
So it is quite easy to identify (post-hoc) your “treemometers”, by means of spurious correlation, quite another to ignore a tree stump at 402m on your transect.
Don,
a typical misquote and misunderstanding of what Jan Esper was discussing/showing in the paper.
Click to access Esper_2003_TRR.pdf
He was undertaking a sensitivity analysis to show how unstable the RCS method was when replication was low. His quote simply reflects the fact that in dendrochronology we have A LOT of data and can play such games to test methods. You cannot do that for an ice-core record.
Also – Steve Mac has hardly discovered anything new – there is much discussion on the disparity between TR based reconstructions and other proxy records (including tree-line changes) w.r.t. millennial scale variability. Staying with Esper as I know he would love me pointing you all in his direction :-).
Esper J, Frank DC, Timonen M, Zorita E, Wilson RJS, Luterbacher J, Holzkämper S, Fischer N, Wagner S, Nievergelt D, Verstege A, Büntgen U (2012) Orbital forcing of tree-ring data. Nature Climate Change, doi: 10-1038/NCLIMATE1589.
Click to access Esper_2012_NatureCC.pdf
enough time wasting. Back to work!
Rob
Steve: while I do not claim to have “discovered” the disparity between treeline elevation changes and chronology, I discussed this issue long before Esper et al 2012 (an interesting article that I’ve recommended from time to time by the way, though I didn’t give it the coverage that I would have liked to, in part because of Esper’s refusal to provide data.) I took issue with Briffa’s refusal to discuss such inconsistencies in AR4. BTW I did not see any specific mention of the inconsistency of treeline changes with RW chronologies in a quick re-examination of Esper et al 2012 (nor indeed any use of the word “treeline”). I note a reference to “coarse resolution Holocene proxies”, citing Wanner et al 2008 and Mayewski et al 2004, both of which deal on a Holocene scale.
‘we have A LOT of data and can play such games to test methods.’
Playing is fine if you stick to the rules and don’t lie , but sadly along with taken their ‘ball home’ climate ‘scientists’ love to do both of these ,alongside making great claims based on poor value inexact data
Rob Wilson says of Don Keiller’s quotation of Esper’s dicutn:
Keiller provided a direct quotation of Esper’s exact words so it was not a “misquote”. Esper may have selected his words poorly, but they are nonetheless his words.
RCS instability does not occur merely because replication is “low”. The larger problem is inhomogeneity between sub-populations. Briffa et al 2013 was alert to root collar inhomogeneity, a real enough issue, as I noted in my original post in this sequence. However, they are obtuse to other inhomogeneities, e.g. purlasi_sc, altitude and between river valleys/sites at Yamal, the latter a large issue that I haven’t written about in the present sequence, but which arises from their ad hoc exclusion of Khadyta samples.
Rob’s implication that the underlying point of Esper et al 2003 has been neglected is also untrue. Despite widespread use of Briffa’s RCS series in IPCC temperature reconstructions, there is precious little in dendro literature on how one tests for and deals with omnipresent inhomogeneity in tree ring data. Esper et al 2003 stands almost alone as an article that even broaches this dirty little secret in published literature. (I would appreciate any other citations from Rob on methodological articles on RCS and inhomogeneity.)
In my original articles on Yamal, I did a lengthy post describing the methodology of Esper et al 2003 as a homogeneity test and a follow-up post applying this methodology to Yamal.
Esper et al 2003 at least uses a somewhat intelligible framework to discuss inhomogeneity. It’s too bad that Briffa et al 2013 didn’t apply it.
As Rob observes, given the relative scarcity of ice core records, it is more difficult for ice core people to play “games”. However, Rob should not under-estimate the resourcefulness of Lonnie and Ellen Thompson on the one hand and Kaufman on the other. Lonnie’s Bona-Churchill ice core (2002) goes the “wrong” way and remains unpublished. The nearby Mount Logan ice core goes the “wrong” way – thus not “enhancing the desired signal” – and was excluded from the PAGES2K compilation as it was held to be “regional” whereas like proxies going the “right” way were interpreted as NH temperature. The medieval portion of the Lomonosovfonna ice core goes up, but was not used by PAGES2K. Ellen Thompson’s Greenland d18O and Antarctica d18O don’t show pronounced 20th century increases and she hasn’t archived anything. The PAGES2K South American data had a Quelccaya version that went down in the 1990s (a version never reported by Thompson himself who reported that the d18O data went up). The inconsistency has not been explained. Because the late portion of the PAGES2K Quelccaya data went down, Neukom flipped it over, thereby enhancing the desired signal. So even the ice core people have some “games” that they can play.
“However, the dead preserved snag material of the Medieval period sampled by the Russians likely represents mature trees (200-300 yrs old) while the living tree-line is most likely represented by young trees or saplings (i.e. you would need to wait ~150 years before the present tree-line is mature). These lagged responses need to be kept in mind.”
Where is the “lag” here ? The trees are still all dated with the first tree-ring.
I would think, the main issue is an underestimation of Medieval temperatures. If top temperatures lasted only a few decades, they would not be detected, because trees at the treeline could not mature and have not been preserved until today.
Pardon if any or all of this seems obvious, but:
After a pretty good dose of all the treeline info here, I get the strong sense that TRW/MXD and treeline are two separate things altogether and perhaps should not be mixed in with each other. The trees at the treeline would seem to be pretty “iffy” to use for TRW/MXD studies – often being stressed by various forcings that lower trees don’t suffer from. That inhomogeneity seems insurmountable from what I am reading – too many factors to be able to know what the TRW/MXD means and perhaps often being off the chart at the bottom end. As has been noted many times on CA and WUWT, the growth limiting factor can be one of several forcings, and identifying which one is controlling may never be more difficult than in high-stress areas.
At the same time, the treeline changes, as noted, do have their own signal, even if it is rather low frequency. One would certainly see that as a likely mirror of the TRW/MXD signal in the region.
I don’t think that addresses Rob Wilson’s point. Don Keiller makes the quote with the idea that Esper has made a shocking admission of cherry-picking to create hockey sticks. Rob WIlson says that’s not what the quote means.
Rob your comment “Don, a typical misquote and misunderstanding of what Jan Esper was discussing/showing in the paper.” is unfortunately all too typical of the response of climate scientists when confronted with a published (and verifiable)statement.
Deny and obfuscate.
While the change of tree lines with altitude and therefore temperature at the time might be adequate to explain the effects of interest to you, there are secondary factors that cause, or can cause, some more complications.
Larix spp. for example are ectomycorrhizal; they have a symbiotic relation with fungus-like organisms that affect their roots. In principle, it is not simply the altitude of the larch that can be affected. The abundance of mycorrhiza can also be affected by temperature (and nutrients) in ways that need not vary in the same primary way as the larch trees do in your description.
Then there are are some nutrients that tend to be leached from hill tops to accumulate in river alluvial plains, so that there can be a gradient established over time, from low nutrient concentrations at top to high lower down. This has a potentially primary effect on loss of vigour of higher altitude stands of forest. It takes but one of a score or so of essential nutrients to become limiting before yield loss commences.
There are biota that move pollen around, like bees and beetles. If these also have a preference for a certain altitude/warmth/humidity, one can envisage that they can establish an efficiency gradient as well, thickening the stands where they like to live. Depending on the species, the fertile seed can also migrate downhill from water transport before stopping at the point where it grows. The slope of the land also determines in part how far it travels.
Three examples is enough to demonstrate that the movement of tree lines, though primarily ideally attributed to warm/cool cycles, can be envisaged to involve a number of confounding variables that are little understood. The 3 examples I have given have the capacity to affect tree ring properties and hence confuse dendroclimatology.
Disclaimer: I have never worked with larch. If some of these 3 points are inapplicable, I’d be grateful to be told.
One thing that comes to mind is that all these factors seem to be things that can hold (or push) the treeline down the hill – they surely can’t push the treeline above the highest point that the temperature permits growth (for a particular type of tree). So even if the confounding factors make it too difficult to get robust temperature numbers from the treeline, it should still be possible to get useful temperature lower bounds from it, right? Such a lower bound graph might still conflict with (or be consistent with) a temperature estimate from ring widths or whatever.
anonymist,
Real life is more complicated. Given that several mechanisms (apart from temperature) can affect the vigour of a tree at a given altitude, and supposing that that tree gets relocated after death to a lower altitude, how do you reconstruct the altitude at which the fossil tree grew? (As a counter to your supposition, the bees might be more abundant higher up if there is another genus that attracts them. Not everything needs to gravitate downslope.)
There are even more confounding variables than I have listed, especially in mixed stands of trees. Moving to the antipodes of Yamal, more or less where I live, seed germination is assisted by bush fires for some species. The longevity of some trees is set by termite activity, which I’d guess would have some effect on ring growth as the infestation worsened.
Globally, the subjects of pests and diseases has been raised several times on CA, as has the more obvious problem of assigning growth rates to temperature versus water abundance. The underlying geology has an effect as noted above. Depending on the type of soil developed on a given geology, creep of soil can carry nutrients and even seedling trees downhill during the life of long lived trees.
Few of the mentioned variables can be held constant for the purposes of isolating temperature alone in the statistical treatment.
…………………………
It’s somewhat like doing bench chemistry with reagent bottles devoid of all labels.
“The density data in each age class are averaged over different time periods so that effects of climate variability should hopefully largely cancel out.”
At the start of a new project I’ll likely be ‘hopeful’ that things will go in a certain direction. But were I to seek to justify a key assumption in a report by resorting to the word ‘hopefully’, the client would, justifiably, demand his money back. How can these people be taken seriously?
Steve: I agree entirely. You’ll probably roll your eyes at the following Briffa-ism used to rationalize Hiding the Decline:
When I first encountered this, I could not believe that credentialed scientists could either write such bilge. That the authors of such bilge should be among the most respected members of the field was even more unbelievable.
“should hopefully” – It is hard to fathom that Briffa would have the gonads or the stupidity to put that word in an actual paper. It reeks of hubris.
I translate the meaning of that sentence as, “We couldn’t really get the Team’s message across with the data, even when massaging it by averaging over different time periods to smooth out the inconvenient MWP and the LIA signals, but we are certain that one of our team members will be able to do so in the future, perhaps with Mike’s Nature trick.”
I would find it hard to believe that in his many years working in the subject area he has not considered tree line movement.
I find it easy to believe both that reconciling this was may well be beyond him, or if he has looked at it that it just doesn’t give the right answer.
At these blogs we seem to get away from the basic problems with temperature reconstructions and too much into the details of the results. I find it a bit disorienting to have these discussions on the details as it tends to imply that there is not a basic problem that remains unresolved.
Dendro and non dendro proxies at this point in time continue to suffer from the problem of not having an a prior selection criteria based on a physical understanding of how the proxy responds to temperature (and other variables) and then using all the proxy data selected for the reconstruction. The biasing of temperature reconstructions by selecting proxies after the fact by how well those proxies happen to respond to modern warming is just plain wrong – regardless of the fact that many doing these reconstructions fail to understand that point.
The detailed results of these reconstructions on careful analyses only reveal what might be expected from the wrong-headed approaches used in selecting proxies for temperature reconstructions. Briffa 2013 is typical of the wrong approach and discussion whereby the authors offer a new and improved RCS method that significantly changes past results for a temperature reconstruction (losses the hyper hockey stick and states that RCS methodology is a work in progress) but never addresses the main issue of selecting proxies for the reconstruction and then using all the data. In fact as SteveM has pointed to here at CA in previous threads, the Briffa 2013 authors finally attempt to rationalize without hard evidence an exclusion of a proxy that was excluded many years ago and coincidentally had a high medieval warming. It is those decisions that result from the wrong-headed approaches.
I would want a much better understanding and discussion of all potential temperature proxies before I preceded to the details that are discussed in many reconstruction papers and unfortunately at these blogs in criticism. That would apply to tree line movement even when limited to centennial scale responses.
Thank you for a very clear statement that could well be generalized so that it applies to many other problems in the broader endeavor of climate science where it seems that many of the unknowns are not understood let alone the unknown unknowns.
@Kenneth: “At these blogs we seem to get away from the basic problems with temperature reconstructions and too much into the details of the results.”
I would respectfully disagree. The devil IS in the details, and broad sweeping principles/problems cannot stand/be understood without the foundation of those details.
Steve M, as a career auditor, comes at these issues from that detail-oriented POV, and that is what CA is basically about, as I understand him. His career of vetting mining claims probably was filled with such details, and he was able to become adept at discovering shenanigans only by looking into the depths of the full data. I presume that when Steve discovered naughtiness it was as well hidden in the data as possible and also cherry-picked to give the best appearance of future riches.
In addition, though the output of CRU and their Team members is, at the public consumption level a broad principle thing, it is built on a mountain of detailed data, and if that data is (either intentionally or out of ignorance) not fully presented (cherry-picked or incorrectly processed) there is little way the broad sweep can be correct.
“I find it a bit disorienting to have these discussions on the details as it tends to imply that there is not a basic problem that remains unresolved.”
I would disagree with this also. The entire point of this blog is that there are basic problems that have not been resolved – and that the indicators of that are in the details. If Steve M was not so thorough with the details, bulldog that he is, he would hardly have ever gotten anyone on the IPCC side to listen to him.
Steve: I’m not a “career auditor”. However, I have had experience in dealing with auditors and recognized that peer review for academic journals is not the sort of due diligence that people in businesses are used to.
@ Kenneth Fritsch (Jul 8 at 9:24 AM) —
Steve McIntyre’s blog-housekeeping activities sometimes bring archived posts to the attention of my post-Google-Reader reader. This morning, Feedly highlighted 2007’s An Excellent Sonechkin Comment. It links to remarks by Russian climatologist Dmitriy Sonechkin at Climate of the Past Discussions.
Sonechkin’s first three points likely sound like deja vu all over again:
1. …all Northern Hemisphere reconstructions published to date [give] qualitative information only…
2. Any calibration of proxy data is impossible if the target is decadal (and longer) temperature variations. The first reason consists of the general nonstationarity [of] climate… The second reason consists of more or less large inertia of all kinds of proxies…
3. Each proxy is a kind of thermometer with unknown scale. Moreover, such a thermometer often is inertial… Even moreover, some of such “thermometers” have their scale to be varying in time.
Steve: tagging is a function that wasn’t available originally. From time to time, when I review topics for a new post, I tag older posts. I too was struck by Sonechkin’s comments, comments that I’d forgotten about.
My particular expertise is plant physiology, so I reckon I am quite reasonably qualified to opine on the factors that limit plant growth.
The first observation is that plant growth and survival is the result of the interaction of a variety of environmental stressors, both abiotic and biotic.
Secondly these stressors can be more or less effective depending on the stage of development of the plant.
Thirdly, by extension of (2), it means that at different times during a plant’s lifetime different stressors may dominate.
By necessity, therefore, even if one finds a correlation with LOCAL temperatures (and let’s forget about “interactions with the global temperature field” rubbish)in some sub-group of trees within that area, then it is highly unlikely that those particular trees will be uniquely affected by temperature thoughout their life-history.
Anyone who suggests otherwise is simply not behaving as a scientist.
As Carl Sagan stated “Extraordinary claims require extraordinary evidence”- and such proof is sadly lacking in the dendroclimatology community.
So if you use the relationship of 0.65 deg C / 100 m altitude drop, and if the tree line is primarily temperature limited at high altitudes (either directly or indirectly) doesn’t that indicate that somewhere around 800 AD temperatures reached a point that was ~0.6 higher than they are today, with a decline starting in the 1300s?
Could you handle the altitude differences by segmenting the trees into narrow altitude bands to form sub-series and do the analysis on those series?
Steve: the modern treeline is advancing and it is possible that it will eventually advance to and perhaps surpass medieval levels. A similar lag may have occurred in medieval times though. From other proxies, the 11th century seems to have been as warm or warmer than the first half of the 13th century. It also seems to me that temperature decrease began in the mid-13th century. The Polar Urals treeline is lagged, but at least there is an interpretation.
For some reason, this post stopped appearing on my browser. It’s now re-appearing. Don’t know what happened. Anthony said that he’s experienced a couple of odd hiccups with WordPress.
No hiccups wrt posts disappearing here / feel free to delete.
It reappeared because it was somehow in the posts trash folder. I rescued it for you.
Steve: thanks for this.
Is there actually any data, that the treeline is responding solely to temperature?
Mont Ventoux (In France) was tree-covered, but logging due to the needs of the French navy, based at Toulon, led to its progressive deforestation.
The trees have failed to grow back at the mountain top, because it’s more arid now than previously. (Shades of Kilamanjaro’s snow line?)
Steve: Polar Urals, on an ex ante basis, is about as good as it gets for dendro. High-latitude, high-altitude, plenty of snow for moisture, no recorded human disturbance.
I’ve tagged some older posts that discussed treeline changes. See http://www.climateaudit.org/tag/treeline. There’s some interesting material.
Read through those links, thanks…quite a few studies that have been done (and you have cataloged) over the years.
One article that was discussed in the comment section some years ago, but was never mentioned in any posts is this study from Harvey Nichols. Seems pertinent for a quick re-read for those interested:
http://arctic.synergiesprairies.ca/arctic/index.php/arctic/article/view/2786/2763
This latest update (2012/2013) from Leif Kullman could also be pertinent, but is behind a wall: http://onlinelibrary.wiley.com/doi/10.1111/bor.12003/abstract
And finally, this article is actually written by an IPCC participant, but not in the paleo field. If I read it correctly in the skim, the authors find that changes in temperature account for 79% of changes in tree line elevation (that is a global figure): http://biology.duke.edu/jackson/GEB162.pdf
On another note, I do think that what Rob Wilson brought up earlier is indeed a salient point: what type of lag effect would we expect to find? The answer to that sounds like an enterprising project for a PhD candidate. Collating these studies, while determining a reasonable lag, could easily lend itself to a global, millenial-scale, low-frequency temperature reconstruction. The information seems like it it is there already, just needs to be organized.
On a different note, but presumably not OT: Is it not reasonable to believe that if this paper were PEER-reviewed, any actual peer would have caught, as SM did here, that the most recent papers (as, Mazepa 2011) were not cited by Briffa? (Yes, I am suggesting PAL-review instead.) Of course reviewers have neither the time nor incentive in most cases to look too deeply at the paper being reviewed, but wouldn’t this jump out right away to someone with intimate knowledge in the field? Just askin’.
Steve: I suspect that many logical peer reviewers are not familiar with Shiyatov’s work. For example, Rob Wilson would be a logical reviewer of B13. But I’ll bet that he was unaware of the comprehensive database at the Polar Urals transects or of the information in Mazepa et al 2011 prior to the present discussion at CA. If he knew about the big Shiyatov dataset, I’m sure that he would have mentioned it in our discussion in 2009 about replication at Yamal vs Polar Urals. I thought that I had looked at relevant literature at the time, but I wasn’t familiar with the most recent Shiyatov articles at the time of our October 2009 discussion or I would have mentioned them. So I wouldn’t read too much into the peer review failure other than recognizing that academic peer review often focuses on issues that relate more to gatekeeping than to ensuring a complete record.
A ‘true and fair view’ of the time series of ignorance, for each of the actors, including the auditor.
It’s in moments like this, for me, that CA is so educational.
I think this fits in. An image from WUWT showing the greening of the Earth due to more CO2. Note that the mountain foliage seems to be benefiting more than other regions.
Image:

Article.
Greening does seem to be relatively high in the dry bristlecone areas.
My 62 year old brother, who has been traveling to the White Mountains since he was an adolescent, claims that the Bristlecones have been erupting the growth of new shoots in recent years.
Steve: “Shiyatov observed that the modern treeline is rising rapidly and is limited by the rate at which seeds move uphill”.
Steve, does Shiyatov mention any limit on the receding of the treeline downhill? (See number 3 below.) He speculated on what I would call the hysteresis (the lag in rises and falls).
Three things I notice (reading solidity into the Mazepa et al findings):
1. Besides the MWP being present, Mazepa et al 2011 Fig. 11 almost seems to define the end of the MWP as about 1450 at that latitude – and the transition to the LIA as having happened VERY quickly. Since paleoclimatologists have no problem extrapolating arctic TRWs out to the entire planet, if that extrapolating is permitted with this data, one might be tempted to conclude that the MWP was not only present at the Mazepa locations but also extending all over the world. What works for Peter should work for Paul.
2. The tree line is not only considerably higher than Shiyatov, but also considerably higher than at present. This ties in quite generally with the Greenland Vikings and their successes and their demise. (It also may explain why Greenlanders are not yet raising cattle and crops presently: It just isn’t as warm now.)
3. Another Hysteresis point:The dive down to 1900 seems to suggest how fast or slow the treeline is capable of being lowered. I presume it is because of how long it takes for the cold to take its full effect. The end of the Little Ice Age is normally given as about 1800. Putting that together with the graph in Figure 11, it suggests that the treeline in that region took about an entire century to decline.
snip –
The images in this article will not load for me. I’m using Chrome and I even cleared the cache. Can someone upload “Figure 1. Treeline as shown in Shiyatov 2003” and share the link to me please (as a reply). I would be forever grateful!
The tree line I find most interesting is the tree line during the Holocene Climate Optimum, which lasted for several millennia. Despite the fact that the tree line was much much further north during this period, the polar beers and the Greenland Ice Cap both survived these millennia – the latter apparently without causing any dramatic rise in sea level. If it weren’t for the possibility of a major lag in the response of the current tree line to 20th century warming, it would be logical to conclude that the location of the northern tree line during the HCO demonstrates that current Arctic temperatures are well below those experienced during this benign warm period.
SteveM and some others, who post here and understand the difference between in-sample and out-of-sample testing, I am sure understand the points I continue to make about an absolute requirement for reconstruction requiring an a prior selection process based on physical understanding of the proxy response and then using all the selected proxy data.
As a curious and former practicing scientist I have no problem with threads discussing and analyzing methodologies even when those methodologies are applied from principles that are basically flawed. I do think it is important to mention those basic flaws such that a reader will not judge that if a fix is presented from an analysis that shows problems with the details of those methodologies that the entire enterprise is fixed.
When I see papers discussing these methodology details, e.g. Briffa 2013 presenting a new and improved RCS, without mentioning the more basic flaws because these authors are evidently completely unaware of these flaws it drives me crazy. Well not really – maybe a little more crazy.
Steve: Kenneth, as a long time reader and contributor, I think that I understand what you’re saying and am not over-reacting since I know that you recognize the attention to detail here. Unfortunately, it’s hard to re-cap the manifold defects of Team methodology in every post. Posts are not standalone, but presume some familiarity with earlier posts.
SteveM, thanks for your reply as I think that it puts these topics in the right perspective. I do, however, think that some unknown portion of readers and posters here might not understand why a better selection process of temperature proxies is required. I get that idea from noting what is said and not said in these posts – kind of like reading between the lines.
I am still looking for a detailed answer about why the MWP became so important in the first place, considering that anybody can look at the geologic record and see that there are multiple periods where co2 was falling while temperature was rising. Additionally, periods where co2 concentrations were lower than the present atmospheric concentration can be identified, where the temperature is much higher than current values.
So the only thing I can think of, is that scientists who argue for a strong positive feedback and lots of warming are banking on the fact that most people either do not look at, or do not care about the geologic record.
Anybody have any thoughts?
Hahahaha – I just had the biggest laugh I’ve ever had on CA.
I went back to the earliest of Steve’s “Treeline” archives and this jumped out:
Medieaval Finns planting trees – sounds like selling coal to Sheffield to me.
But on a serious note, 150km north is a LOT. Once again comparing to Vikings in Greenland, it makes sense, and fodder for us who think our current temps are a far cry (no pun intended) from the MWP.
Having read the various points on moisture,temp and elevation and the confounding factors (lag, etc.) raised, I still can’t see why the tree-line level is not a good proxy for temperature. Re moisture, it isn’t going to be a drought for 150 years in a place like Siberia over the past 1000yrs. We do know the age of the trees don’t we (?) and can count how old they are. Sure some areas may be altered by the geology but a large area sampled should take care of this problem. I think if ring width and density factors have any value and since absolute ages are the most discernible of data, we could do a study that would identify identically aged rings at various elevations and could then refine the science considerably. Also, for variability, can’t we look at today’s elevations, moisture, etc and determine variability. Am I wrong in thinking these factors are worth detailed study that would pay off in more accurate and reproducible temperature and moisture data. I come from an industry (mining exploration and development)where it’s taken for granted that its tough to tease out data, and surely it’s easier than soft landing at vehicle on Mars.
2 Trackbacks
[…] https://climateaudit.org/2013/07/07/treeline-changes-and-altitude-inhomogeneity/ […]
[…] full article can be read at https://climateaudit.org/2013/07/07/treeline-changes-and-altitude-inhomogeneity/ […]