In yesterday’s post, I observed that Nature’s recent news article on Met Office decadal forecasts failed to show the most recent Met Office decadal forecast and that its inclusion would not have permitted the Nature headline. I also showed the large change from the Met Office submission to IPCC AR5 and their current decadal forecast. Asked to comment by Anthony Watts, Richard Betts of the Met Office did not explain why the Met Office either signed off on or had not objected to the omission of their most recent forecast. Instead, Betts claimed that my plot was “wrong” because “HadGEM2 not an initialised forecast, so Steve is wrong to plot it from 2010 high point – exaggerates difference”… as though this were responsive:

However, I had directly plotted from data from the Met Office so there was no inaccuracy in my graphic despite Betts’ implication. Nor, needless to say, there is no scientific or statistical principle forbidding the illustration of initialized and uninitialized forecasts on the same graphic. Ironically, as shown below, the UK Met Office had themselves done so in the very article (Smith et al 2012 Clim Dyn) from which the Nature News article had been derived.
Here is the graphic that Betts criticized. The CMIP5 contribution,as Betts had observed, is “uninitialized”, while the two Met Office decadal forecasts (green and blue) are “initialized”. The Met Office IPCC contribution also included a hindcast, but I had shown the CMIP5 forecast from 2010 on to highlight the difference (taking care to note that I had shown only the forecast portion.) All data, as noted above, is Met Office data. I plotted the CMIP5 contribution from 2010 on, estimating , as stated in the post, that 2010 was the approximate start of the “forecast” given the timing of the CMIP5 contribution. In response to Betts’ objection, I added the hindcast portion into a revised graphic, observing that this was irrelevant to the conclusions of the post.

Figure 1. See yesterday’s post for explanation.
Now here’s something interesting.
Smith et al 2012, the academic article from which the Nature News article was primarily drawn, the lead author of which is a Met Office employee, also included a graphic contrasting the forecast portions of initialized and uninitialized runs, both from approximately 2012 on, as shown below. (No hindcast for the uninitialized run was shown.) Like my graphic, they showed forecasts in red, blue and green to the leeward of observations. However, they showed the “uninitialized” forecast in blue, while I had shown the uninitialized forecast in red. And while they had shown the initialized forecast in red, I had colored the two initialized runs as green and blue. (The green and lightblue lines in Smith et al 2012 are not relevant to the present discussion.) They showed a smoothed version of HadCRUT3, while I showed an unsmoothed version of HadCRUT4. I find it very hard to understand Betts’ precise objection to my graphic.
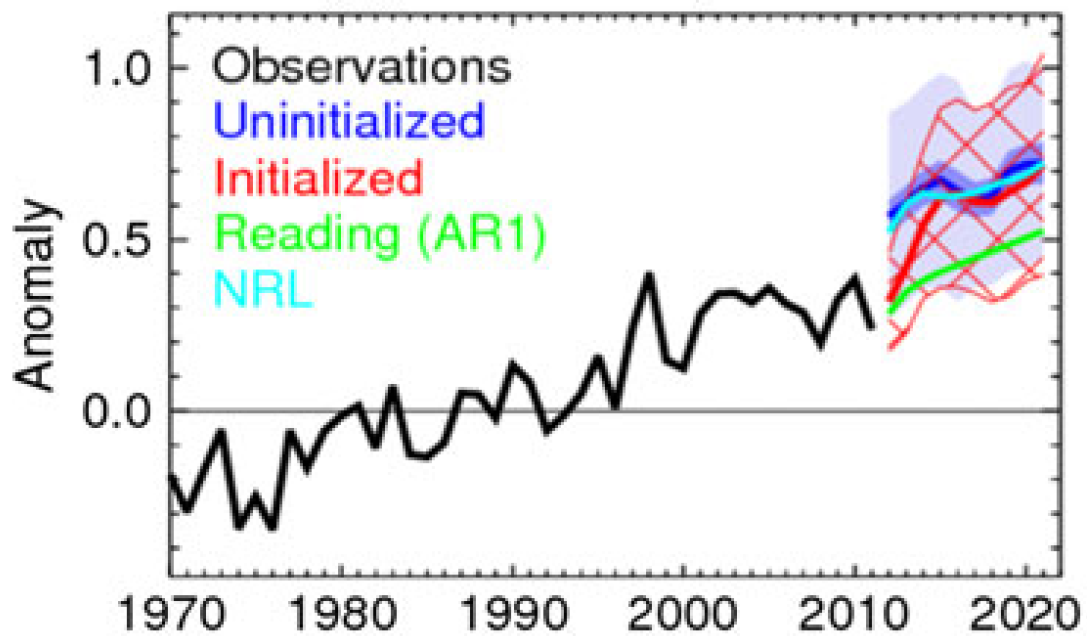
Figure 2. Smith et al 2012 (CLim Dyn) Figure 8a, showing Uninitialized (blue) and Initialized (red).
For comparison with my original graphic, here are the Met Office CMIP5 submission (magenta) and most recent decadal forecast (dodgerblue) plotted onto the Smith et al 2012, with irrelevant portions of the Smith 2012 graphic whited out. Betts had criticized my graphic which showed the uninitialized forecast (HadGEM2) from 2010, but the diagram in Smith et al 2012 shows the uninitialized forecast starting from a very similar point. Observations are slightly displaced downwards in this diagram, because Smith et al used HadCRUT3, while I used HadCRUT4, which has been amended and runs a bit warmer over the past 15 years.
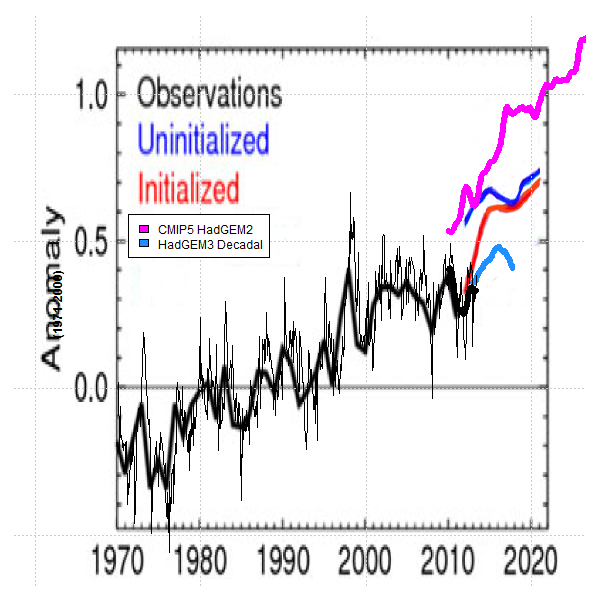
Figure 3. Annotated and cleaned version of Smith et al 2012 Figure 8a. CMIP5 HadGEM2 (magenta). 2012 HadGEM3 decadal forecast (dodgerblue). Observations, following Smith et al 2012, are HadCRUT3, extended to current values.
Betts claimed that my graphic was “wrong”, but did not object to a similar graphic technique in the underlying academic article by Met Office scientist Smith. Not that there was anything “wrong” in either graphic. Betts’ claim was both ad hoc and unfounded, as too many claims arising from the climate science community.
Betts’ claimed that my graphic “exaggerated” the difference between the Met Office submission to IPCC and the most recent Met Office decadal forecast. Untrue. I plotted Met Office data. In my opinion, the exact contrary is the case: the Nature News graphic downplayed the differences between Met Office versions by not showing the most recent decadal forecast and by not showing the Met Office IPCC submission. If anything was “wrong” in this incident, it was that the Met Office either signed off on the Nature News’ omission of their most recent decadal forecast (if given a chance to comment) and that they failed to write in their own objection to the omission once the article was published. And that instead of conceding the point, Betts made untrue and unwarranted allegations that I had committed errors in my post reporting the problem.


53 Comments
Many many years ago in the uk, there was a phrase which always appeared at the bottom of every written quotation.
“Errors and ommisions included” or as Steve might have put it.
“Errors and elisions included”
Actually it was “errors and omissions excepted”, usually rendered as E&OE.
I, too, have been publicly and falsely accused of being wrong by Richard Betts. That was in late 2011, but evidently some lessons are not easily learned.
When the IPCC makes an error, is it the journalist’s fault?
In that case, I believe Bett’s eventually brought the error to the attention of the IPCC, and the record was quietly corrected. Because the IPCC gives no indication that the page in question contained an error for four long years, ironically it now appears that I was hallucinating and that Betts was correct 🙂
Steve, an error?
“[s]Nor,[/s] Needless to say, there is no scientific or statistical principle forbidding the illustration of initialized and uninitialized forecasts on the same graphic”
Sorry to be so stupid, but what exactlyis the difference between an
uninitialized forecast and an initialized one? And why is it so important?
I have tried Googling but did find an explanation.
Inquiring minds want to know. I’m inferring that it affects the y-axis offset, as opposed to the slope.
From Smith 2012: “However, uncertainties are large for individual years and initialization has little impact beyond the first 4 years in most regions.”
The initialized model mean temperature anomaly is .23C less than uninitialized in 2012, and 0.01C less in 2016. This makes sense to me. If a model yields a certain global temperature under forcings, initialization to a colder state with the same forcings probably looks the same as volcanic cooling, just without the aerosols. The models would then mostly “recover” to their warmer state.
In fact, Smith et al has their take on it. “The cooling impact of initialization is consistent with the recent hiatus in global warming (e.g. Easterling and Wehner 2009), since initialized forecasts start from anomalously cool conditions relative to the expected warming from greenhouse gases. Indeed, initialized forecasts of globally averaged temperature are significantly cooler than uninitialized ones until 2015. However, in the absence of significant volcanic eruptions, global mean temperature is predicted to continue to rise.”
Richard Betts explained initialized:
I think it would be helpful if Richard Betts would engage directly, instead of occasional snipes via Twitter.
I agree that a more fullsome response than can be fit into a tweet is warranted. But to be fair, I believe Betts was replying to a twitter enquiry from Anthony making the twitter reply not unreasonable.
Apart from the fact that I don’t know what an “initialized” vs “non-initialized” forecast might be (although I gather it is a rather obscure way of pretending that a “hindcast” which approximates observations adds validity to a “forecast”), I’m not entirely sure how one could justify describing 2010 as a “high point” when (at least to my unscientific eyes) the Red HADGEM2 (submitted to the IPCC) goes uphill all the way.
But my experience has been that, on the non-responsive front, few can surpass this authoritative voice from http://hro001.wordpress.com/2013/04/23/questions-for-a-jewel-in-the-crown-of-u-k-and-global-science/ in the Crown of, British science and global science”
He hasn’t done too badly in the ‘mountain out of invisible molehill’ department, either.
Furthermore, it does seem somewhat odd that Betts should have chosen to make his pronouncement via twitter (a platform on which Steve has not been known to participate) thereby spreading the word to his 2,600+ followers – rather than engage directly via comment on the post in question. Just as he claimed to have encouraged his colleagues to do (although to the best of my knowledge they chose not to) wrt Steve’s PAGES2K observations (following Betts’ very own mountain out of invisible molehill launch via twitter).
Correction:
[…] on the non-responsive front, few can surpass this authoritative voice from “a jewel in the Crown of, British science and global science”
Over-generalisation aplenty there, both about Richard Betts and ‘BH folks’, topped off with an equivalence with Michael Mann that takes overstatement into overdrive. Good effort in one paragraph.
I also consider Hilary’s point about the form of Richard’s communication a minor one at best. It’s the content that matters.
Steve as usual sticks with the knitting, with the content of the tweet, and has left Betts and Smith some pointed questions to answer. I await the next stage with interest.
Mark T. I am not one of the BH readers who think that Dr. Betts is one of the “good guys”. I’ve regularly stated and received criticism for, that Dr. Betts is a “false flag”.
This latest saga has only serves to reinforce my view of him.
But then the only actual ‘insult’ mrsean2k is the one you’ve posted yourself.
Steve’s comment that “Betts made untrue and unwarranted allegations that I had committed errors in my post reporting the problem” was simply a statement of fact.
@marion
Not true.
I don’t classify Steve’s post as insulting although I questioned the tone in places. I do claim responses to Steve’s post are unambiguously insulting in a way that leaves plenty of room to ignore the substance of the post and the site altogether.
(apologies for out-of-sequence posts, usual floating reply button issues)
I’ve deleted some piling on comments by several commenters and could have deleted others.
Steve,
I wrote a similar comment to the following on
another site.
The equations of motion, be they hydrostatic
(as used in all climate models) or nonhydrostatic
are derived precluding the lower boundary layer
of the atmosphere. As you have seen in Sylvie Gravel’s manuscript, unless an artificial drag
or dissipation is added at the lower boundary of a
global numerical model, the wind speeds at the surface increase unrealistically and destroy the accuracy of the model in a few days. However, these same bogus terms that lead to O(1) errors are included in all climate models and hence these models are physically unrealistic in a few days.
Sylvie’s manuscript was not accepted for publication
because it pointed out this very damming flaw.
In addition, there is no mathematical or numerical theory for extending the accuracy of such a model
relative to the continuum equations beyond a few days, even if the above were not the case.
Jerry
Sorry, my comment went in the wrong place. Jerry, what was the other site where you commented? The boundary layer is simulated by adding eddy viscosity, which is ad hoc, and as you point out is usually too dissipative.
David,
It was on Judith Curry’s web site.
The problem is that the drag or dissipation term is not only too large, it is not physical and destroys
the accuracy of the numerical approximation of the
continuous equations derived for the troposphere in a few days.
Jerry
Understood.
Mark
I had a pleasant discussion with Richard Betts last year after my presentation. I have no issue with him personally. Nor do I regard his comments as BH as “false flag”. I view such exchanges as helpful rather than the opposite. Betts doesn’t pretend to agree with skeptics.
However, I do not think that it is helpful for him to casually make assertions that I’m “wrong” about a particular post (and this is not the first such incident this year, as Hilary observed) without taking care to verify that my post actually is “wrong”.
Also it’s hard for a graphic to be “wrong”. While I think that the Nature News graphic was misleading because it did not show the most recent Met Office, I didn’t use the word “wrong” to describe it – though it was much more worthy of the term “wrong” than my graphic.
Don,
Though my reply to Richard was snipped (ok, I was naughty), in no way was I implying that everyone at BH is apologetic to Betts. I was simply noting a general “trend” of sorts that was highlighted by recent protests that any comment critical of Betts should be censored. IMHO, such a concept is the antithesis of skepticism. Steve openly referred to Betts comments as hypocritical, a point I wholeheartedly agree with, but not limited to this instance, in spite of Drake’s protests to the contrary. Also IMHO, Montford himself has become increasingly critical, though again, much more subtly than I. Sorry if you disagree Richard, but my observation, and like comments around the various blogs, are pretty obvious upon inspection.
Mark
Unfortunately “untrue and unwarranted allegations” seems to be the MO of Climate ‘scientists’.
Just look at the hype the Met Office pushed out in the run up to the Copenhagen negotiations back in 2009 in their brochure “Warming, Climate Change the Facts” (no longer available on the Met Office web site as Betts had it quietly removed).
Click to access UK.Met.quick_guide.pdf
Page O4 of the brochure has the most exaggerated hockey stick I’ve ever seen and comments such as those below are strewn throughout –
“It’s now clear that man-made greenhouse gases are causing climate change. The rate of change began as significant, has become alarming and is simply unsustainable in the long-term.”
“It’s a problem we all share, because every single country will be affected. Together, today, we must take action to adapt to it and stop it — or, at least, slow it down.”
“What will happen if we don’t reduce emissions?
If emissions continue to grow at present rates, CO2 concentration in the atmosphere is likely to reach twice pre-industrial levels by around 2050. Unless we limit emissions, global temperature could rise as much as 7 °C above pre-industrial temperature by the end of the century and push many of the world’s great ecosystems (such as coral reefs and rainforests) to irreversible decline.
Even if global temperatures rise by only2 °C it would mean that 20–30% of species could face extinction. We can expect to see serious effects on our environment, food and water supplies, and health.”
“Are computer models reliable?
Yes. Computer models are an essential tool in understanding how the climate will respond to changes in greenhouse gas concentrations, and other external effects, such as solar output and volcanoes.
Computer models are the only reliable way to predict changes in climate. Their reliability is tested by seeing if they are able to reproduce the past climate, which gives scientists confidence that they can also predict the future.”
And bearing in mind that in 2009 the Met Office would have been well aware of the comparitive flatlining of temperatures for over a decade, that hockey stick image was grossly dishonest. Interesting to compare it to the ‘decadal’ forecast they quietly slipped out on Christmas Eve 2012.
Hilary Rostov & Chris Leamy:
You aren’t the only ones who don’t know what “initialized” is supposed to mean. While I have a high regard for Mr. McIntyre’s work, he needs an interpreter. If there is someone who professes to understand all of his posts and the points he is trying to make, that person would be doing a public service to provide an “interlinear McIntyre” similar to those sites that show the Koine and English New Testaments side by side. I only occasionally have the time to tease meaning out of his posts.
Joe, I respectfully disagree with your criticism (and/or expectation).
If I don’t understand something in one of Steve’s posts, I consider it my responsibility to educate myself – or to determine that a post is way beyond my pay-grade (and/or specific interests) and wait for Steve’s next post.
In this instance, I drew an inference (which may or may not be correct) from Steve’s revised graph in his previous post – combined with a recollection of Betts’ intermittent and, IMHO, very selective responses to questions posed at Bishop Hill.
Particularly informative, IMHO, were those questions politely and respectfully asked to which Betts did not respond). For an example of Betts in action, so to speak, you might want to take a look at the rather long thread of comments pursuant to Andrew Montford’s post, in January of this year, Spot the difference.
And speaking of Andrew Montford … apart from his The Hockey Stick Illusion and its sequel, Hiding the Decline, in which he succeeds in conveying the “translations” you seek, there are many of Steve’s key posts (of which this is probably not one), in which Montford can be counted on to provide such a “translation”.
Not to mention that one of the hallmarks of climate science is a rather unique Dynamic Language Library – which is so flexible that it seems to permit redefinition on the fly.
IMHO, it is also worth noting that “initialized” (or “not initialized”) was introduced by Betts – not Steve. This being the case, surely the onus of explanation lies with Betts, who (conveniently?!) chose not to post his “objection” in a comment on the post, but to broadcast it to his followers via twitter.
YMMV, but, well, that’s the view from here 🙂
Joe, you appear to want to “understand” the maths, without having to understand the maths. The world doesn’t work like that — to understand maths, you have to learn the language of maths and take time to learn the concepts.
I think one of the great benefits of this blog is that it does dwell on the details, and doesn’t try to avoid the unavoidable statistical intricacies.
Like Hilary I feel it my duty to catch up when it is heavy going. A side-effect is that I have learnt a lot of statistics on the way.
Joe,
“Initializing” is mostly a modeling terminology for where you set your model “spin-up” to take in a variety of “initial conditions” / “parameters”. Think of it as you came up with a process to throw a ball through a tire on a windless day. Two week from then, on a windy day, you still want to throw the ball through the tire. You would have to “re-initialize” you throwing “parameters” from two weeks ago to compensate for the the current wind with the angle of your throw, or maybe the force. For those with programming/micro-controller experience, it is the “setup” potion of the program/macro.
What “initialise” could possible mean to data that is already out of the modeling machine, Richard’s MetO Bizzaro World can only know. Data can only be “initialised” *before* it produces a product. Nature produces mostly three leaf clovers, but Richard may insist (with his argument) that is has not been properly “initialised”, after it has been created as a three leaf, and it should be a four leaf clover.
Steve M. indulges the very poor use of terminology and finds one of Betts co-workers using the *post-data* in a similar fashion as Steve’s, un-initialized.
So, tomorrow, Richard will need to a) Talk to Smith about his un-initialized data. b) Talk to Steve about Smith’s three leaf clover is unrelated to Steve’s three leaf colver. c) Ignore the entire mis-speak and comment of Steve’s three leaf and hope people will forget by Tuesday, next week.
‘What “initialise” could possible mean to data that is already out of the modeling machine, Richard’s MetO Bizzaro World can only know. Data can only be “initialised” *before* it produces a product. ”
Lets see if I can give you a reasonable description. In an “uninitilized run” you spin the model up from a zero state to an equilibrium state. What’s that mean? At the start of the simulation lets say the velocity state of a ocean grid is zero. Its not moving.
There is no wind. The spin up proceeds and forcings are applied. Say a TSI of 1360 watts. The oceans start to move, the winds start to blow. The spin up takes 100s of years even more. At some point the temperature stops fluctuating. You achieve balance at the TOA. You are at equillibrium. One thing you check for is “drift” in key variables, like global temps. Your simulation is now ready to run. It is year ZERO. you now apply forcings for 1850 to the present. Year zero now becomes year 1850.
This means that even if your simulation produces emergent phenomena like El Nino, the timing of these events will differ from reality.
Lets imagine that in 1851 there was a La Nina starting. Your sim wont be able to match that, why? because your simulation 1850 was in equillibium and the actual 1850 was not. The hope is that if you run a bunch of realizations that these natural cycles will integrate to zero and the average of all your realizations will show the effect of changes in forcings.
This also means that at the any point in your collection of simulations you will “miss” when you compare it to the real observations if the period of comparison is dominated by a emergent phenomena
To address this problem and the problem of shorter term projections you can try to initialize the simulation to the historical observations. take 1960. take observations from that time period and initialize the model using those.
“DodgerBlue” – hilarious 🙂
Perhaps “Artful Dodger Blue” might be more appropriate?
Scuse my ignorance, but what is “an initialised forecast”?
Steve’s “untrue and unwarranted” raises the temperature in a way that’s not helpful in eliciting a more nuanced explanation from RB IMO.
As are references to “occasional snipes”. RB was asked to respond to the previous article by means of a question on Twitter from Anthony Watts, and he replied on the same forum within it’s confines. He didn’t take any kind of position until prodded by AW.
And It is misleading to claim, as AW does, that pointing someone at an article – researched by Steve in his usual meticulous way – amounts to a “simple question”. Just because it took him a second or so to ask it doesn’t make it simple.
I suffer at the hands of this sort of question regularly. An email request beginning “Quick question” invariably means that the person asking just wants a quick answer (and will generally offer no thanks or acknowledgment when I take time to explain why no quick, simple answer exists).
Framing someone’s disagreement with your conclusions as an “attack” or “accusation” is a tactic that’s not warranted by either side.
The last time I talked like this on a Climate Science website, I was accused of being a Concern Troll.
Oh well. Hyperbole aside, Does it not look like Steve has a point (there is a [significant] difference between the IPCC submitted numbers and ‘the latest’)?
intrepid_wanders:
Thanks for the input. Actually, I think I understand what initialization is in general; it’s just that the use here specifically was obscure.
If you’re modeling a physical system, you must assume some initial state, yet reference in the post is made to an “uninitialized” model, so perhaps I can be forgiven for wondering whether “initialize” means something different here. My guess is that “uninitialized” doesn’t mean that the simulations had no initialization but rather that the initial conditions were applied to a time decades in the past, and/or that different contributions to the “uninitialized” mean curve came from multiple simulations, which were initialized at a variety of times with various initial conditions. But since Mr. McIntyre was confident enough in the meaning to say, as he did, “needless to say, there is no scientific or statistical principle forbidding the illustration of initialized and uninitialized forecasts on the same graphic,” it would have been helpful to at least three of his readers if he had set forth his understanding explicitly.
Hilary Rostov and Mooloo: “If I don’t understand something in one of Steve’s posts, I consider it my responsibility to educate myself.” You are no doubt to be commended for that attitude, but the purpose of a blog is to communicate, and the more effort a post requires of the reader, the fewer readers there will be who get communicated to effectively.
Mooloo: “Joe, you appear to want to “understand” the maths, without having to understand the maths. The world doesn’t work like that — to understand maths, you have to learn the language of maths and take time to learn the concepts.”
Believe me, I am painfully aware of my mathematical shortcomings, but the problem with Mr. McIntyre’s posts is not mathematics but English exposition. His previous post, for example, set forth several interesting facts, but one might infer from its title, “Nature-mag Hides the Decline,” that Mr. McIntyre considered those facts to evidence something nefarious. At least to me, though, it’s far from clear what he thought it was.
The Jeff Tollefson article to which Mr. McIntyre’s previous post drew attention dealt with applying the climate models to decade-scale forecasts. In contrast to those models’ “regular” simulations, which Mr. Tollefson characterized as starting as far back as before the industrial era, these efforts initialize the models to conditions actually measured at the beginning of the decade being forecast. Graphs showing comparisons of the thus-predicted temperatures with actual temperatures and with the outputs of “regular” simulations indicated that the resultant temperature forecasts for recent periods tended to be lower than “regular” simulations’ but significantly higher than those that actually eventuated, and this was in tune with article’s verbal content: the Smith et al. study given as the lead example gave reasonable results for about a year out but then predicted “dramatic” warming that didn’t happen.
Read in light of the article as a whole, its title, “Climate Change: Forecast for 2018 Is Cloudy with Record Heat,” could have been taken merely as a “cute” way of saying, “Now they’re trying to make weather forecasts decades in advance,” particularly in view of the “cloudy” part. True, that title was a poor hint at the above-described content—as is often the way of headlines—and it can justifiably criticized on that basis. But Mr. McIntyre instead refers to it in connection with the fact that the Met Office decadal forecast represented by the graphs’ rightmost blue trace is not that organization’s most recent, which does not exhibit that trace’s pronounced increase.
Is Mr. McIntyre saying the author made that forecast choice in order to justify the headline? Or that the headline was based on that trace? What is his point? And, if we don’t know for sure his point is, how are we to judge whether the facts he marshals support it?
I appreciate that many technical topics are just inherently hard to understand, and the reader needs to pore over them no matter how good the writer is. But most of the subjects of Mr. McIntyre’s post are not inherently as hard as he makes them; those Mr. Montford or Prof. McKitrick explained turned out to be quite easy to grasp.
So, if there’s someone who can translate, that would be a great public service.
In the Figure 2 graphic from Smith et al 2012, the blue line is obviously uninitialized as it starts from a point above the observed data, while the red initialized curve points back to the observed data. When I first looked at Steve’s plot in the last post, all three curves appeared to originate from the observed data, making it look like all three were initialized. Now I see the little red spur to the left of 2010 on the hadGEM2 curve, so I am guessing that it was just a coincidence that it touched the hadCRU4 data in 2010?
Steve: yes and no. while it wasn’t overtly “initialized” on 2010, the IPCC submissions were done at that time.
HaroldW
Posted Jul 17, 2013 at 10:56 PM | Permalink | Reply
“Richard Betts explained initialized:
… This is still early days of course, there is still a lot more work to do, but you can see from the 2012 figure that the hindcasts show the model agreeing with the observations reasonably well (and better than the HadCM3 hindcasts as shown in the 2011 figure).”
The statement Betts makes here is one that is frequently heard and one that under more detailed examination does not appear to hold very well. I would encourage those who have the capability to look at the 43 plus year trend from 1970 to May of 2013 of the Observed global mean temperature anomaly series and the comparable CMIP5 modeled series (any or all of the 4 scenarios). Also look at the Observed to model comparison with 12 to 14 year trends over the historical period.
I am in the process of looking at difference series between models and the Observed series over the historical period of time. I would recommend that exercise for interested parties here. Much more interesting and exciting than he said he said exchanges.
On the plus side, at last I think I see where the “initialised” vs. “uninitialised” discussion makes sense.
RB claims the uninitialised version of CMIP5 et al is wrong because it’s baseline is shifted up WRT the HADCM3 and HADGEM3, and this gives a false impression of the absolute differences between the two.
SM claims this is insignificant because the real rhetorical power of the comparison comes from:
1) The differing slopes of each up to the 2016 point
2) The *very* different slopes where they diverge at 2016 onwards
Stev: does betts SAY that there’s an issue in respect to baseline shift? I haven’t seen this. AFAIK he hasn’t said what exactly is “wrong”. The CMIP data is in absolute degrees. I converted it to 1971-2000 anomaly to match the decadal forecasts and to 1979-2001 anomaly to match the Nature graphic. Even if I had used 1961-90 anomaly, there is negligible difference to the graph. Baseline shift is a bogus complaint.
Just my reading based on what I believed would happen if the CMIP5 et al line *was* initialised, I haven’t seen any other responses anywhere.
“A fuller response with a bit more space to explain would be useful. Like to think that can happen, but maybe optimistic.”
For once I agree with you, mrsean2k, I somethimes think that this may well be the reason that Climate ‘scientists’ are so fond of twitter as a medium for communication.
I hope Betts has learned the same lesson as the cheats of the Hockey club. Ie Don’t challenge Steve Mc unless and until you have gone over your work at least 10 times. You will only end up looking stupid and stupid is as stupîd does.
This link http://www.met.reading.ac.uk/~sgs02rpa/research/DEEP-C.html tweeted by Doug McNeall today has some very interesting info regarding the DEEP-C project with lots of links to model discussions. This project http://www.met.reading.ac.uk/~sgs02rpa/research/DEEP-C_science_case_final2.pdf was, I believe, proposed in April 2012, and is a result of the ‘hiatus’ of surface temps and will run thru 2017… Got to give them props for being transparent about the search for the missing heat. I don’t understand how people can state that they *know* that it is going into the deep ocean, when a huge project like this is just beginning…
My question is where does Betts think the red line should go?
According to the underlying Nature article, the line has to reach .8 degrees C “higher than today” by 2018. So pin the HadGem2 graph line to an anomaly of around 1.1 degrees C in 2018 and run it backward to meet HadCRU4. Then compare to HadGem3. Would Betts like that picture better? Is it less “exaggerated” in that position?
Jerry, What was the other site? Yes, they have to add eddy viscosity in the boundary layer which is ad hoc and as you suggest usually too dissipative.
Initialized versus Initialization
Mathematically, time dependent equations, e.g. hyperbolic equations like the 1D wave equation or parabolic equations like the 3d heat equation,
need to have values of the dependent variables at all spatial points specified at some time t = t_0.
For the basic full dynamical equations for the atmosphere, i.e. no hydrostatic assumption, this means values at all space locations (x,y,z) for
the entropy, the 3d velocity, and the pressure
at a given time. These are called initial values
for the problem and are required to make the solution exist and be unique.
Initialization is a technical term for hyperbolic systems with multiple time scales (like the atmospheric equations that have advective, gravity and sound waves) where it is desired to choose the initial data in such a manner as to not excite the
high frequency waves. This requirement leads to
elliptic equations for all of the initial variables except for the slowly evolving one. In the atmospheric case the latter is the vertical component of the vorticity. (See Browning anfd Kreiss 2002)
Thus the terms that Betts is using is not standard mathematical theory and is nothing more than starting the model from different initial values –
either from a previously long run of the model or from values at a later point in real time.
I’m a bit surprised at the strong reactions here! (Although from Steve’s comment, it looks like many were removed before I saw them, which is probably a good thing!) As mrsean2k points out, I posted my comment on Twitter simply because that was where the question came to me, via Anthony Watts.
I’ve put a comment under Steve’s original post to explain why I believe it was a technically incorrect way to compare the HadGEM2 and HadGEM3 simulations. My use of “wrong” was not intended to be pejorative – as a scientist, I’ll tell colleagues that they are “wrong” and they’ll tell me I’m “wrong” when one of us believes the other is making a technical error. It’s all part and parcel of scientific debate.
Steve: I’ve responded to your comment in the other thread. My issue was that your comment was itself either unresponsive or “wrong”.
In a comment on the related thread, Richard Betts, in a distinction that seems to me to be Nick Stokesian, purported to justify his assertion that my graphical comparison of initialized HadGEM3 and uninitialized HadGEM2 was “wrong” while the apparently similar comparison of Smith et al 2012 shown in this post was not. HadGEM3 was produced for only five years – which is what I showed; while HadCM3 is produced for 10 years. According to Betts, it is only “wrong” when the length shown is too short and 5 yeas is apparently too short, while 10 years is not. Betts argued as follows:
Now here is the graphic shown in the above post:

One immediately sees that in the older decadal forecast, the “initialised forecast eventually catches up with the long-term trend of the uninitialised run” within 5 years and the distinction between 5 and 10 years is immaterial.
If 10 years is the relevant period for a “decadal” then I don’t understand why the Met Office only ran 5 years. If it is computation time, then why not do 5 runs for 10 years, rather than 10 years for 5 years. Frankly, I find it hard to believe that they hadn’t already done some HadGEM3 runs for 10 years. It doesn’t make much sense to run a “decadal” forecast for 5 years. In order to remove such suspicions, it would be helpful if they reported a log of HadGEM3 runs.
+100. And all generalisations thereof.
There certainly was questioning at the time, of why they shortened the forecast so.
It was assumed that the uncertainty monster was creeping into the MET.
creeping in at night and unsharpening their pencils, so to speak
The Met Office responded to an emailed question about why the recent decadal forecast was only for 5 years into the future – the reason, as Steve McI wrote, was the increased computational expense of running the HadGEM3 model. Apparently there are currently no plans to extend the forecast to 10 years.
4 Trackbacks
[…] More Met Office Hypocrisy […]
[…] do so in a fashion that is somewhat more transparent than that which Donna Laframboise had recently commented was her experience a few years […]
[…] https://climateaudit.org/2013/07/17/more-met-office-hypocrisy/#more-18197 […]
[…] Full disclosure. Betts and I have a bit of history. See here and here. […]