There is much in the news about how IPCC will handle the growing discrepancy between models and observations – long an issue at skeptic blogs. According to BBC News, a Dutch participant says that “governments are demanding a clear explanation” of the discrepancy. On the other hand, Der Spiegel reports:
German ministries insist that it is important not to detract from the effectiveness of climate change warnings by discussing the past 15 years’ lack of global warming. Doing so, they say, would result in a loss of the support necessary for pursuing rigorous climate policies.
According to Der Spiegal (h/t Judy Curry), Joachim Marotzke, has promised that the IPCC will “address this subject head-on”. Troublingly, Marotzke felt it necessary to add that “climate researchers have an obligation not to environmental policy but to the truth”.
Unfortunately, as Judy Curry recently observed, it is now two minutes to midnight in the IPCC timetable. It is now far too late to attempt to craft an assessment of a complicated issue.
Efforts to craft an assessment on the run are further complicated by past failures and neglect both by IPCC and the wider climate science community. In its two Draft Reports sent to external scientific review, while IPCC mostly evaded the problem, its perfunctory assessment of the developing discrepancy between models and observations, such as it was, included major errors and misrepresentations, all tending in the direction of minimizing the issue.
IPCC has a further dilemma in coopering up an assessment on the run. Although the topic is obviously an important one, it received negligible coverage in academic literature, especially prior to the IPCC publication cutoff date, and the few relevant peer-reviewed articles (e.g. Easterling and Wehner 2009; Knight et al 2009) are unconvincing.
The IPCC assessment has also been compromised by gatekeeping by fellow-traveler journal editors, who have routinely rejected skeptic articles on the discrepancy between models and observations or pointing out the weaknesses of articles now relied upon by IPCC. Despite exposure of these practices in Climategate, little has changed. Had the skeptic articles been published (as they ought to have been), the resulting debate would have been more robust and IPCC would have had more to draw on its present assessment dilemma. As it is, IPCC is surely in a well-earned quandary.
Interested readers should also consult Lucia’s recent post which also comments on leaked IPCC draft material. Lucia’s diagnosis of IPCC’s quandary is very similar to mine. She also uses boxplots.
IPCC Statements
First, I’ll briefly review how IPCC’s position on the discrepancy has developed.
The First Order Draft stated (chapter 1):
The [temperature] observations through 2010 fall within the upper range of the TAR projections (IPCC, 2001) and roughly in the middle of the AR4 model results.
This assertion was flat-out untrue. Their Figure 1.4 (see below), which purported to support this claim, was not derived from peer reviewed literature and was botched. They misplaced observations relative to AR4 model projections (presumably due to an error in transposing reference periods).
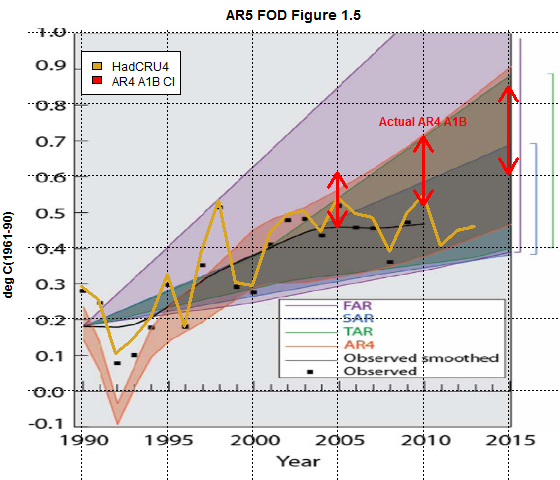
Figure 1. IPCC AR5 First Draft Figure 1.4. The brown wedge purports to show AR4 projections. HadCRUT4 values have been overplotted in yellow (and within amendment correspond to the black squares plotted by IPCC) and appear to support IPCC’s summary. However, IPCC mislocated the AR4 and other projections. The red arrows show the actual AR4 envelope for 2005, 2010 and 2015 (digitized from the original AR4 diagram). Observations are outside the properly plotted envelope.
While the First Draft was a “draft”, the error nonetheless passed IPCC’s own internal review process. The error also went in a “favorable” direction. In the Second Draft, IPCC (chapter 1) re-iterated the assertion that observations were “in the middle” of projections:
the globally-averaged surface temperatures are well within the uncertainty range of all previous IPCC projections, and generally are in the middle of the scenario ranges”.
However, their revised Figure 1.4 directly contradicted their claim. Observations since 2007, including the most recent ones, were now outside the AR4 envelope, as shown below.
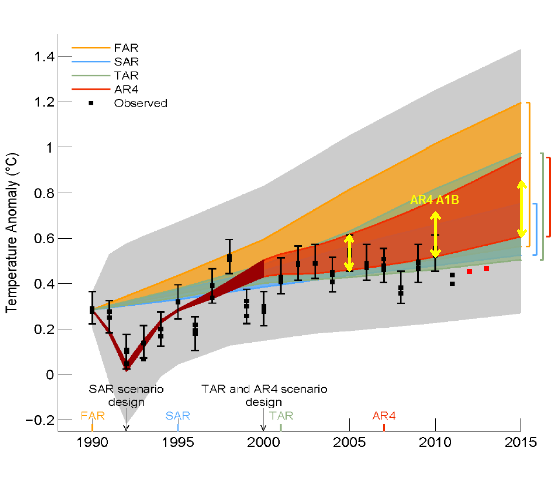
Figure 2. IPCC AR5 Second Draft Figure 1.4 with annotations: red squares are 2012 and 2013 (to date) HadCRUT4. The orange wedge illustrates combined AR4 A1B-A1T projections. The yellow arrows show verified confidence intervals in 2005, 2010 and 2015 digitized from the original AR4 diagram (Figure 10.26) for A1B. Observed values have been outside the AR4 envelope for all but one year since publication of AR4. IPCC authors added a grey envelope around the AR4 envelope, presumably to give rhetorical support for their false claim about models and observations; however, this envelope did not occur in AR4 or any peer reviewed literature.
In a recent article in National Post, Ross
McKitrick pointed out the inconsistency between IPCC’s language and its graphic, acidly observing:
The IPCC must take everybody for fools. Its own graph shows that observed temperatures are not within the uncertainty range of projections; they have fallen below the bottom of the entire span.
Reiner Grundmann at Klimazweibel also recently drew attention to the discrepancy in this graphic (citing McKitrick).
SPM Draft, June 2013
The Summary for Policy Makers attached to the Second Draft avoided any discussion of the discrepancy between models and observations.
Presumably responding to demands that the discrepancy be addressed, the Government Draft in June 2013 added a lengthy section (Box 9.2) purporting to address the discrepancy between models and observations and the Summary for Policy Makers included two somewhat inconsistent discussions of this issue in connection with both chapter 9 (Evaluation of Climate Models) and chapter 10 (Detection and Attribution).
The chapter 10 summary attributed the discrepancy in “roughly equal measure” to internal variability and a reduced trend in radiative forcing due to recent volcanic activity and downward solar phase:
The observed reduction in warming trend over the period 1998-2012 as compared to the period 1951- 2 2012, is due in roughly equal measure to a cooling contribution from internal variability and a reduced trend in radiative forcing (medium confidence). The reduced trend in radiative forcing is primarily due to volcanic eruptions and the downward phase of the current solar cycle. However, there is low confidence in quantifying the role of changes in radiative forcing in causing this reduced warming trend. {Box 9.2; 10.3.1; Box 10.2}
The chapter 9 summary also conceded the discrepancy, but attributed it “to a substantial degree” to natural variability, with “possible” contributions from forcing – mentioning aerosols as well as solar and volcanics – and, “in some models”, to too strong a response to greenhouse forcing:
Models do not generally reproduce the observed reduction in surface warming trend over the last 10-15 years. There is medium confidence that this difference between models and observations is to a substantial degree caused by unpredictable climate variability, with possible contributions from inadequacies in the solar, volcanic, and aerosol forcings used by the models and, in some models, from too strong a response to increasing greenhouse-gas forcing. {9.4.1, 10.3.1, 11.3.2; Box 9.2} [SPM – evaluation]
The IPCC Second Draft had cited four articles supposedly supporting the consistency of models and observations, three of which were also cited in the Government Draft (Mitchell et al 2012b GRL does not exist at GRL nor can an article by its title be located):
it is found that global temperature trends since 1998 are consistent with internal variability overlying the forced trends seen in climate model projections (Easterling and Wehner, 2009; Mitchell et al., 2012b); see also Figure 1.1, where differences between the observed and multimodel response of comparable duration occurred earlier. Liebmann et al. (2010) conclude that observed HadCRUT3 global mean temperature trends of 2-10 years ending in 2009 are not unusual in the context of the record since 1850. After removal of ENSO influence, Knight et al. (2009) concluded that observed global mean temperature changes over a range of periods to 2008 are within the 90% range of simulated temperature changes in HadCM3.
Both Easterling and Wehner 2009 and Knight et al 2009 had been severely criticized by Lucia in blog posts ( see here here here here here.) Lucia was sufficiently annoyed by the defects in Easterling and Wehner 2009 that she submitted a comment to GRL. Though her comment was accurate on all points, it was bench rejected by GRL. (see retrospective here). Subsequently, Lucia was co-author of another submission on the discrepancy between models and observations (a group that ecumenically included both Pat Michaels and James Annan), but this too was rejected (see discussion at Judy Curry’s here).
The criticisms in both the Liljegren comment and the Michaels et al submission were valid at the time and remain valid today. Many of their criticisms surfaced recently in Fyfe et al 2013, though this did not rebut Easterling and Wehner 2009 or Knight et al 2009 as directly. Fyfe et al 2013 was not published until after the IPCC deadline and, thus, Easterling and Wehner 2009 and Knight et al 2009 remained unrebutted in academic journals and were essentially all that was in the cupboard for the IPCC assessment.
Ross and I had experienced something similar in our comment on Santer et al 2008, which was likewise rejected by the original journal (International Journal of Climatology.) A couple of years later, Ross managed to get much of this material into print as McKitrick et al 2010. However, in the meantime, Santer et al 2008 continued to be cited in assessment reports. As an ironic footnote to our earlier controversy, AR5 now cites McKitrick et al 2010 and concedes that the discrepancy between models and observations in the tropical troposphere is unresolved.
The Problem Re-stated
IPCC’s Government Draft attempt to frame the discrepancy between models and observations as due to “natural variability” is ultimately a statistical problem – never a strong point of IPCC authors. Further, as noted above, the statistical analysis in the Government Draft purporting to support “natural variability” is not drawn from previously published literature, but was developed within the chapter (despite frequent protestations that IPCC does not itself do research.)
IPCC conceded in the Government Draft that there has been a 15-year “hiatus” (their term) in temperature increase, but assert that “individual decades” of hiatus are also “exhibited” in climate models, during which time the “energy budget is balanced” by energy uptake in the deep ocean:
However, climate models exhibit individual decades of GMST trend hiatus even during a prolonged phase of energy uptake of the climate system (e. g., Figure 9.8, (Easterling and Wehner, 2009; Knight et al., 2009)), in which case the energy budget would be balanced by increasing subsurface-ocean heat uptake (Meehl et al., 2011; Guemas et al., 2013; Meehl et al., 2013a).
However, pointing to the deep ocean doesn’t actually resolve the discrepancy between models and observations, since, as Hans von Storch recently observed, climate models did not include this effect.
Among other things, there is evidence that the oceans have absorbed more heat than we initially calculated. Temperatures at depths greater than 700 meters (2,300 feet) appear to have increased more than ever before. The only unfortunate thing is that our simulations failed to predict this effect.
IPCC also asserted that similar hiatuses are “common” in the instrumental record:
15-year-long hiatus periods are common in both the observed and CMIP5 historical GMST time series (see [Figure 9.8] and also Section 2.4.3, Figure 2.20; Easterling and Wehner, 2009, Liebmann et al., 2010).
As shown below, there is indeed a lengthy “hiatus” in the 20th century record, stretching almost 40 years from the 1940s until 1980. However, IPCC is surely being a bit sly in saying that 15-year-long hiatus periods were “common” in the 20th century. It is far more reasonable to say that there was a steady temperature increase from the 19th century to the 1940s, followed by a 30-40 year hiatus, then a 30-year period of increase to the end of the century.

Figure 3. HadCRUT4 GLB (black) versus CMIP5 ensemble average (red). Note the lengthy hiatus from the 1940s to 1980. Also note the divergence between models and observations in the 21st century.
The simplest inspection of the above graphic also shows important differences between the present hiatus and the long hiatus between the 1940s and 1980. In the long earlier hiatus, the models ran cooler than observations, whereas the opposite is the case right now. The model ensemble has been running hot for about 14 years and counting. Despite assertions by climate scientists of the supposed statistical insignificance of the divergence, in fact, it is, so to speak, unprecedented: there is no corresponding period in which models ran hot for such an extended period. In most statistical circumstances, residuals that consistently run in one direction at the end of a sample give grounds for statistical concern and not reassurance.
The suddenly-fashionable attribution of the present hiatus to unmodeled energy accumulation in the deep ocean also invites questions about the earlier hiatus, which the climate “community” conventionally attributes to aerosols. There is no independent record of historical aerosol levels, which (e.g. the prominent GISS series by Hansen’s group) have primarily been developed by climate modelers seeking to explain the long hiatus. Skeptics have long argued that aerosol histories have been used as a sort of deus ex machina to paper over excessively sensitive climate models.
Once again, IPCC invoked both “volcanic” and “aerosol” forcing as possible contributors for the present hiatus, but one feels that these efforts were somewhat half-hearted, though they did make their way to the SPM. The failure of IPCC scientists to draw attention in real time to the supposedly responsible volcanic events inevitably compromises any attempts to do so after the fact.
Thus, the sudden interest in positing energy accumulation in the deep ocean.
However, if the present hiatus is attributed to an unmodeled accumulation of energy in the deep ocean, how do we know that something similar didn’t happen during the long earlier hiatus? Could some portion of the earlier hiatus be due to deep ocean accumulation as opposed to aerosols? It’s a big door that’s being opened.
Opening the door also opens up questions about the potential length of the present hiatus. If unmodeled deep ocean processes are involved, how can we say with any certainty that the present hiatus won’t extend for 30-40 years?
Boxplots
In the (new) Box 9.2 of the Government Draft, IPCC conceded that recent 15-year observations run below models, but argue that 15-year trends ending with the big 1998 El Nino undershoot models.
an analysis of the full suite of CMIP5 historical simulations (augmented for the period 2006-2012 by RCP4.5 simulations, Section 9.3.2) reveals that 111 out of 114 realisations show a GMST trend over 1998-2012 that is higher than the entire HadCRUT4 trend ensemble …
During the 15-year period beginning in 1998, the ensemble of HadCRUT4 GMST trends lies below almost all model-simulated trends whereas during the 15-year period ending in 1998, it lies above 93 out of 114 modelled trends.
They then assert that models and observations cohere over the 62-year period from 1951-2012, concluding that there is therefore “very high confidence” in the models and that the 15-year discrepancies are mere fluctuations with the 1998 El Nino skewing recent comparisons:
Over the 62-year period 1951- 2012, observed and CMIP5 ensemble-mean trend agree to within 0.02 ºC per decade (Box 9.2 Figure 1c; CMIP5 ensemble-mean trend 0.13°C per decade). There is hence very high confidence that the CMIP5 models show long-term GMST trends consistent with observations, despite the disagreement over the most recent 15-year period. Due to internal climate variability, in any given 15-year period the observed GMST trend sometimes lies near one end of a model ensemble an effect that is pronounced in Box 9.2, Figure 1a,b since GMST was influenced by a very strong El Niño event in 1998
None of the above analysis by IPCC appears in peer reviewed literature. It is ad hoc analysis that can and should be parsed. Demonstrating that 15-year trend comparisons can yield inconsistent results does not remotely settle the statistical question of models running too hot that is evident in the opening graph. Indeed, it is little more than a debating trick.
The following graph compares models to observations over the period 1979-2013, long enough to place the 1998 El Nino in the middle, but excluding the earlier hiatus of the 1950s and 1960s. 1979 is also when the satellite record commences. The figure is a standard box-and-whiskers diagram of a type routinely used in statistics (rather than some ad hoc method). I’ve shown models with multiple runs as separate boxes and grouped models with singleton runs together. On the right in orange, I’ve done a separate box-and-whisker plot for all models. (Lucia has recently done plots in a similar style: her results look similar, but I haven’t parsed them yet as I’ve been working on this post.)
The figure shows that nearly every run of every model ran too hot over the 1979-2013 period, with many models running substantially too hot. The discrepancy can be seen with box-and-whiskers of the ensemble, but it pervades all models.
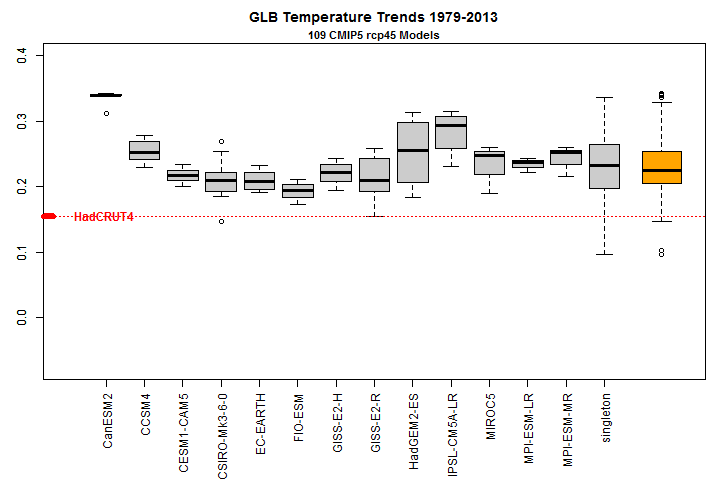
Figure 4. Boxplot of GLB temperature (tas) trends (1979-2013) from 109 CMIP5 RCP4.5 model runs versus HadCRUt4.
The boxplot shows fundamental discrepancies that pervade all models. Nor do these inconsistencies have anything to do with 15-year trends or the 1998 El Nino. IPCC’s entire discussion of 15-year trends is completely worthless.
Hiatuses in a Warming World
One final figure demonstrating the problem.
As noted above, IPCC (and others) have observed that hiatuses occur from time to time in climate models but didn’t disclose the scarcity of hiatuses of the length of the present negative trend (13 years from 2001 to 2013, a period that does not include the 1998 El Nino).
To assess this (varying a form of analysis that Lucia has used), I calculated all 13-year trends for all 109 CMIP5 RCP4.5 models presently at KNMI for the warming period 2005-2050, yielding a population of 3379 trends (109 models * 31 starting years). Only 0.5% of the population were negative (19 of 3379) and only 0.3% (10 of 3379) were lower than the slightly negative observed trend.

So while it is true that 13-year hiatuses occur from time to time in CMIP5 models of a future warming world, they are statistically rather scarce. Given this scarceness, no one can “with medium confidence” attribute the present hiatus to “natural variability” and, whatever the ultimate explanation of the hiatus, IPCC’s attribution “with medium confidence” to “natural variability” is merely wishful thinking.
Tropical Troposphere
While recent discussion of the discrepancy between models and observations has focused on global surface temperature, the discrepancy between models and observations was first raised in connection with the tropical troposphere, where the discrepancy is even stronger.
In this earlier controversy as well, IPCC and other assessments (e.g. the US CCSP) placed far too much credence in pettifogging arguments by Santer and coauthors that the discrepancy was not “statistically significant”, arguments that were untrue at the time, but which have gone even further offside with the passage of time.
The IPCC has now unequivocally conceded the discrepancy, even citing McKitrick et al 2010 (though not without taking an unwarranted sideswipe at us). In the Second Draft, the IPCC said that explanation of the discrepancy was “elusive”. The new draft refrains from the word “elusive”, but concedes the over-estimate, noting that much of the over-estimate arises from an over-estimate of tropical ocean SST propagated upwards.
In summary, most, though not all, CMIP3 and CMIP5 models overestimate the observed warming trend in
the tropical troposphere during the satellite period 1979–2012. Roughly one-half to two-thirds of this difference from the observed trend is due to an overestimate of the SST trend, which is propagated upward because models attempt to maintain static stability.
The inconsistency between models and observations for tropical SST is even stronger than for global temperature – casting further doubt on IPCC’s attribution of the global inconsistency to “natural variability”. In addition, even IPCC’s seemingly broad concession somewhat understates the problem, as all (not “most”) CMIP5 RCP8.5 runs and models run too hot, as shown in the following boxplot:
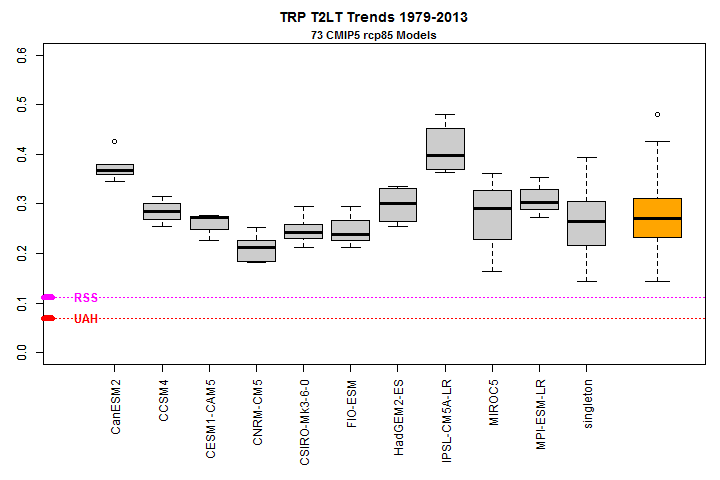
Figure 5. Boxplot of TRP TLT trends 1979-2013 for CMIP5 RCP8.5 models. Here I’ve used John Christy’s collation of CMIP5 runs. Christy collated RCP8.5 because that was used in Santer et al 2013. The historic portion of RCP8.5 and RCP 4.5 is very similar. It is possible that a couple of RCP4.5 runs will yield lower trends, but the overwhelming point will remain.
Although IPCC largely conceded the discrepancy, they couldn’t help taking a thoroughly unwarranted sideswipe at McKitrick et al 2010, stating:
The very high significance levels of model–observation discrepancies in LT and MT trends that were obtained in some studies (e.g., Douglass et al., 2008; McKitrick et al., 2010) thus arose to a substantial degree from using the standard error of the model ensemble mean as a measure of uncertainty, instead of the ensemble standard deviation or some other appropriate measure for uncertainty arising from internal climate variability.
The very high levels of significance observed in McKitrick et al 2010 occurred because there were very high levels of significance, not because of the use of “inappropriate” statistics. Indeed, as observed in our rejected submission, had Santer et al 2008 used up-to-data, their own method would have demonstrated the “very high significance levels” that IPCC objects to here.
Conclusion
No credence should be given to IPCC’s last-minute attribution of the discrepancy to “natural variability”. IPCC’s ad hoc analysis purporting to support this claim does not stand up to the light of day.
Gavin Schmidt excused IPCC’s failure to squarely address the discrepancy between models and observations saying that it was “just ridiculous” that IPCC be “up to date”:
The idea that IPCC needs to be up to date on what was written last week is just ridiculous.”
But the problem not arise “last week”. While the issue has only recently become acute, it has become acute because of accumulating failure during the AR5 assessment process, including errors and misrepresentations by IPCC in the assessments sent out for external review; the almost total failure of the academic climate community to address the discrepancy; gatekeeping by fellow-traveling journal editors that suppressed criticism of the defects in the limited academic literature on the topic.
Whatever the ultimate scientific explanation for the pause and its implications for the apparent discrepancy between models and observations, policy-makers must be feeling very letdown by the failure of IPCC and its contributing academic community to adequately address an issue that is critical to them and to the public.
That academics (e.g. Fyfe et al here; von Storch here) have finally begun to touch on the problem, but only after the IPCC deadline must surely add to their frustration. Von Storch neatly summarized the problem and calmly (as he does well) set it out as an important topic of ongoing research, but any investor in the climate research process must surely wonder why this wasn’t brought up six years ago in the scoping of the AR5 report.
One cannot help but wonder whether WG1 Chair Thomas Stocker might not have served the policy community better by spending more time ensuring that the discrepancy between models and observations was properly addressed in the IPCC draft reports, perhaps even highlighting research problems while there was time in the process, than figuring out how IPCC could evade FOI requests.


126 Comments
Regarding Figure 1.4, I hadn’t looked at it in the First Draft, but I don’t think the error was due to transposing the reference periods. It looks to me like they mistakenly constrained the models to start in line with the 1990 value of the smoothed series rather than the actual series, and the smoothed series value lies below the 1990 observation. Either way, I conjecture that whoever fixed that error was different from the person who wrote the description in the text, which is why the text wasn’t updated. Also, when the graph was fixed, whoever drew it probably saw how badly it looked for them and tried to dilute the effect by adding the gray shading, in the hopes that careless readers will assume that’s part of the model spread. The gray shading is another example of ad hoc invention-on-the-fly in IPCC reports. The description in the text is incomprehensible and it doesn’t appear in any other graphs of model forecasts, where narrowness of the spread is seen as adding credibility.
Steve that is an unnecessary snip and if I so misunderstood your intention in the article that you feel you have to censor them then I suggest you remove the entire comments as I am clearly not qualified to say it is a great article.
Steve: I think that you’re being too chippy here. I prefer that threads editorially comment on the thread. I snipped for editorial reasons, not because there was anything being “censored”. Reasonable people can disagree on such things.
In response to your snip and a few other helpful comments, I have written this up into an article:
“Climate: UNKNOWNS are greater than KNOWNS”
The conclusion of which is:
“Because the statistics, the logic and plain common sense tells us that man-made warming is smaller than “natural variation” or the “unknowns” that caused the climate models to fail, we can confidently say:
It is unlikely that human influence on climate caused more than half of the increase in global average surface temperature from 1951-2010.
No rational person could support the previous IPCC’s report where they said it was “very likely” that the majority of warming is man-made but to increase this confidence in the face of the failed predictions and the statistical tests that say otherwise is delusional.”
In the SOD they also took a gratuitous swipe at our 2010 paper by saying we only found what we did because we averaged across all the models. My review comment in response was:
So now they add, grudgingly, an admission that individual models are also out of line:
Coopered but leaking,
Green and rotten barrel staves.
The Armada flees.
============
In the SOD they tried to denigrate comparisons of the model means to observations by saying:
My review comment was:
So they changed the statement to
i.e. they just added a few other citations, which probably don’t support their point either. And they still go on to claim “increased confidence in the models” while applying a testing rule that cannot, by definition, support the models.
Thanks for this explanation, Ross. It sounds like they are using the modelling equivalent of data dredging. Since we still regularly see research based on data dredging published in journals and publicised in the media, I guess it is not entirely surprising. But kudos for calling them on it.
Thinking further, it might be worth you getting in touch with Steve Milloy, who knows more about data dredging than anyone else has forgotten.
He has posted your stuff over the years, obviously respects it.
Data dredging and what you have described are much of a muchness, and equally to be deplored.
Ross, doesn’t the claim:
Likewise, to properly represent internal variability, the full model ensemble spread must be used in a comparison against the observations, as is well known from ensemble weather forecasting (e.g. Raftery et al. 2005).
invalidate the reasoning that they used to claim there was not a need to answer Kreiss and Browning’s criticisms?
“Likewise, to properly represent internal variability, the full model ensemble spread must be used in a comparison against the observations, as is well known from ensemble weather forecasting (e.g. Raftery et al. 2005).”
If the realizations from multiple runs of the same model are different only by the small variations in initial conditions used then one model realization is as likely as another, i.e. there is no central tendency of the mean of the model runs. Whether that translates to the trends arising from those realizations is another matter and one I have been attempting to resolve in my own mind. If the trends did follow one on one to the realizations, the mean of trends would not have a central tendency and one trend calculated would be as likely as another from another run of the same model. Under those assumptions a range of trends would be properly compared to the observed trends and the observed trend would be simply one of many possible given the small differences in initial conditions required to change the trend.
Supposedly the chaotic nature of climate should effect trends over a decade or two, but I have found a large range of trends within the CMIP5 historical model runs in the only 2 models run with as many as 10 multiple runs over the period 1964-2005.
Following this approach to its conclusion would perhaps show that the observed temperature trends were within the (lower)range of the trends, over extended periods of time, as determined from the models, but that the model range was so wide that its usefulness in making policy and predictions would be greatly diminished. Since the source of this uncertainty would be the chaotic nature of climate there would be no fixing it (reducing the uncertainty limits) by producing better models.
I think I can show good evidence that the distribution of trends from a multiple run of 10 from 2 models from the CMIP5 Historical model runs for the period 1964-2005 comes from a normal distribution. That would be in line with what I think Ross McKitrick and Lucia have assumed. I summarize my analysis at Lucia’s Blackboard.
http://rankexploits.com/musings/2013/leaked-chapter-9-ar5-musings/#comment-119852
“(e.g. Fyfe et al here; von Storch here)”
links missing.
My SOD review response to their comment about the methodological error of using the model mean was
Since they didn’t change their wording at all, I expect that when they release the author responses to expert review comments, the reply to this one will turn out to be something like “Rejected”
For me it invites questions about their basic understanding of thermodynamics. How could heat possibly accumulate in the deep oceans flowing against a temperature gradient ? The number of states where heat flows upwards is >10**(10**100). It is unimaginably impossible for heat to flow downwards.
Quindi e ridicolo !
It’s an occult explanation, and the last best hope of the alarmists.
=====================
Or, in the official internal jargon of the climate “community”, as Steve nicely puts it, a travesty.
Steve’s point is as always on the money. It’s two minutes to midnight and increasingly thin rabbits are having to be pulled out of the IPCC hat as governments begin to ask the right questions about the models and the pause. Even the UK state broadcaster felt the need to put out a video with Andrew Montford in it yesterday, very hopefully entitled UN ‘certain’ of climate change despite warming pause.
On the right of that video is a sister report with quite a nice layman’s explanation of the Argo project. For the BBC’s David Shukman the favoured explanation is of more heat somehow being in the ocean. But I’m sure Steve’s right at this juncture not to dive into the thermodynamics but to reiterate with von Storch that the models didn’t predict that. Problem not solved.
Let’s focus on the great inadequacy of the IPCC process and of the journals on which it relies, given that this discrepancy has been creeping up on us since before TAR. AR5 can’t look to peer-reviewed literature in order to answer questions from governments, because the relevant contributions were censored out by the journals. As Steve says, a well-earned quandary for this much-praised child of UNEP and UNFCCC.
I think you got the name wrong, it is Jochem Marotzke:
http://www.mpimet.mpg.de/en/staff/jochem-marotzke.html
“So while it is true that 13-year hiatuses occur from time to time in CMIP5 models of a future warming world, they are statistically rather scarce. Given this scarceness, no one can “with medium confidence” attribute the present hiatus to “natural variability” and, whatever the ultimate explanation of the hiatus, IPCC’s attribution “with medium confidence” to “natural variability” is merely wishful thinking.”
Oh but you don’t get it Steve. Medium confidence just means this. They have no idea what caused the hiatus, but they have no explanation available other than natural variability. Therefore their confidence in this explanation is medium, i.e. half-way between zero and certainty.
Must say – that made me chuckle… very aptly described.
” Therefore their confidence in this explanation is medium, i.e. half-way between zero and certainty.”
Oh – I thought they got their confidence from someone in the afterlife, hence “medium” confidence :-0
Is there anyway one can use the AR4 A1B figure with the HADCRU3 and HADCRU4 temperature series?
I don’t doubt you, but find it hard to believe that the IPCC would use a unrepresentative figure that could so be spotted by investigators such as your self.
Lord Lawson is calling for a Public Inquiry and I am sure that a pair of graphics, with overlays, would be much more persuasive than your added double headed arrows.
Do you mean this, from yesterday?
That as I understand it is a separate matter uncovered by Nic Lewis and written up by Andrew Montford for the GWPF. It’s not to do with the IPCC and AR5 but the UK Met Office forecasts for the UK government. It does however involve a GCM running hot. Hard though that may be to believe.
He has been angling for a Public Inquiry since 2009, he could get one too.
Sorry to be picky, but a reference to substantiate that would help us to be precise.
Lawson hasn’t been asking for the same thing since 2009. He argued, like Steve, for a public inquiry into Climategate in 2009, which happened to coincide with the formation of the GWPF, or, failing that, as much openness as possible in what was done. Instead we had the false promise of Russell and Oxburgh leading, among other things, to the Commons select committee on science and technology dialing down its own inquiry. Lawson was surely proved right but he and the rest of us were immediately told to ‘move on’.
What he’s asking for now is different and concerns something different. He should in my view be listened to all the more carefully because of what happened last time around.
I myself am looking forward to discovering discrepancies between the assessments and their complementary executive summaries. History suggests their will be plenty The IPCC assessment “scientists” previous complaints about the professionally-misleading summaries was like listening to bicycle thieves complaining about bank robbers.
Thanks, Steve.
The IPCC has certainly painted itself into a corner. Not too surprising.
Roughly one-half to two-thirds of this difference from the observed trend is due to an overestimate of the SST trend, which is propagated upward because models attempt to maintain static stability.”
With no reference, this reads like a “just so” story.
Tamino has a post up about detecting significance in deviations from trends…
In particular a response to a commenter on therefore the best way to go about the statistical math:
I’m wondering what all the stat-folks think about it. I’m not a stat genius; it seemed reasonable to me.
Steve: my post was about the discrepancy between models and observations, not the “statistical significance” of trends, and, in particular, assessing whether IPCC has supported its assertions. In some datasets, observed trends are about half model trend. In such occasions, I’ve observed that if one wants to say that there is a statistically significant difference between models and observations, then one is equally obliged to say that there is a statistically significant trend. And vice versa. As to your question about my opinion of Tamino’s rant: it does not appear to be plagiarized.
Salamo,
The person who started giving Scott Supak flak on Twitter was me: I told him he needs to specify the method of establishing statistical significance. otherwise, there is no bet. Tamsin Edwards agreed. (Not surprising she agrees as this is an obvious point, but possibly suprising she paid enough attention to the exchange to pipe in.)
For history: It appears Pat Michaels said something during an interview– using a common idiom like “I wouldn ot be surprised X” or “I bet X will happen” or something like that. Then Supak aggressively pursued turning this into a real money bet with the claim that forcing a bet somehow “proves” Michaels believes what he says. But Supak does not seem to know anything about how one figures out ±95% confidence intervals. And now he seems to be trying to learn which method of computing him would most favor him.
On the one hand, that makes sense in terms of wanting to win the money. But it’s inappropriate if the purpose of the bet was to prove Michaels meant what he said. If being willing to place real cash money on ones words were proof one believed what one said, then the bet still has to be structured to match what one said. And in the time period that the quote was made and Supak has been negotiating the Bet, Michaels (whose ‘belief’ is evidently being ‘tested’ by Supak) posted uncertainty intervals computed using a method that is nothing like the any Tamino discusses. It is more similar to the ones Steve is showing in this post here, or the the sorts in Fyfe or Easterlign and Wehrner.
Also: For what it’s worth if we used the method Tamino describes to test whether models agree with observations: The don’t. Not by a long shot. Not. At. All. Haven’t for a long time.
Well there are certain elements of this post that are going to become outdated with some convincing papers already on the way.
Steve: even if you’re right, how would that change my size-up of IPCC’s present position? Even if there are some brilliant solutions in the works, one could reasonably argue that a more honest acknowledgement of the problem by IPCC might have led to earlier publication of these papers. The papers will be too late for the IPCC cutoff and won’t help AR5.
oh my, what an effective rebuttal!! Hand-wave toward a vague assertion about unspecified “convincing papers” not named and not yet published. Oh yes, a helpful way to settle any contentious issue….
Not everything is a rebuttal. The need to force an argument for no apparent reason is odd.
You haven’t answered Steve’s question. Please don’t feel I’m trying to force an argument in pointing this out.
Re: R (Sep 25 00:03),
We’ve yet to have a balanced set of reports.
Your faith is quite impressive, in believing that (the “better” data to be published at an unknown future date?) will represent the first honest analysis, after twenty years of biased analysis and process.
In addition to the extremely low probability that models have been matching data, what Steve has demonstrated is the absolute certainty that the IPCC and mainstream climate science process to date has produced biased results.
This is not a matter of a minor tweak or a bit more data. The overall scientific analysis process for this corner of science has clearly been gamed. It’s no surprise. You can still google to read IPPR’s early government-funded Warm Words PR strategy. It’s been followed closely by many.
What will it take for a new generation of model results to be squarely centered on the new data that emerges? What will it take for a new generation of uncertainty bands to honestly encompass reality?
Sure looks like major reforms would be a minimum. But that’s a policy discussion for another site.
The denouement no doubt turns on the point that they convince of.
So far all I’ve been convinced of is that being knowingly obscure wastes bandwidth.
R:
These papers have yet to see any public scrutiny. It’s worth reviewing this if their validity is accepted by the community, but a lot of papers that look good coming out of the gate end up getting run over by the bus once they make it to print.
The point I was trying to make is that there are certain elements of this discussion and that of the IPCC that are in essence arguments over things that are imaginary. This isn’t to say that there aren’t elements of this discussion which are interesting – just that both the IPCC and Steve are wrong in a couple places in this post.
Steve: I try to be accurate and, if I’ve made errors, I’d like to correct them. Nor do I see how new papers would modify points in this post. Reviewing my post:
– my introduction describes recent statements and seems accurate to me;
– my account of IPCC First and Second Draft seems accurate to me and, in any event, unaffected by new papers;
– likewise my comments on the SPM and gatekeeping of skeptic submissions on the discrepancy;
– my observations about 20th century history also seem accurate to me and not vulnerable to new papers;
– I asked questions about the long past hiatus and deep ocean during that period. New perspectives could arise on this, but data is likely to be an issue. I simply asked questions here and don’t see any statements that could easily become “wrong”
– the boxplots and commentary on discrepancy between models and observations is simply summarizing data and won’t change.
– my conclusion was editorial in nature, but again I don’t see how new papers would affect the editorial points.
I don’t see the errors that you allude to and would appreciate a little more detail on where you believe the errors to occur.
I remain convinced.
I think RealClimate’s posts on the hockey stick still have reference to papers coming soon. Stay Tuned!
Typo?: ” . . . but any investor in the climate research process must surely wonder why this wasn’t brought up six years ago in the scoping of the AR5 report.”
Should that be “investigator”?
Steve: no, I used “investor” intentionally. Governments are large investors in climate research. While they are obviously a different sort of investor than business investors, they must surely be annoyed at the arrogance of the climate community’s failure to deal with the discrepancy.
Stakeholder might be more appropriate.
Nice work, as usual. I’d like to ask you to publish a post that is prescriptive in nature, showing how the IPCC can work its way out of the hole they have dug for themselves. They can blandly ignore the recent work that raises objections to what they write in AR5. That has been their modus operandum for a decade. But, as the IAC tried to do with their governance issues, if someone shows them a way to get out of their dilemma, it at least removes one excuse from their repertoire and just maybe would motivate some of them to explore alternatives to stonewalling.
…[show] how the IPCC can work its way out of the hole they have dug for themselves.”
If you pull that thread a bit too vigorously, the entire sweater is likely to come apart. What the IPCC calls “attribution” is known as “root cause analysis” in the engineering world. There are very rigorous and well-established methods to perform that type of analysis, all of them carefully structured to ensure objectivity. The IPCC completely ignored this body of knowledge and went for a sort of meta-analysis based upon how the scientists wanted to present their information. So you get a little attribution here, a little there, you dance around the effects of changes in cloud cover, and the whole thing never forms a cohesive whole. Meanwhile, most of the scientists are actually just doing what they want to do with little real focus on the key predictions made by AGW. When I asked Stefan Rahmsdorf at RC whether his work on Antarctic warming could be construed as support for (the key prediction of) polar amplification, his response was that it was more aligned with changes in wind patterns. So, er, how did that make the cover of one of the world’s most prestigious science journals? In the approach to the model/observation discrepancy, we see the same sort of willful blindness that the evidence does not support the model outputs to the extent that the models provide zero evidence to support AGW.
“If you pull that thread a bit too vigorously, the entire sweater is likely to come apart.” Weezer fan, by any chance?
Erratum: My comment at 9:23 on September 25 should have referred to Dr. Eric Steig, not Dr. Stefan Rahmsdorf.
Who is Weezer? I collect useful metaphors the way a crow collects shiny coins.
Here is a thought experiment: consider AGW as a deviation from expected behavior in a climate control system. Let’s construct a fault tree to determine root cause (“attribution”). The first fork in the tree is “natural” or “anthropogenic?” Under “anthropogenic,” the fault tree is actually quite sparse. There is just the effect of CO2 on radiative absorption, the effect of land use changes on albedo, and perhaps waste heat itself if you value completeness. Note that this engineering perspective places the work of Dr. Roger Pielke Sr. on land use changes back where it belongs, of equal stature to the radiative hypothesis work (because we don’t really know, do we?). In comparison, the “natural” side of the fault tree is quite rich. Here we find Milankovich, Svensmark, waveform analysis, the conundrum of clouds, and all sorts of fascinating ideas about plausible causes of natural climate change. Now take one of the IPCC reports – any will do – and try to map the scope of effort on various topics against the fault tree. It will take you about five minutes to realize that the IPCC approach actually has very little to do with attribution.
Weezer = nerdy alt-rock group whose first hit was The Sweater Song. Much-repeated line in the chorus: “if you want to destroy my sweater, hold this thread as I walk away. Watch me unravel, I’ll soon be naked. Lying on the floor, I’ve come undone.”
The government “investors” have so much skin in the IPCC’s games that they cannot, at least publicly, express any annoyance at the “climate community’s” failure to deal with not only this discrepancy but all the other rat holes the IPCC has dug for themselves and their investors over the years. To think otherwise is, in my opinion, rather naïve.
“Investor” is exactly the right word.
The governments are investing actual money (our money) in climate research in order to obtain an outcome. What outcome do they seek? You may belive their claim that they just want the “truth” about carbon dioxide and global warming, or you may believe they are just buying research which is designed to convincingly support their existing climate agenda.
Since the model/observed divergence is both a scientific problem and a PR problem the failure of the climaet research industry to adequately address it reduces the value of the research governments are funding.
That must surely annoy the governments who write the checks and make their plans based on the expectation of getting quality and/or convincing research.
PhilH, Steve is not being naive and he never said that governments are going to announce their annoyance publicly. But Joachim Marotzke’s promise that the IPCC will “address this subject head-on” indicates that they are probably doing so privately.
Mr. McIntyre,
As usual a brilliant piece of detective work on your part. Thank you.
You wrote:
At risk of being found guilty of editorializing.
What incredible double-speak.
It appears to me that certain policy makers are getting exactly what they want. What some policy makers currently in power seem to want from the IPCC process is scientific cover for whatever they are actually up to. I read the quote from Der Spiegel as evidence that the German minsters [and whoever else people can decide for themselves] made up their minds long ago on the subject of what they want to do and are simply not going to listen to any contrary ‘scientific advice’.
As far as I can tell, from following you and other reputable thinkers, and as you continue do demonstrate with this article, the fact of the matter is that with the IPCC we are faced with as naked an attempt to “manufacture consent” of the populace as anything Noam Chomsky every dreamed up.
I am not friendly to conspiracy theory, this isn’t conspiratorial thinking, this is just realpolitiks as usual.
I wish it wasn’t so.
Is it time now that we can talk politely about defunding and disbanding the IPCC? It is doing no one, but certain ministers currently in positions of power, any earthly good.
I’ll leave everyone with this thought, trying to keep your eye on the pea does no good at all when the game is a swindle. You have to keep your eyes slightly off the ball to catch it being stolen form the cup by the magician.
W^3
Agreed 🙂
In other words…
[Plaintif] “Your honour, I’d like to strike the last 15 years of evidence from the record.”
[Judge] “And why is that?”
[Plaintif] “BECAUSE IT’S DEVASTATING TO MY CASE!”
it is important not to detract from the effectiveness of climate change warnings by discussing the past 15 years’ lack of global warming.
Sounds like the old Don’t confuse me with the facts.
Dilbert today is on the case
http://dilbert.com/strips/comic/2013-09-26/
Let’s make their comment more honest:
we don’t want anyone detracting from the effectiveness of global warming alarmism, by discussing the past 15 years’ lack of global warming.
Funny, I read what the ministers said as saying, ‘what we are doing is so important, it doesn’t matter what the facts are.’ Maybe I am getting paranoid, but it seems to me they were more concerned about political support for their policies than whether they were actually necessary.
Ok, so now what?
I think the situation with ‘climate science’ in general, as much of a muddle it may be, is not a swindle in quite the way the IPCC process is.
There are no doubt many good scientists doing good work who are involved in the IPCC process – maybe most. One good way to keep a process like this going is to have the people involved defending their own work and reputations. The process though, itself is constructed as a swindle. In a closed-rule institution it doesn’t take many corrupt controllers to steer the ship. All that may be necessary is a corrupted set of constituting articles that are then applied in a self-preserving fashion.
With the help of people much smarter than I, like Steve M. Lucia, and others, the IPCC has been exposed to my satisfaction as essentially a swindle. I don’t believe this is merely the result of systemic incompetence, though I do think incompetence has been engineered into the system. Does anyone here think an adverse result of the the type being discussed in this post could have survived to publication? Anyone??
Somehow, and I don’t know how, these types of ‘mistakes’ are making it through to publication with incredible regularity, resistance to correcting them is enormous, and science shown to be junk continues to be cited in subsequent reports.
At this point I almost don’t care why or how the process got this way or continues to survive. I think it is time to start directing the appropriate energies towards either the deconstituting of the IPCC, or assisting it in whatever way is possible into a slide into complete irrelevance.
Simply exposing their “errors” does not seem to be having the necessary effect – the IPCC’s results are too necessary for those that require them to willingly let them go.
I’m not sure what to do, other than call a swindle a swindle.
W^3
Attributing the discrepancy to “natural variability” and leaving it at that is the biggest cop out of all time. The first thing the models should be aiming for is to accurately reproduce natural variability. Until they can do that, it is pointless trying to do any analysis of attribution.
It reminds me of the Then a miracle occurs cartoon… 🙂
Steve,
you left out this juicy end to the Spiegel quote:
“Climate policy needs the element of fear,” Ott openly admits. “Otherwise, no politician would take on this topic.”
nice!
Quran (8:12) – “I will cast terror into the hearts of those who disbelieve.”
Same mentality.
My graphs will be a bit different because I do something a bit difference. I compute the variances using all non-overlapping periods I can fit into the ‘history+projections”. So our numbers will never match precisely. But they don’t differ much because the general result is “robust” to choice of methodology.
Click to access gcm-acceleration.pdf
So not only do the models run hotter than observations, most of them are accelerating their predictions.
Does anyone else see Orion in that graph, along the y=x line?
Mosh, your comments are often too cryptic for their own good. In this one you’ve pointed to a graph with 84% (26/31) of the dots representing individual GCMs above the line. It says:
Umm … no, 84% of them show “some degree of acceleration in their response”. What is it with the Berkeley Earth guys, why the need to exaggerate? In any case, this means that most GCMs do not show a constant climate sensitivity. Instead, their climate sensitivity increases over time. Except for five of them, whose climate sensitivity decreases over time … go figure.
Now that’s both a bizarre and a very interesting finding … but what are you saying about that? You’re a sharp guy … what was your reason for pointing this out? Me, when I see that, I think “TinkerToy models, anything’s possible, we’re seeing another reason that if you believe them you’re a fool” …
But what do you think?
Thanks,
w.
I tried to evaluate if there is a difference in short term behaviour among high sensitivity and low-sensitivity climate models. However, I was unable to find Rommulan climate model runs at Climate Explorer when I checked a few years ago. Have these been updated?
You’ll have to wait for the paper. I could have been a bit more descriptive in the caption about how the 60% is determined. If you merely count the dots above the line, you’ll be forgeting something.
Anyway, it’s a work in progress and I dont mind sharing some hints with folks along the way. So, think of it as a hint
OT, but an interesting episode in the drive for more open access science:
a series of papers dealing with data from NASA’s Mars Curiosity mission were paywalled at Science mag., even though US law requires all such data to be publicly available. The science blogger (and prominent biologist) at the link above decided to “liberate” them….
snip
w.
“as can be seen”
snip
Steve Mc: I would prefer that both of you minimize foodfight aspects of this. I’ve also snipped the post to which you’re responding.
Edit query: “up-to-data” = up to date?
If the global warming signal can be masked for long periods by energy flows into the deep oceans, presumably a spurious or exaggerated warming signal can be created by flows in the opposite direction.
By definition AR5 should, in part, be about what has happened since AR4.
So the model runs that are claimed to produce a “hiatus” of a decade (or more); Did they predict the current continuing hiatus, using only the data available at the time?
Or, based on more recent data, are they merely predicting an occasional hiatus at some indeterminate points in the future?
Also, Lucia has discussed the claims about volcanoes, but what climatologically significant volcanic anomalies have occurred since 1991? I wouldn’t expect these to be predicted, but I was also given to believe there hadn’t been any.
Their famous attribution graph depends on the assumption that their models accurately simulate natural variability with so much precision that they can draw tiny little blue uncertainty bands around the simulations that don’t overlap with the GHG forcing simulations.
Now they admit there are sources of natural variability that they have no clue about, the uncertainty of which is wide enough to account for extended non-warming even in the presence of rising GHGs. This sounds like a fundamental contradiction of the basis of their attribution argument.
I think the IPCC’s problem is they are trying to improvise wording that will sound plausible over the next few days, but what they need is wording that will sound reasonable over the next few years. When people look at the SPM in 2015 or 2016, it won’t matter if it was acceptable to the German delegation in fall 2013 if it turns out to be preposterous compared to reality.
Plagiarised within ten minutes in a tweet response I was already doing to a programmer friend who’s become a behavioural economist of late. With attribution of course. Thanks Ross.
Just check the corresponding attribution graph in AR5, which is worse still.
They put in lines for the model mean, not just uncertainty bands, and there are many more graphics, covering the oceans as well as land, and even the extent of polar sea ice.
Overall the model means stick like glue to the observations, giving an impression of near-perfect understanding not just of global but of regional climate change over the last century.
The models – or at least their means – are now precisely tuned to the observations. Just one problem, they are still obviously crap since as soon as they go from hindcast to forecast, they fail.
When they invoke “natural variability,” they of course mean within the warming trend which they have already proved (to their satisfaction) to be occurring in previous IPCC reports.
But natural variability can also occur over centuries and millenia. It apparently has not occurred to them that if you invoke “natural variability” that you could just as easily say climate has been warming up (literally and figuratively :-}) for a century-long cooling trend. They are expropriating the use of the term “natural variability”– which is widely used by skeptics– in a limited way in order to serve their purposes.
The “hiatus” at 15 years is now nearly as long as the 18 years of warming that triggered global-warming alarmism. It seems to me they will be in trouble if the hiatus exceeds in length that of the warming trend, because as Steve points out, there was 40 years of cooling before that warming.
It is Klimaziebel, *not* Klimazweibel.
BTW: It has *nothing* to do with “zwei” (German for “two”), but instead is the German word for “Onion”: Zwiebel. Pronounced it sounds something like saying in English: “Ts-we bell.” So translated it is Climate-Onion (Klima-Zwiebel).
Sorry, meant to write: Klimazwiebel.
(I can’t even spell …)
As many people whose native language is English have a problem have with Klimazwiebel, maybe this helps?
Do you know Zwieback? The first part (“Zwie-“) is pronounced the same as the first part of Zwiebel. So think of ZWIEback, if you want to write KlimaZWIEbel.
(To confuse matters, unlike “Zwiebel” the “Zwie-” part of Zwieback *is* actually related to “Zwei”, as in “Twice-Backed”. But enough of such strange languages.)
Climate-Onion? Interesting. Is that the kind they consume at Penn State?
“Mann ist was Mann ißt.”
But I know it’s Scheiße in his case. He probably just has the odd klimate zwiebel or zwei to mask the smell.
They don’t work though. Phorrr!
When I learned German in High School in the US in the 70s (from a native German speaker) the “w” was always pronounced as a “v” is pronounced in english. Hence “zwei” would be pronounced “tsvy”. I don’t remember specifically encountering the word “zwiebel” but I would think it would be pronounced “tsveebel”.
I tried Google Translate, but the audio seems pretty hoffic.
hoffic=horrific
how do I get rid of the Follow Climate Audit popup.
Cannot read the blog now unless full screen
Useful analysis and very clear dataviz of some relevant data at the Financial Times Blog:
http://blogs.ft.com/ftdata/2013/09/23/how-the-ipccs-projections-match-up/?
These are worth looking at if only because the visualization is very clean and the data is hard to challenge.
Steve: it’s not as clean as you think. They’ve included “commit” as one of the projections.
Very general (and basic) question. If somehow the extra energy had been going into the deep ocean would this mechanism of ‘warming’ (whatever that is proposed to be?) still require the expected increased rate of tropical troposphere temp increases?
Here’s one of the many problems I have with their figures for the change in ocean heat content. The link DocMartyn gave above says that the increase in ocean heat content is about 2E+17 megajoules. The mass of the atmosphere is about 5.3E+15 tonnes. That gives us 38 MJ/tonne. Specific heat of the atmosphere is about one megajoule per tonne per °C.
That means that we must be incredibly lucky, because if that amount of heat had gone into the atmosphere, it would have been enough to raise the atmospheric temperature by 38°C …
So … where is that heat coming from? Did the downwelling radiation suddenly take a big jump? And did the oceanic absorption also suddenly take a perfectly corresponding jump, of just the right amount to avert Termageddon?
You can see the problem …
w.
Willis,
They may need the help of these good people…nearby to Toronto too!
http://www.shouldice.com/
Donna LaFramboise has an excellent column on this subject in today’s Wall Street Journal. I think it’s paywalled, but I’m going to link it in case it’s not and for those who subscribe:
http://online.wsj.com/article/SB10001424127887323981304579079030750537994.html?mod=WSJ_Opinion_LEADTop
Willis, your back of the envelope calculation using the standard e=mc(deltaT) calculation rearranged to indicate a 38K rise in GAT is based on old physics.
Clearly you haven’t received the memo re the new, improved physics that kicked in betwixt AR4 and AR5.
I’m sure that Kevin will be willing to fill you in.
“Opening the door also opens up questions about the potential length of the present hiatus. If unmodeled deep ocean processes are involved, how can we say with any certainty that the present hiatus won’t extend for 30-40 years?”
Or assuming climate models are correct about the delta in forcings, how long can the oceans buffer heat and push out equilibrium? Maybe someone knows offhand. I don’t.
‘Marotzke felt it necessary to add that “climate researchers have an obligation not to environmental policy but to the truth”.’
With this statement Marotzke implicity concedes that “environmental policy” and “the truth” are distinct and not necessarily compatible.
A ray of light emerges from the IPCC.
An analysis of the residuals between the models and the data would probably show a skewed distribution that’s most likely centered above zero due to the “warm bias” built into the models. What’s more, I wager that the temperature is heading downward and that will make it really difficult for the IPCC to continue to ignore the lack of fit their models have with the data.
So if I accept the missing energy is going to OHC to explain the hiatus as postulated by Climate Science (TM)then they also need to explain when and why this started occurring 15 years ago (or more for lag). Or rather why it has become – evidently – dominant since then.
Or did I miss this explanation?
There’s a continuous flow of heat into and out of the deeper layers. The hypothesis about the “missing heat” going into the depths involves changes to these flows, on average, during the last 15 years relative to before that. Of course, these heat flows are almost certainly as variable as, say, land temperatures (within appropriate limits), so different averaging periods will produce different appearances.
And, of course, we don’t have data for before 3-4 decades ago, so there’s no inconvenient history of changing heat flows to mess up the hypothesis.
Steve: In your penultimate paragraph there are what I believe you intended to be links to papers by Fyfe and von Storch, but all I see in both cases is the word “here” with no associated link. Thanks.
Given the state of AR5 and a bit of Bayes, what’re the odds on an AR6 ever appearing?
Pointman
The Gatekeeping Problem.
On the assumption that the existing journals are resolutely unreformable, would it not make sense to create others?
excellent summary. Something that is not emphasized enough: The current hiatus in warming cannot be compared to previous similar periods for the simple reason that the recent strength of radiative forcing has (theoretically) been at a *maximum*. The last 15 years is when you LEAST expect warming to stop.
Re: Roy Spencer (Sep 26 14:37),
My own guess, based on the pattern of the historical Central England Temperature Record (CET) between 1659 and 2007, is that The Pause is merely a pause, and that at some point in the future, the 1975-1998 warming trend is likely to resume — a decade from now, two decades from now whenever, it happens. Repeating a post I put up at The Blackboard:
Regarding TimTheToolMan’s prediction as to how the IPCC and the climate science community will deal with the issue, the more one thinks about the IPCC’s dilemma, the more one should believe that this is just what they will do, they will tune AR5’s modeling in ways which get a better recent fit, sacrificing some historical fit to do so, and then they will produce a series of new papers which rewrite the history of ocean heat content to match.
This containment strategy will be pursued under the banner of “moving the science forward.”
Once the final AR5 report is published and the public response to its conclusions begins to emerge, let’s periodically revisit TimTheToolMan’s prediction to see how the IPCC’s containment strategy is developing.
Now, if a warming trend of some kind resumes before AR6, the IPCC and the climate science community will consider themselves off the hook, even if the warming trend predicted by AR4 models, shifted to the right in time, remains below the lower boundary of the AR4 model ensemble.
But what if The Pause continues into AR6 and beyond, i.e. a flat or declining atmospheric global mean temperature in the face of ever-rising GHG emissions?
If that’s what happens, let’s all come back in another seven years to see just how convoluted the IPCC’s AR6 explanations become over that seven-year period relative to the previous AR4 and AR5 reports.
In any case, the IPCC and the climate science community will hang tough regardless of where global mean temperature goes in the next two to three decades. It is all but written in their job descriptions they have to do this.
On the subject of the IPCC:
<James Delingpole, always entertaining
As you will, Richard
However, Lubos Motl has done this for us:
http://motls.blogspot.com.au/2013/09/ocean-heat-content-relentless-but.html
Roy’s point is spot on. The issue isn’t the “pause” per se, but the gap in comparison to the model projections for conditions over the past 15 years. Figure 9.8A in the SOD shows that the current gap is unprecedented. Up to 1998 the model average and the observational average regularly cross back and forth. They stop crossing in 1998, and diverge thereafter.
Can someone point me to the best explanation of how to correctly determine the relative offsets of the models-vs-temperature graphs?
Heat could well be flowing into the oceans but it cannot possibly flow into the atmosphere today then suddenly switch to flowing into the oceans tomorrow and then maybe flowing back into the atmosphere the day after. Thermal systems simply do not work that way. Heat would flow into all sinks atmosphere, oceans, land and everything else all the time.
Another point, CAGW advocates continuously claim very long time constants in the climate system with the impact of rising CO2 lasting centuries (despite the fact that the direct change in forcing due to a change in CO2 levels is instantaneous). This long time constant is mandatory to their claims since if the time constant is short we would have already seen essentially all the impact from half a doubling of CO2 which, using their numbers, is more than half of the total 0.7C of warming they claim. That means a full doubling is more than half of 1.4C so somewhere between 0.7C and 1.4C by their numbers – well below the 2C threshold for catastrophic. Yet now they claim the pause is due to a “natural” change in forcing suggesting the climate system responds almost instantaneously to changes in forcing. So which is it? Does a change in forcing elicit an instantaneous response or is there a long time constant. If the latter, does that mean the current claimed “natural” change in forcing is only the start of a very long time constant response? Given the severity of the initial response it suggests we could be in for centuries of substantial cooling.
From the caption to Figure 2 in SM’s headpost: “IPCC authors added a grey envelope around the AR4 envelope, presumably to give rhetorical support for their false claim about models and observations; however, this envelope did not occur in AR4 or any peer reviewed literature.” (!!) Even though I read little or nothing about this in the comments here, I imagine that others as well as myself are appalled and stunned (but not surprised?) by this bit of witchcraft from the IPCC. Talk about disingenuous! In a way, this added non-literature grey envelope is another example of “hide the decline”. I suppose that you more-veteran observers of all these shenanigans just yawn and say “So what’s new” when these things are pointed out, but little ol’ naive me is still totally floored by this behavior by the IPCC.
Through the magic of Photoshop, we can still see what Fig 1-4 would look like without the superfluous gray patch:
🙂
I heartily recommend this to be promoted to an ‘update’ appendage on the main post. That gray thing was working to obscure the problem being discussed.
Nice! job by Roman, using the statistician’s friend; Photoshop…
Nice to see some data points for 2012 and 2013…
RR
Pardon my ignorance by do you or anybody else understand why IPCC observations done only 10 years ago need “big” error bars?
But the problem not arise “last week”.
Word missing?
I don’t know if anyone noticed, but there is no more “best estimate” for climate sensitivity (because of…. no consensus ! it’s written right there in the SPM)
And the good comment would be : has there ever been one ?
On a point of information, can someone tell me where the figures that go with the SPM can be found, e.g Fig 1-4 which RomanM photoshopped above? All I see in the SPM is “insert figure xxx here”.
Thanks,
Rich.
See – owe to Rich,
You’ll find them all at the end of the report.
Doh! ;~p
In political terms, AR5 was actually the incoherent and rambling suicide note of the IPCC.
Pointman
You may be able to add “wandering” and “internally inconsistent” to your description of “AR5.” I can almost guarantee it. All that was released so far (which your article mentions) is the “summary for policy makers,” which I have called “executive summary” above. The underlying document, i.e., that being summarized, is the document named “The Physical Science Basis.” If consistent with IPCC traditions, the AR5 “summary” will contain a wealth of misrepresentations and exaggerations about the underlying “science” document, the latter itself flawed, just not as awful as the “summary.” The IPCC website says “The Physical Science Basis” document will be released tomorrow, Sept 30. The report will not only be of interest for its own contents, but how the “summary” misstates or strategically ignores them. The delay of the release, a few days after the summary’s release, is almost a guarantee the pr ringmasters of the IPCC does not want the summary and the underlying document compared.
IPCC not taking in consideration ”intentionally” the pause; are proving that they don’t have any shame at all.
Michael Mann has offered his own spin on the recent IPCC and PAGES 2K work, in a vituperative op-ed:
Michael Mann: Climate-Change Deniers Must Stop Distorting the Evidence (Op-Ed)
Re: Skiphil (Sep 29 20:33),
So, the guys who would never put thermometry together with reconstructions have done it yet again… along with all the rest of their shenanigans.
It must be getting hard to so vociferously remain in denial that the data puts the lie to one’s strongly held beliefs.
I keep wondering what it would take for them to get excited about the challenge of discovering that a completely different model is needed, one that appreciates earth’s resilience and nature’s variability.
Lucia, SteveF, thanks for your responses.
Would it be fair to say that The Blackboard exists not to find definitive answers to the basic scientific questions surrounding climate processes and climate change, but to provide a forum where those with an interest in the nitty-gritty details can get together and offer up their own fairly detailed technical and scientific insights into those issues, as the issues are developing?
In other words, The Blackboard is not acting as Alternative IPCC which is attempting to champion some cohesive set of alternative viewpoints concerning the scientific issues surrounding climate change.
Rather, one viewpoint is as good as another here on this forum as long as a contributor offers a properly supported analysis which does not violate the laws of physics and which does not veer off into the weeds by pushing outlandish notions such as there is no true greenhouse effect operative in the atmosphere.
I think the crowd at The Blackboard simply enjoy playing whack-a-mole with poor scienctific papers and public statements and see post modern climate scientists as so many giraffes parading at the windfarm.
“I calculated all 13-year trends for all 109 CMIP5 RCP4.5 models presently at KNMI for the warming period 2005-2050, yielding a population of 3379 trends (109 models * 31 starting years). Only 0.5% of the population were negative (19 of 3379) and only 0.3% (10 of 3379) were lower than the slightly negative observed trend.”
Very helpful calculation! It tackles “head on” (to quote Marotzke) the “we expected that” tack that Climate Science is taking:
“The slow rate of warming of the recent past is consistent with the kind of variability that some of us predicted nearly a decade ago.”
The chapter 9 version released by the IPCC today is the June 7, 2013 draft sent to governments. It bears the identical header and footer and pagination.
I wouldn’t be surprised if all chapters date to June 7. They issued a PDF of corrections dated Sept. 27 which are going to cause changes to various chapters to make the science match the SPM. They claim the changes will be minor. Take with a grain of salt and all that I expect.
The top link on this page contains corrections to be made.
http://www.climatechange2013.org/report/review-drafts/
These are the chapters where changes will be made.
TS, 1, 2, 3, 4, 5, 6 … 11, 12, 13, 14
Francis Zwiers, vice chair of the IPCC WG1 speaking on a local CBC radio show today about the latest report and is asked about “the pause” (at 37:44). His explanation is interesting. Apparently he thinks that the models being wrong are the least plausible explanation.
[audio src="http://podcast.cbc.ca/mp3/podcasts/bcalmanac_20130930_57108.mp3" /]
Totally off topic, but grab a copy of this…
The Age of Global Warming, by Rupert Darwall – ISBN 9780704372993, Quartet Books
It’s a fantastic walk through how we got to where we are.
We take a further look at the IPCC’s analysis of models vs. observations here:
http://www.cato.org/blog/clear-example-ipcc-ideology-trumping-fact
-Chip
20 Trackbacks
[…] But the problem not arise “last week”. While the issue has only recently become acute, it has become acute because of accumulating failure during the AR5 assessment process, including errors and misrepresentations by IPCC in the assessments sent out for external review; the almost total failure of the academic climate community to address the discrepancy; gatekeeping by fellow-traveling journal editors that suppressed criticism of the defects in the limited academic literature on the topic. climate audit […]
[…] a must-read post today, Steve McIntyre demolishes the credibility of the IPCC as a scientific organization, demonstrating […]
[…] Steve McIntyre has come out of apparent semi-retirement to comment on how the IPCC addresses the disparity between models and observations. […]
[…] More here: https://climateaudit.org/2013/09/24/two-minutes-to-midnight/ […]
[…] fors meer opwarmen dan het werkelijke klimaat. De afgelopen weken hebben zowel Lucia Liljegren als Stephen McIntyre daar uitgebreid over […]
[…] On the eve of the official release of the latest report, Steve McIntyre has some thoughts. […]
[…] period of 34 years. This was very well explained in Steve McIntyre’s latest blog article two minutes to midnight where he showed that over the period 1979-2013 models on average warm up 50% faster than the real […]
[…] statistician do such work (e.g. Lucia Liljegren or Steve McIntyre) and what they find is remarkable: the average of all those climate model runs is not consistent […]
[…] https://climateaudit.org/2013/09/24/two-minutes-to-midnight/#more-18392 […]
[…] « Two Minutes to Midnight […]
[…] Here is Figure 1.4 of the Second Order Draft, showing post-AR4 observations outside the envelope of projections from the earlier IPCC assessment reports (see previous discussion here). […]
[…] Here is Figure 1.4 of the Second Order Draft, showing post-AR4 observations outside the envelope of projections from the earlier IPCC assessment reports (see previous discussion here). […]
[…] Here is Figure 1.4 of the Second Order Draft, showing post-AR4 observations outside the envelope of projections from the earlier IPCC assessment reports (see previous discussion here). […]
[…] binnen de modelrange van verschillende IPCC-rapporten valt. Ik baseer me hier grotendeels op de analyse (en hier) van Steve McIntyre op Climate Audit. In de first draft zat er een fout in grafiek 1.4 […]
[…] McIntyre pointed out some time ago, here, that almost all the global climate models around which much of the IPCC’s AR5 WGI report was […]
[…] all model climates warmed much faster than the real climate over the last 35 years. Source: https://climateaudit.org/2013/09/24/two-minutes-to-midnight/. Models with multiple runs have separate boxplots; models with single runs are grouped together in […]
[…] […]
[…] simulated by those models to be, on average, in line with reality. But as Steve McIntyre showed, here, that is far from being the case. On average, CMIP5 models overestimate the warming trend between […]
[…] when AR5 was released, I noted that there was negligible literature available to AR5 about the discrepancy between models and […]
[…] when AR5 was released, I noted that there was negligible literature available to AR5 about the discrepancy between models and […]