There has been considerable recent attention to Rosenthal et al 2013 (pdfpdf SI) :WUWT here, Judy Curry here, Andy Revkin here.
The article itself presents a Holocene temperature reconstruction that is very much at odds both with Marcott et al 2013 and Mann et al 2008. And, only a few weeks after IPCC expressed great confidence in the non-worldwideness of the Medieval Warm Period, Rosenthal et al 2013 argued that the Little Ice Age, Medieval Warm Period and Holocene Optimum were all global events.
Although (or perhaps because) the article apparently contradicts heroes of the revolution, Rosenthal et al 2013 included a single sentence of genuflection to CAGW:
The modern rate of Pacific OHC change is, however, the highest in the past 10,000 years (Fig. 4 and table S3).
In the Columbia and Rutgers press releases accompanying the article, this claim was ratcheted up into the much more grandiose assertion that modern warming is “15 times faster” than in previous warming cycles over the past 10,000 years (though the term “15 times faster” is not actually made in the peer reviewed article):
In a reconstruction of Pacific Ocean temperatures in the last 10,000 years, researchers have found that its middle depths have warmed 15 times faster in the last 60 years than they did during apparent natural warming cycles in the previous 10,000.
Rather than quoting the article itself, Michael Mann, an academic activist at Penn State University, repeated the claim from the press release in an article at Huffington Post entitled “Pacific Ocean Warming at Fastest Rate in 10,000 Years”.
However, both the claim in the press release and the somewhat weaker claim in the article appear to be unsupported by the actual data.
In the past, we’ve often observed that great care needs to be taken in the interpretation of spaghetti graphs containing both instrumental and proxy data. In the present case, none of the graphics in Rosenthal et al 2013 contain both instrumental and proxy data, a deficiency that I’ve attempted to remedy in today’s post.
First, here is Rosenthal’s figure (3B) showing their reconstruction of IWT (Intermediate Water Temperature) for the past two millennia, which shows a sharp decline in temperature from the medieval period to the Little Ice Age (which, as at Baffin Island also in the news lately, was the coldest period in the past 10,000 years), with a recovery in the 20th century, but to levels lower than those of the medieval and earlier periods.
On the far right, I’ve plotted Pacific ocean heat content, converted to deg C anomaly (red), together with its trend line. The two solid yellow lines show trend lines for 1100-1700 AD and 1600-1950 AD, two of the three periods considered in Rosenthal Table S4. It is true that the rate of change over the past 55 years is somewhat higher than the trend over 1600-1950, but it is not “15 times higher”. While I don’t think that one can safely reify the fluctuations in Rosenthal’s IWT reconstructions, on the other hand, these fluctuations appear to me to preclude any strong conclusions that the relatively modest increase is unprecedented.

Figure 1. Annotation of Rosenthal Figure 3B. Original caption: “Compiled IWT anomalies based on Indonesian records spanning the ~500- to 900-m water depth (for individual records, see fig. S7). The shaded band represents +-1 SD. Red- OHC Pacific 0-700m heat content converted to temperature using the 0-700m Pacific mass shown in the Rosenthal SI. The values are consistent with 0-700m temperature anomaly values at NOAA http://www.nodc.noaa.gov/OC5/3M_HEAT_CONTENT/index3.html.
In my annotation of their Figure 3B shown above, I’ve shown two trend lines, each of which more or less corresponds to the trends reported on lines 2 and 3 of Table S3: a trend of -0.15 deg C/century from 1100-1700 and a trend of 0.09 deg C/century from 1600-1950.
Rosenthal’s Holocene Figure
Rosenthal’s Figure 2 shows their temperature reconstruction over the past 10000 years (the version in their Figure 2C is shown below.) I’ve overlaid my digitization of their two-millennium reconstruction shown above (cyan). (Unfortunately, Rosenthal and coauthors didn’t archive anything: neither reconstruction nor underlying data, though, in response to my email, Rosenthal has undertaken to do so.) Once again, I’ve shown the temperature anomaly (as I’ve calculated it from instrumental ocean heat content) in red. At a Holocene scale, it is a very small squiggle – which I’ve accordingly highlighted by a circle around the squiggle). On the right is a blow-up of the graph in the left panel for the past 500 years.
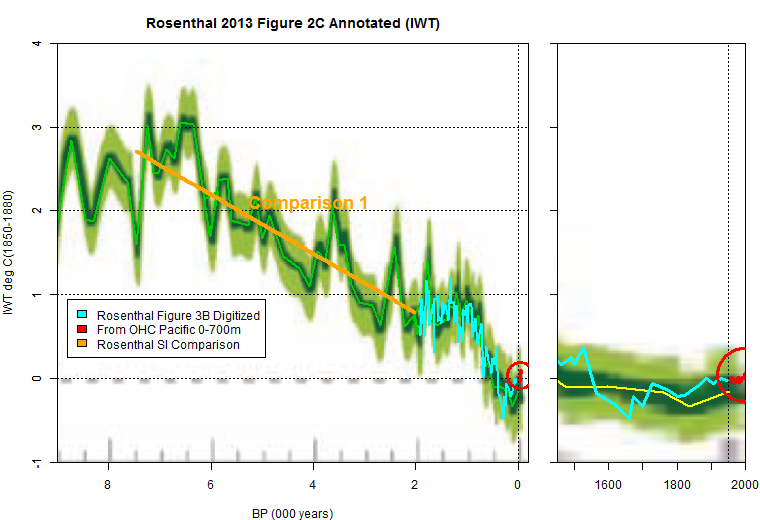
Figure 2. From Rosenthal et al 2013 Figure 2C. Red- temperature anomaly converted from NOAA Pacific Ocean 0-700m ocean heat content. Cyan – Rosenthal Figure 3B reconstruction (my digitization). Orange trend line shows third comparison from Rosenthal SI, taken from first row in Table S3.
As with the two-millennium figure, there are many fluctuations within the reconstruction with much greater rates of change over a century than calculated from the modern instrumental OHC record.
Although spin by Mann and others has focused on the modern portion, Rosenthal and coauthors observe that their reconstruction differs on important points from that of Marcott et al 2013,
To the extent that our reconstruction reflects high-latitude climate conditions in both hemispheres, it differs considerably from the recent surface compilations, which suggest ~2°C MWP to- LIA cooling in the 30°N to 90°N zone, whereas the 30°S to 90°S zone warmed by ~0.6°C during the same interval (24- Marcott et al 2013). In contrast, our composite IWT records of water masses linked to NH and SH water masses imply similar patterns of MWP-to- LIA cooling at the source regions.
They showed the Marcott et al 2013 reconstruction in their Figure 2, apparently unaware that its 20th century uptick is (at best) an artifact. It is regrettable that Marcott and coauthors have not issued a corrigendum conceding that the uptick cannot be relied on.
Although IPCC recently reported much confidence in the non-globalness of the MWP, Rosenthal et al took the opposite view:
The inferred similarity in temperature anomalies at both hemispheres is consistent with recent evidence from Antarctica (30), thereby supporting the idea that the HTM (Holocene Thermal Maximum), MWP, and LIA were global events.
Given all the publicity about the supposed unprecedentedness of the recent increase in Rosenthal et al 2013, the data in the article offers little support for the assertion that the modern rate of increase is 15 times greater than any previous increase – or, indeed, for the weaker proposition that the modern increase is unprecedented. Moreover, it stands against claims that modern temperatures are themselves unprecedented, not only within the Holocene, but within the last two millennia.
Rosenthal’s Boxplot and Table S3
Rosenthal’s assertion that recent OHC trends are unprecedented are derived from their Figure 4B, shown below. This figure is shown as a box plot – a standard technique for showing distributions. However, it is, so to speak, a fake box plot, as I’ll discuss below.
First and most obviously, the length of the periods being compared are totally different. The modern instrumental period is 55 years, while the first boxplot is a decline over 5500 years, within which proxy data has substantial fluctuations.
The figure “15 times” appears to be related somehow to the comparison between the instrumnental increase (fourth box) and the rate of increase in the post-LIA reconstruction (the other two trends being negative.) The instrumental box median OHC rate of change is 15E22 joules/century (compare to Table S3 fifth column) while the LIA recovery box (third box) “median” rate of change is 1.5E22 joules/century (also compare to Table S3). (I’ll discuss these questionable calculations below.) Their ratio is 10, not 15. Perhaps Phil Jones did the calculation for them. Or maybe something else.
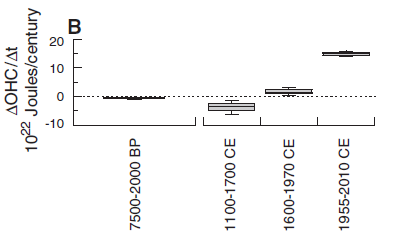
Rosenthal et al 2013 Figure 4B. Reconstructed rates of OHC change during the main transition periods. Reconstructed anomalies and rates are compared with modern observations for the 2000 to 2010 and 1955 to 2010 CE periods, respectively (5). The middle line at each box represents an average estimate for 50% of the Pacific volume between 0 and 700 m, whereas the top and bottom quartiles of the box represent 62.5 and 37.5% of the total volume in this depth interval, respectively. The bottom whiskers represent 25% of the volume; the top whisker denotes 75%. The modern value is based on the entire Pacific volume for 0 to 700 m.
Table S4 is shown below. Its 2nd column shows temperature deltas. The 1600-1950 change (third row) is shown as 0.25 deg C, while the 1955-2010 instrumental (from OHC) is shown as 0.11 deg C. The next column purports to convert temperature change into ocean heat content change.
In the reconstructions, the temperature change is converted to Pacific Ocean Heat Content change by multiplying the estimated temperature change by 50% of the mass of the Pacific Ocean (they use a mass of Mz=1.12E20 Kg and a specific heat of 4 J/deg C-g.) Watch this carefully: this calculation assumes a temperature change of zero on the rest of the ocean – an assumption that radically contradicts their observations that they are observing global phenomena. And while one can understand the reluctance to extrapolate to the entire ocean, this inability means that the relevant instrumental comparison ought to be to half the Pacific Ocean as well. Watching this pea also shows the absurdity of the “quartiles” in the boxplot. These “quartiles” are nothing more than applying zero to 37.5% and 62.5% of the ocean respectively.
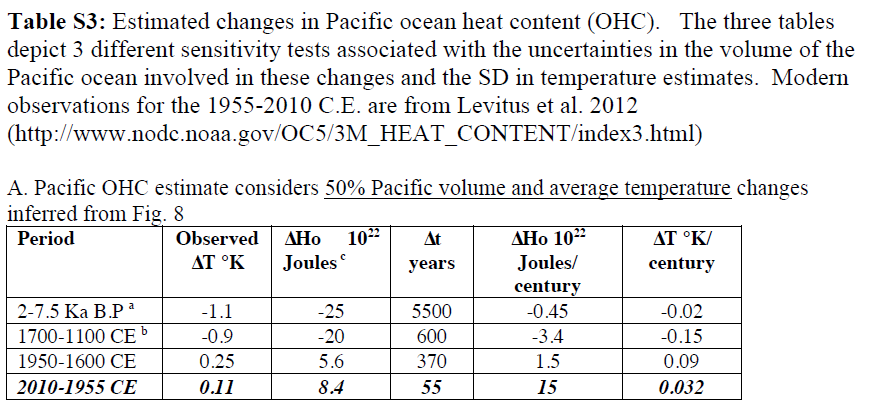
While this basic assumption of Table S3 and Figure 4 makes no sense, there are other problems as well. Look closely at Table S3. The delta-temperature is less than half (0.11 versus 0.25), but the delta OHC is 50% greater (8.4 versus 5.6). One can “get” the delta-OHC for the reconstruction periods by multiplying the deg C by the Pacific Ocean mass (Mz=1.12E20 Kg and a specific heat of 4 J/deg C-g) and multiplying by 50%. If the same procedure were applied to the instrumental period, one would get a delta-OHC of 2.6E22 joules (as compared to 8.4). Applied to the rate of change, the implication is that the rate of change in the instrumental period would be 2.8 times the average rate of change in the post-LIA period (1600-1950), rather than 15 times. Even if one accepted the Rosenthal et al assumption that one could apply zero to half the reconstruction ocean, there seems to be something wrong with the arithmetic to 8.4E22 joules. There also seems to be an error with the value of 0.032 deg C/century (fifth column fourth row) as this is inconsistent with other columns.
While the calculations in this table seem peculiar – ranging from apparent arithmetic errors to questionable extrapolation from temperature change to ocean heat content, one should not presume that a corrected version of this table necessarily makes sense: the entire enterprise of attempting to compare changes in ocean heat content based on proxy data on Intermediate Water seems both ill-conceived and forced.
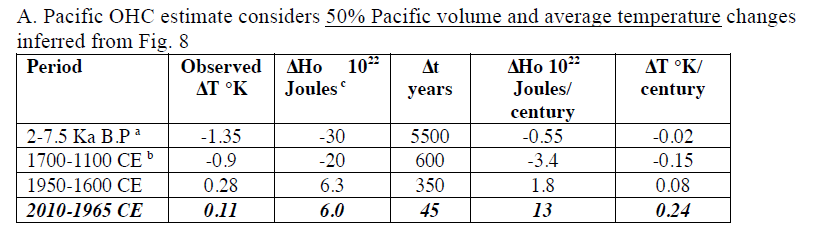
Update Mar 2, 2014. Last year, I requested the underlying data for this article from Rosenthal and from Sciencemag. Rosenthal promised on several occasions to provide the data, but repeatedly failed to live up to his promise. In January 2014, Rosenthal archived the data in a revised SI at Sciencemag – without the courtesy of notify me that he had done so.
In my blog article on Rosenthal et al 2013, I had pointed out that Table S3 appeared to contain numerous errors.
The revised SI states that Table S3 contains errors. Rosenthal didn’t acknowledge or thank me for pointing out these errors.

The re-stated table S3 is shown below. The largest change is in their delta-T per century, where the reported value has been increased from 0.032 to 0.24. This was presumably some sort of mechanical error in the previous article. Other changes include shortening the modern Levitus period from 55 years to 45 years – I’m not sure why this was done. Changing the delta-T in the holocene (first line) from 8.4 to 6 – I still don’t see how they get this number. As before, their comparison of historical to modern depends on the assumption that the heat content in one half of the historical ocean changes without change in the other half: this doubles the modern comparison, thereby exaggerating the effect.
Postscript
The ocean cores are four in Makassar Strait:
- multi-core BJ8-03-31MCA/gravity cores BJ8-03-32GGC (31MC/32GGC)
- 70GGC;
- BJ8-03-34GGC (34GGC);
- 47MC/48GGC
and three in Flores Sea:
- BJ-03-13GGC;
- 10GGC; and
- 6MC/7GGC.
See SI; xlsx, Old https://science.sciencemag.org/highwire/filestream/595303/field_highwire_adjunct_files/1/Rosenthal.SM.pdf See also Oppo et al 2009.


97 Comments
from the “Climate Science Guide to Good Paper Writing” (copyright, “The Team”, reproduced without permission, link to original has been removed to protect the guilty):
unprecedented (cli. sci.):
1) used in the press release to create media interest in an otherwise uninteresting paper;
2) used in the paper itself to:
i) hide the fact that changes are not actually alarming in magnitude;
ii) improve the chances of a positive peer review;
iii) prevent the author(s) being tagged a “denier”
This usage (cli.sci.) should not be confused with the non climate science definition, at which it is in polar opposition.
Suggested Synonyms: “dangerous”, “never before seen”, “unnatural”
Antinyms: “normal”, “usual”, “natural”
Preferred Usage:
If used in the body of the paper itself, it is usually applied to comparisons of low resolution past data against high resolution recent data in order to “show” that AGW is “real and happening now”. Note that justification for usage of the word is rarely required, however in order to ensure such justification is not required of you, we recommend that significant graphmanship is used in the paper itself – with care, this descriptor can be used on any data set and post-hoc justified by reference to the graphs ONLY, providing one follows standard cli.sci. procedure and does NOT publicly archive data for at least 12-18 months.
Okay, I am now confused. The 1600 to 1950 is a 0.25 C dT for 370 years or 0.068 C per century versus a 0.11C dT for 1955 to 2010 or 55 years or 0.2 C per century. 0.2/0.068= 2.94 times but a bit of apples and oranges since 1955-2010 is based on Leviticus 0-700 meter data. Then in the heat content column they have 0.09 for 1600 to 1950 and 0.032 for 1955-2010 which is 2.81 times. Close enough. The problem appears to be between their Joules calculation and the Leviticus calculation.
Steve: even if their Table S3 is “fixed”, I fail to see how it shows that recent warming is unprecedented as the premise of the table doesn’t make sense.
I agree, I am just curious where the error is. Hyping an error is pretty odd even for Climate Science.
Steve,
I am preplexed on the use of vastly different durations (5500, 600, 350 and 45 years)to calculate the temperature gradient /century. It is likely that temperature gradient/century will be very dramatic when calculated over weeks/months/years. Statisitically, one simply does not compare results over vastly different averaging periods. Am i wrong to feel disgusted?
Steve: no. Having said that, there is much of interest in the Rosenthal article.
Good post. Maybe now we can finally get rid of the putative “Medieval Climate Anomaly” phrasing?
“In a reconstruction of Pacific Ocean temperatures in the last 10,000 years, researchers have found that its middle depths..”
It was right about there my eyes glazed over and I completely lost my train of thought but I do admire your powers of concentration Mr McIntyre.
Table error and misleading graphic aside…what is the defense for comparing a 55 year period with ones that are 370, 600, and 5500 years? And the 370 and 600 periods overlap by 100 years – followed by a gap of 5 years between the 55 and 370 periods. Is this a cherry pie?
Steve: doesn’t make any sense to me either.
Yes, can their proxy even record details on a decadal scale? If so the should show these detailed data over 9000 + years.Then only we can see if anything extreme is going on today.
Their “supplementary materials” pdf shows they used 200 year intervals to plot their Pacific OHC estimates. That being the case only comparisons with ~1812 to 2012 should be made to see if anything is “unprecedented”.
First of I have to declare that I don’t have any ability to analyze the merits of this reconstruction compared with others. I can’t say whether this is a better representation of the reality of the temperature history than others. But I can look at simple relations between results and conclusions in science. The fastest warming rate seems to fall exactly in the camp of unsupportable conclusions as Steve has identified here.
Comparing a ‘linear trend’ for 5000 years and 50 years does sound like nonsense. Publishing decadal trends for a centennial scale reconstruction sounds like nonsense. The question has to be when these authors had so much meat to work with in this reconstruction. When the data offers so many interesting points that possibly add to our understanding and challenge many assumptions then why does all the publicity focus on this weak point.
I think it’s safe to say that everybody in the climate debate are looking for more of these types of reconstructions to fill in the gaps in our knowledge it’s just a shame when some truely interesting results come to light the potential inferences we can make about how the climate system may work are overshadowed by the need for headline grabbing conclusions that could be argued have nothing to do with this work.
And when you do compare periods of more commensurate length, what do you get?
The trend over the period ~1675-1750 from Fig 2b looks to be as steep as that of the tacked on instrumental data.
Isn’t it that there’s always the need to have a climatologically sound/hallowed mechanism for the forcings required to get the upticks back in the Hollocene in order for it to ‘count’? Otherwise, those upticks and downticks are able to be discounted as the noise about the mean in trendlines that are more significant at century time-scales. [Whereas, in the modern era we have the benefit of instrumental data such that no matter what the proxy shows it’s deemed just fine if it corresponds to the recent instrumental data in trend and/or magnitude].
In the Hollocene, there’s pretty-much only acceptable metrics for rapid cooling/recovery spells (ie, volcanoes), even if sometimes tree-rings may skip a beat on them 😉 …Any inferred warm-spike thus far can only have anthroprogenic origins, and there have been no natural ‘recoveries’ from such as of yet– nor anticipated, I suppose.
Salamano and AndyIndia, I am not at all certain that I understand the points you are attempting to make here, but you need to know that the instrumental record and proxy reconstructions are not of equivalent validity or coverage. We understand the physics of thermometers but not so much that of the proxy responses to temperature given all the other variables that can affect that response. A well calibrated thermometer responds to temperature under very different conditions with an R^2 near 1, whereas that is never the case with proxies. Excluding any considerations and added problems here like for example selecting proxies after the fact, one can never ever attach the instrumental record to temperature reconstruction under the implication of equivalency – unless of course the relationship is as well understood as the case of the instrumental thermometer.
I have not read the paper under discussion here, but excluding all the other problems with proxy use in these reconstructions that we frequently see in these methods, the only fair comparison with the instrumental period would require using the latest sampled reconstructions and comparing that data with earlier time reconstruction data. If the resolution of the proxy is sufficiently low not to allow that comparison then so be it , do not make it.
I hear what your saying, and your point is valid to say that ‘no comparison’ should be made if proxy reconstruction and instrumental reconstructions are inequitable (which they are).
My point goes both ways though– reading the squiggles in previous eras to indicate that “see, this slope was steeper back here than what we have now” is perhaps an equally fallacious move, for, as stated often in other blogs, there needs to be a meteorologically/climatologically sound argument for the spike itself that goes beyond the mere statistical representation.
So far, there seems to be only acknowledgement of legitimate natural cold spikes (post-volcanic eruptions for example). There are no such warm-spike existent in the literature to my knowledge– except for the recent anthroprogenic activity.
Thus, any past spike/slope/trend that shoots noticeably warmer than the mean [that can’t be considered a potential recovery from a located significant volcanic eruption] would be called into skepticism absent some sort of mechanism. Taking the literature into hand then, we are presented with a much more smoothed, gradual set of temperature changes over time, and then the spike during the instrumental era.
It may be erroneous to declare it with certainty as “15 times” whatever it was in the past, but coming up with a different number (or even some other surpassing trend in the past is equally problematic. Staying within the paper and just questioning where the actual 15 comes from is fine with me. I’m just looking at a larger context.
“So far, there seems to be only acknowledgement of legitimate natural cold spikes (post-volcanic eruptions for example). There are no such warm-spike existent in the literature to my knowledge– except for the recent anthroprogenic activity.”
Salamano, perhaps you are unaware that the comparisons you want to make almost certainly involve comparing a proxy response in the historical period to the instrumental record in modern times. For your purposes what is required is comparing a proxy response in historic times to proxy response in the modern times.
A proper way to do this and not bias the proxy selection in modern times (by selection of proxies based on correlation to the instrumental record) is to have an a priori selection criteria for proxies and then use all the proxy data. You need to do this to get the averaging effect that is required to average out all the other variable noise different from temperature that can effect the proxy response.
In this process you might find that the temperature signal is not sufficiently larger than the noise to make a proper thermometer or you might find that the non temperature variables are not sufficiently random to make the proxy a thermometer. You may find that the proxy approach is not valid, but at least you took a proper approach in an attempt to compare historical and modern temperature changes.
Doing it the way that you evidently prescribe and one that is favored by climate scientists is simply wrong-headed and is more about spinning the AGW issue than science.
Yes, I think your apples-apples comparison is probably a necessary ingredient, and a “missing link” of sorts that has been quested for by many-a grant offering and climate paper.
…Something that shows an ‘appropriate’ response in the past, combined with a valid response in the present that’s comparable to the instrument temperature record. Marcott et al have the proxy response of the past, but the present-era is not valid (unless you assume so simply because it mimics the temperature record). Likewise many dendro reconstructions cover a lot of past several centuries, but fail to ‘en masse’ replicate the modern signature in the instrumental record unless it is heavily weighted toward a handful of trees.
It is certainly hard to get away from, because we “know” the modern-era temperatures with much more certainty than that of the past. It makes certain proxy results intuitively acceptable…maybe even to the point of confirmation bias. There’s even that jibber-jabber about including various poor proxies (contaminated, strip-bark, etc.) simply because it validates statistics of what we “know” better than without it– as if to say including the Yankees batting averages as a proxy should also be acceptable if it increases robustness.
However, do you not think that instead a concentration on the ‘trends’ in the temperatures rather than the values themselves constitutes a different/new line of reasoning in this arena, and one that may have more traction?
Steve: one of the attractions of the Mg-Ca proxies used by Rosenthal et al is that they are believed to have a monotonic and physical response to temperature – a point noted up at CA many years ago. The disadvantage is the low resolution of most ocean proxies. The site of the Rosenthal study is unusual in that it is both tropical and high accumulation (i.e. higher resolution).
“However, do you not think that instead a concentration on the ‘trends’ in the temperatures rather than the values themselves constitutes a different/new line of reasoning in this arena, and one that may have more traction?”
If by trends in temperature you mean the looking at the rates of increases instead of levels to which the temperatures might increase, I would agree that climate science and advocates for immediate AGW mitigation would appear to have made this change in emphasis. I have stated that a few times lately at these blogs. The rate of change in CO2 atmospheric concentrations in place of eventual concentration level is also being emphasized. Here the argument is that the resulting acidification of the oceans creates detrimental effects due to organism failing to adapt/evolve sufficiently fast to those conditions. Of course that is something that should be considered but also gets my wary eye because it appears forced to get the any detrimental effects of AGW moved closer to present time and used as evidence for immediate action on AGW.
Rates of temperature increases of the modern day versus historic times still depends on finding good temperature proxies and using that response to determine whether the modern warming rate is unprecedented and not making apples to oranges comparisons with the instrumental record.
“Steve: one of the attractions of the Mg-Ca proxies used by Rosenthal et al is that they are believed to have a monotonic and physical response to temperature – a point noted up at CA many years ago. The disadvantage is the low resolution of most ocean proxies. The site of the Rosenthal study is unusual in that it is both tropical and high accumulation (i.e. higher resolution). ”
I agree that the physics and straightforwardness of some of these proxies for temperature make them much better potential proxies for temperature than, for instance, TRW or MXD. Isotope ratios of oxygen and hydrogen in water appear in that class that has a better physical understanding, but there we need to know where that water evaporated and whether the source of that water changed over time. Ice cores that go back in time to glacier periods seem to faithfully record those epochs where changes in temperature are large. I have read that smaller changes such as the recent warming are more difficult for those proxies to detect accurately. Mg-CA appears straight forward but I believe by inference from reading at this thread that changing thermoclines can make the proxy response very noisy in the case of Rosenthal et al and thus uncertain as to an average level.
I have no problem with any of these temperature proxies if the authors of the reconstructions are very careful about noting the physical, spatial, and temporal limitations and attempt to put reasonable confidence limits on the results. Unfortunately I see way too much selection after the fact and no considerations for the problems associated with the proxies by the reconstruction authors who appear in too big a hurry to make advocacy points.
It is an interesting topic of discussion though…
“should it be” that temperature can only rise quickly through anthroprogenic means? We’ve got ample evidence of the cool-down/recovery cycle of massive volcanic eruptions, but what possible mechanism is theoretical out there to force a naturally derived warm-spike? As it stands, all such ‘spikes’ are deduced to ‘must be smoother’ in the past, while those cold ones associated with the eruptions are allowed to be retained.
Okay, El Nino is certainly one of these warm-spike triggers, if 1998 is any indication. Perhaps it can be more stark if there’s a strong El Nino near a volcanic eruption. Unfortunately, I don’t know how you can evidence the appearance of one in the paleo-past, though I suppose you can simply suggest it.
However, if a ‘spike’ is going to have to last 50-years or more to show up in the proxy… Hmmm.
“However, if a ‘spike’ is going to have to last 50-years or more to show up in the proxy… Hmmm.”
Salamano, I find it difficult to reply to your less than precise descriptors here. First of all the recent warming with AGW origins has to be unprecedented since it puts an artificial warming onto a natural background of temperature variations. That does not mean that a past natural cycle could have shown an approximate warming rate of the same magnitude. We have an upward trend for approximately 30 years from 1975 to 2005 and then a plateau to present time. You have upward “natural” trends in the instrumental record of at least half that rate of warming for the same period of time. The spike is unfortunately what you see when those doing reconstructions incorrectly splice the instrumental record to proxy responses in reconstructions.
If you look at sufficient proxy responses and into the instrumental period you will soon lose that spiking sensitivity and particularly when you realize that some of the proxies were selected after the fact.
Rate of warming (cooling) are important features of climate to study but the studies have to be carried out properly.
“The spike is unfortunately what you see when those doing reconstructions incorrectly splice the instrumental record to proxy responses in reconstructions.”
…Well, it can also occur when your selection/screening method of proxies decisively weight all those that mimic the temperature record as well. It doesn’t have to be a direct splice.
“If you look at sufficient proxy responses and into the instrumental period you will soon lose that spiking sensitivity and particularly when you realize that some of the proxies were selected after the fact.”
…However their non-conformity to the present ‘spike’ narrative is set aside beceause of the ‘hard data’ that is the instrumental record that, as the argument goes, vouches for any spike seen in the proxies [that are perhaps screened by the same spike]. In a reasonable sense, it is done also because there is a mechanism put-forth for such a spike (anthroprogeneity), one that by-definition cannot exist in the pre-industrial era.
So then, if there’s a mechanism that can be pointed to that ‘could’ account for a possible temperature trend/spike the likes of which is currently visible in the present era record, yet having existed a millenium or earlier ago… it gets a whole lot more interesting when identifying instances where whatever paleo-proxy data may show such a spike.
“…However their non-conformity to the present ‘spike’ narrative is set aside beceause of the ‘hard data’ that is the instrumental record that, as the argument goes, vouches for any spike seen in the proxies [that are perhaps screened by the same spike]. In a reasonable sense, it is done also because there is a mechanism put-forth for such a spike (anthroprogeneity), one that by-definition cannot exist in the pre-industrial era.”
Salamano, the first sentence above in your excerpted reply overlooks the fact that a proxy missing the upward trend in the recent warming could well miss it in the past. Your second sentence in the reply has no meaning with regards to the question of how the recent warming rate of increase, given agreed upon but not well quantified effects from AGW, compares to the past. It appears that there is agreement that proxies used in reconstructions could well be insensitive to quantitatively measuring these warming rates which leaves us with the temporally limited instrumental record and climate models.
Of course, the argument about rate of warming is merely in the abstract one, unless one is able and willing to attach with good evidence some causative detrimental and/or beneficial effects on mankind.
🙂 Okay… we can continue this. I don’t think we’re as far apart as implied…
“a proxy missing the upward trend in the recent warming could well miss it in the past.”
My second statement is/was a response to this…Maybe another try would help..? Here goes.
Yes, a proxy missing the upward trend in the recent warming would presumably have questioned accuracy for the past, where the grounding instrumental record doesn’t exist. However, it’s precisely because of the instrumental data that any “spike” in the recent era on just about ‘any’ proxy is accepted as valid, and any proxy group that does not show this is discounted for any number of new/old reasons designed to be a one-off that only holds water for the present era.
Ergo, by definition, a proxy cannot ‘miss’ spiked warming in the past when-it-comes-to-trends (the new fashion), because there’s no grounding mechanism established to foster such warming (because only anthroprogenic causes are established). Proxies may, however, demonstrate things about relative maxima/minima, provided they are validated by towing the line when it comes to the instrumental data and/or whatever else has been canonized in the 1500s and more recent.
By definition, a proxy CAN ‘miss’ present warming, and it doesn’t even matter, because of whatever legitimate reason or hand-waving employed to say it ‘would have’ matched the instrumental record, were it not for (diminished CO2 response, etc.) In either case, if the stated goal is ‘getting the temperature reconstruction right’, then they can freely ignore any proxy post 1850 and just stick with the instrument record (which is why sometimes they can’t help themselves if splicing it onto the truncated end of a paleo proxy).
“It appears that there is agreement that proxies used in reconstructions could well be insensitive to quantitatively measuring these warming rates which leaves us with the temporally limited instrumental record and climate models.”
Yes, but, as I’ve taken the liberty to re-state, it doesn’t matter if it’s assertable that warm-spike could have still occurred without being visible on the proxy data — because there has yet to be a presented mechanism to foster that kind of an equitable spike (remember, the only permitted explanation on the table is “anthroprogenic”).
“Of course, the argument about rate of warming is merely in the abstract one, unless one is able and willing to attach with good evidence some causative detrimental and/or beneficial effects on mankind.”
That certainly can be true… but I think that general philosophy/psyche of mankind vis a vis its biosphere holds that any sort of man-forced change is automatically bad. Is it bad that [insert endangered species] goes extinct? Is it bad to divert/manage river flow (or whatever)? I think this resonates more with liberals than other folks, where if any of these proverbial trees were to fall in the woods we would just adapt and get on with it, but because we think a man did it– it’s now a serious and dire concern.
Steve,
Your analysis leaves aside the possibility that errors in the measurement of OHC are currently so large that maybe nothing of any detailed value can be derived from the data.
The coloured confidence intervals derived from standard deviations are not the total error. There is another error component, this being bias. Many of us are perhaps familiar with the widespread rejection of instrumental data before the advent of the Argo floats, a rejection that was caused by bias shown by the older instruments compared with the new.
It cannot be assumed that Argo has eliminated its own bias; nor that a newer generation of instruments will not reject Argo because of bias. That remains to be tested.
In any event, the volume sampling density of Argo, the small % of their deployment time actually spent on recording temperatures (as opposed to getting ready to measure temperatures), the few years of actual measurement since the start about year 2000 and the inability to cover shallow sections of oceans all combine to prevent a correct use of present data for many purposes because of true errors. (Or so I propose, hoping to be shown wrong by those more closely involved.)
The error problems of floats applies as well to proxy data because proxies are often calibrated against instrumental float data.
I appreciate that your essay was concentrating on data interpretation and dissemination and not on the fundamentals and my contribution here is to augment the disquiet that you express.
Geoff, it does look like the instrumental has more uncertain than the Paleo 🙂 There seems to be a missing note c that might have explained things.
I read the paper intending to comment on it, but like you, I couldn’t find the “fifteen times” figure anywhere. At that point, I threw up my hands, so thanks for doing the necessary digging.
w.
Steve: nor did I succeed in locating its basis 🙂
Since press releases are… for the worldwide mass media use, the figure is probably only intended for PhD in television watching audiences… 😉
It would be nice if the authors could come out and say actually the strength of this work is in shedding light on ocean processes and their relation to global climate and this ‘fastest rate’ stuff in the press release is distracting from these more interesting points.
The authors must think about this stuff all day every day. They must have pride in what their science is adding to our knowledge and they must know that this ‘faster rate’ stuff is the weakest of their conclusions and probably in the wider context the least interesting in terms of what this adds to our understanding.
Steve: it’s worth listening to Andy Revkin’s interview with Rosenthal and Linsley – see link at dotearth. When asked to summarize the article, Rosenthal made no mention of the fastest in 10000 year meme. Revkin had to prompt him on this. The “fastest” meme feels forced to me – as though it was inserted late in the day to mollify referees.
See Kneel’s comment above. Par for the course.
It will be interesting to see if Rosenthal et al morph into crispy critters on the alter of Global Warming. Looks like Steve M. has lit some tender.
Have to agree with Michael. Just by eyeing the graph, it shows 3 short periods of warming from the bottom of the LIA. Each period has a greater incline than the present.
I’m baffled by their claims.
Looking over their ‘Rosenthal et al 2013 Figure 2C’ graph their are at least six, perhaps seven ‘upticks’ whose upward slopes match or exceed their claims for the recent heating trend.
Sitting back and considering their overall findings, I am very baffled by their supposed concerns over the recent upward heat trend.
When looking at eight or so thousand years of cooling oceans, one should be glad for any cooling reversal. If cooling has bottomed as part of a natural cycle, then eight thousand years of warming may be the next part of the cycle.
What these researchers should be worrying about is just how long before cooling ocean deeps becomes ice ball earth.
New Scientist is repeating the press release and even suggesting it supports the hockey stick: “Similar temperature trends are known to have happened over land – encapsulated in the famous hockey stick graph.”
http://www.newscientist.com/article/dn24503-unprecedented-warming-uncovered-in-pacific-depths.html#.UnWpOeLAZVU
Steve and Willis–
The 15 comes from Table S3A,dividing 8.4 (Joules) by 55 years (0.55 centuries), But that’s not “15 times”. It is 10 times the rate in the period 1600-1950,
Steve: of course, it’s not “15 times”. “15 times” remains unexplained: misreading this table would merely be an amusing “explanation”.
Yes, 15 divided by 1.5 is 10. That certainly doesn’t explain why “15” is getting touted. And even if they were touting “10,” it sure seems somewhere between apples-to-oranges and basically nonsense because the time period lengths are vastly different.
Also as Steve noted, the deltaHo of 8.4 for 1955-2010 doesn’t seem to make sense compared to a deltaHo of 5.6 for 1600-1950 when looking at the deltaT.
Each of the 1st 3 periods has a ratio of 22 (and change) to 1 between deltaHo and deltaT. But the 1955-2010 period has a ratio of 76 to 1. How/why does the conversion of deltaT to deltaHo change from 1955-2010 by a factor of 3.5 over the other time periods?
Seems like if those first 3 periods are calculated correctly and the deltaT is correct for all periods, then the deltaHo for the 1955-2010 period should be more like 2.4-2.5 x 10^22 J. So instead of 10 (or 15), the actual factor would be 3.
The last column doesn’t look right, to me either. I get -0.02 and -0.15 for the first two time series, but then I get 0.07 and 0.02 instead of 0.09 and 0.032, respectively.
Their assertion about “15 times”
Doesn’t jive with the way the graph climbs
They’ve a problem to solve
They can only resolve
Temps of century-scale or more climes
Thus admitted in their interview
When now-cautious Revkin did pursue
“Just how do you support it?”
Well, they can’t, they retorted
Faster change might have happened.
No clue.
So where do they get their “faster” claims?
Well, there are other papers. One claims
And cites Markott et al
But they know who will call
‘Cause the “global” busts some key Team claims
===|==============/ Keith DeHavelle
How do we reconcile the Rosenthal results with the data from the DSDP 980/981 and 984 sediment cores in the North Atlantic, which show net cooling over the last 10K years?
Steve: huh? Rosenthal shows net cooling over the last 10K years.
After looking carefully at the above graphs and doing some calculations, I have
decided to put on a very heavy sweater.
Perhaps what they are saying is that they can’t prove that temperatures rose faster in the last 10K years as fast as they are today. That is, there are no two years in the sample, that when minimized within the margin of error, show it was warming faster than today. A stronger statement would be that there is a connected function wandering through the margin of error that does not have a higher rate of warming than recently. Of course, the margin of error is greatly reduced, of course, due to accurate measurements.
For instance, 310 -320AD looks like it has a very steep line of increasing temperatures. But there are two points within the margin of error in 310 and to 320 that that minimize the heat change to zero.
” Of course, the margin of error is greatly reduced TODAY, of course, due to accurate measurements.”
It seems like they are comparing apples and oranges, with regards rate of change.
Steve: Apologies for the confusion, my mistake. Let me rephrase the statement. How do we reconcile the Rosenthal results, which show about 3 degrees of net cooling over the last 10k years, with the results from the DSDP cores, which show maybe a degree of net warming?
Perhaps Marcott et al are waiting until after the final, final publication of AR5’s WGI, where one finds:
as well as 3 additional citations in this Chapter; and Chapter 10:
It would be a crying shame, would it not, if the IPCC were obliged to “disappear” these citations and references as a consequence of a corrigendum?
Much better to spare the IPCC the trouble; then after publication someone can go through channels and protocol and the IPCC can eventually declare that the corrigendum makes no difference, so no changes are necessary 😉
Reblogged this on Niche Modeling and commented:
“these [modern] fluctuations appear to me to preclude any strong conclusions that the relatively modest increase [in ocean heat content] is unprecedented.”
As ocean levels fall dramatically (120m) during an ice age, I wonder if that factor influences any investigations of prehistoric OHC.
Vaughan Pratt is ripping Steve over at Climate, Etc., 11/3 0010 hrs on the Pacific Ocean Heat Content.
Steve: I am unable to see anything in his comments that refutes or contradicts anything in my post. His first comment begins: “The denizens of CA (starting with McIntyre) are no more aware of the Meridional Overturning Current than Rosenthal et al. Plate 10 here pretty much blows their analysis away.” The Meridional Overturning Current has nothing to do with my analysis, though it may affect Rosenthal’s analysis. I was primarily trying to determine whether unprecedentedness was established by Rosenthal’s data and concluded otherwise. This limited point appears valid to me regardless of the Meridional Overturning Current.
Steve:
A reasonable goal, given the statements in the Huffington Post and New Scientist liable to be read by a wide audience.
The difference between what is said in one sentence by Rosenthal in the paper and the ’15 times faster’ nonsense in the press releases exhibits for me a common propaganda technique used throughout the climate con: two positions are set up as if the only valid debate was where the truth lies between them. But, as Steve has shown here, there’s no basis for either. We live and hopefully learn.
Pratt’s last name tells the entire story. Move along, nothing worth mothering with.
That should be “… bothering with.”
Vaughn Pratt has removed the ambiguity in ‘pretty much blows their analysis away’ by confiming that the ‘their’ refers to Rosenthal et al. He has a nice point about the Meridional Overturning Current but is chary of showing it here.
==========
Steve, during the Holocene Climatic Optimum sea levels in the Pacific Ocean were at least 1.5m higher. Remnants of corals dated 5,000BP can be found on atolls across the Pacific, above present day sea level. So anyone suggesting the HCO was not a global event will have to explain how the largest ocean of the planet was affected but not the rest of the globe.
Is this not another case of comparing recent hi-res ‘squiggles’ with smoothed paleo records, and claiming a recent squiggle is the squiggliest evah? Despite admitting past records are blind to any such short-term squigs?
ie. splicing higher resolution recent instrumental data onto low resolution palaeo-data … something no respected researcher does 🙂
And ignoring error bars in both past and recent data in the analysis.
The authors show they know which side the bread is buttered on , that research in the area seems to ‘need’ such statements loyalty to ‘the cause ‘.
Shows how its not just ‘the team’ that as be compromised but the area in general. Sad but not unusual given how in acedmic you get jobs and promotion is, 9 out of 10 times , by keeping the ‘consensus’ and dam the data.
To their credit, Marcott et al. provided an estimate of the frequency response (amplitude and phase) of their reconstructions based on sampling interval, dating uncertainties and proxy magnitude uncertainty. It is summarized in their Figure S18 of the supplementary information document that accompanied their paper.
Their Figure S18 revealed, in a single graph, the reason why the PR claim of unprecedented rates of change of temperature in recent decades was utter nonsense.
I think an estimation of the frequency response of a proxy reconstruction should be required if the paper attempts to make claims about rates of change of anything.
“I think an estimation of the frequency response of a proxy reconstruction should be required if the paper attempts to make claims about rates of change of anything.”
While I certainly agree, I believe certain “weasel words” are also normally added – things like “… appears to suggest…”, “… seems to be…”, “… absent further research to the contrary…” etc. Not totally unreasonable where the interest is solely academic, I might add.
It appears to me that the chief claim arising from the release of this study, that warming is occuring at an unprecedented rate, if based on the flawed methodology of comparing a time series one set of proxy data (eg. foraminifera) with another type of data that being actual instrumental temperature recordings. This seems to be very dubious grounds for making such a claim.
It also seems that the much more robust conclusion of this work is that we have had 7,000 years of cooling, basically negating the storyline of the last 20 years that something unusual is happening. Talk about an own goal.
“This seems to be very dubious grounds for making such a claim.”
Agreed. Alas, this type of action does not appear to be unprecedented in published climate science, as is evident if one considers, for example, the entirety of CA posts.
Oh! Perhaps we have all misunderstood – the “climate of climate science publication” certainly appears to be remarkably similar to a hockey stick in several areas, and regrettably such carelessness with the details appears to one such similarity.
But interestingly, the first uptick from the trend line post year 1600 may be ’15 times faster’.
What confuses me is that the ocean heat content (the part they studied) warmed during the MWP and cooled during the LIA. I would have thought that the ocean would have done the reverse, and warmed during the medieval warm period and cooled during the little ice age. Could someone comment on this issue. Thanks in advance.
Sorry I had that backwards – the graph shows cooling during MWP and warming during LIA – which was what I meant to comment on.
The “… middle depths have warmed 15 times faster” and the rate being “… the highest in the past 10,000 years” claims aside, the graph shows a shape that is rather inconsistent with the blessed hockey stick. It seems odd that Professor Mann is endorsing it by touting the press release quote.
I’ve re-drafted the section on Table S3 adding a discussion of Figure 4. The re-draft didn’t alter any points, but expands the analysis.
You might want to add the 0.09 in the final column is incorrect as well.
On top of that, the 1.5 in the preceding column may also be incorrect. That value is based on 370 years, but 1650-1900 is only 350 years. If it truly is 1650-1900, then it should be 1.6 instead of 1.5.
That is one FUBAR table. And you don’t even need to be a “climate scientist” to see how many errors there are in it. An early elementary student can tell that 1650-1900 is 350 years, not 370. Exactly how did the authors botch it?
LOL, I meant 1600-1950…
Figure 2C from ~7,500-ybp to ~7,250-ybp the delta T is about +1.5K, which is about +0.6K/Century, or about 19-times greater than the modern warming rate presented on Table S3.
I am sure these graphs on Fig 2C are somewhat bollocks, so all of this discussion is essentially conjecture.
However, Figures 2C and 4B do show big changes over short time periods, both up and down, which implies that the data is 1) very noisy and inaccurate or 2) that natural variability is volatile or 3) a combo of 1) and 2).
Has a spectral analysis been done?
I now see Craig L and Jedd ID have noted this as well. Reading Vaughn Pratt’s comments at Curry’s Etc indicate this is a very noisy place in the ocean… makes sense that it is just a small piece of the puzzle taken out of context and spun for various purposes beyond understanding the earth and how it functions.
Steve: Pratt attempted to blame Climate Audit for Rosenthal’s extrapolation of this data to ocean heat content. however, this was done by Rosenthal. My guess is that the extension was done at the instigation of a referee.
We’re not in Oakland, anymore; there is an ambiguous ‘their’ there.
===========
Merci but what’s with the Oakland? Kansas and Toto want to know.
Gertrude Stein’s saying about Oakland, “There is no there there.”
Brilliant. How I love what I learn on CA.
Pratt said a lot of interesting things besides the “blame CA” remarks. It’s interesting, however, that OHC (and sea level, to a lesser degree) is the new team mantra being chanted since GAT has gone flat.
They know not whereof they speak. Both Marcott and Rosenthal demonstrate that we are at the cold end of the Holocene, and I don’t think we can break enough hydrocarbon bonds to change that.
=====================
Where can Roger Pielke Sr go for his apology?
MikeN: That’s exactly right.
Comparing a short 55 year period to a much longer period is pretty silly.
If you can’t resolve your earlier data to a similar 55 year period, you cannot make a comparison of slope/trend.
Its like comparing a short crescendo in a symphony to a whole movement..
Hmmmm, I’d say there definitely appears to be a whole movement in this study.
Ah but Steve,
you have forgotten about the amazing impact of dissolved CO2 on the specific heat capacity of 50% of the Pacific Ocean since 1955. /sarc off
And anyway.. if you look at the first graph, you can see MANY short term upward trends that are FAR FAR steeper than the last little bred bit.
bred ??? = red !!
Reposted here where I meant to originally.
I was going to post something I thought profound about having to do these proper analyses like StevM has done here in order to avoid taking away an authors through-away line that is repeated and emphasized in the media, but after reading here and at other blogs about this publication I have concluded what I think SteveM takes away from the issue of unprecedented OHC increases over the past 50-60 years and that is that it appears very forced in the publication under review here. The authors appear unable to show, given the resolution of their OHC reconstruction and even after ignoring the problems SteveM shows in their calculations, how they can really make any conclusions about the relative rate of OHC increases over the past few decades. The authors while appearing unable to judge the if, when, and where that heat from the oceans will be manifested or has been in the past, want to be clear that it will affect climate change.
The forcing of this issue does seem in line with the current popular theme in climate science and with advocates for immediate attempts at mitigation of AGW and that is that it is the rate of temperature increase, the rate of increases in CO2 levels in the atmosphere and here the rate of OHC increases that are more important than the level of these variables in predicting dire consequences from AGW.
According to Figure 2C, it takes another 400 years just to reclaim Medieval Warm Period temperatures, neglecting CO2 residency time and natural warming since the Little Ice Age.
Yes Manfred, we are lucky to be in the CSWTFP.
Figure 2c is pretty darned scary when you get right down to the meat of the thing. Serious cooling for that long doesn’t end well for the larger cities close to me like Seattle and Vancouver B.C.
In the paragraph above your Figure 1 and the second paragraph above “Table S3”, you refer to “Table S4”. Shouldn’t those references be to “Table S3”?
“The entire enterprise of attempting to compare changes in ocean heat content based on proxy data on Intermediate Water seems both ill-conceived and forced. ”
————————————————————-
While this is true, the results are remarkably similar to other reconstructions.
The declining temperature trend throughout the holocene due to declining arcitc insolation and glacier meltwater,
several warm periods around presumed Minoan, Roman and Medieval Warm Period dates,
the little ice age with a low after the Maunder Minimum and another dip at the Dalton Minimum.
The tiny measured increase in modern times is plausible, if we assume that previous warm periods were at least as warm and lasted for centuries. It just takes centuries to warm the oceans by a degree or anything notable.
May it just be that on longer time scales, local heat content oscillations (such as due to El Nino/La Nina, PDO etc) average out and the information from a few locations is then representative for global oceans ?
Ocean heat content measurements confirm that ocean warming is a very slow process consuming centuries. The implications are not yet part of the climate debate, but figure 2 makes clear that this is of paramount importance.
Firstly, transitional climate sensitivity will be lowered due to the very slow warming of the oceans\ which represent more than 90% of the climate system,
secondly, timescales are now in the ballpark of the residency time of CO2 in the atmosphere, bringing down equlibrium sensitivity as well.
But that is not all.
Another conclusion would be that the MWP and the LIA were not caused by internal variation of the climate system, because oceans and atmosphere warmed and cooled synchronously.
The forcing must then have been external, either by the sun or volcanic activity.
Both possibilites support the conclusion that the recovery since the LIA was in substantial extent naturally forced.
I would note that Rosenthal’s supplemental data has been updated and corrected. But I notice that there is no press release going out regarding the “15 times as fast” headline.
I wonder why….
Last year, I requested the underlying data for this article from Rosenthal and from Sciencemag. Rosenthal promised on several occasions to provide the data, but repeatedly failed to live up to his promise. In January 2014, Rosenthal archived the data in a revised SI at Sciencemag – without the courtesy of notify me that he had done so.
In my blog article on Rosenthal et al 2013, I had pointed out that Table S3 appeared to contain numerous errors.
The revised SI states that Table S3 contains errors. Rosenthal didn’t acknowledge or thank me for pointing out these errors.
The re-stated table S3 is shown below. The largest change is in their delta-T per century, where the reported value has been increased from 0.032 to 0.24. This was presumably some sort of mechanical error in the previous article. Other changes include shortening the modern Levitus period from 55 years to 45 years – I’m not sure why this was done. Changing the delta-T in the holocene (first line) from 8.4 to 6 – I still don’t see how they get this number. As before, their comparison of historical to modern depends on the assumption that the heat content in one half of the historical ocean changes without change in the other half: this doubles the modern comparison, thereby exaggerating the effect.
Hey Steve, your update above says March 1 2013. Don’t you mean 2014?
Steve –
Typo? Holocene ΔT changed from -1.1 °K to -1.35.
It was Levitus ΔH0 which changed from 8.4 to 6 (10^22 Joules).
With the updated value of 0.24 K/century, we can now conclude,
that recent ocean warming has to continue another 300 years to go back to medieval warm period temperatures, and
that recent ocean warming has to continue another 1200 years to go back to Holocene maximum temperatures.
To err is human, so mistakes in the first version of the table might be forgiven.
But why didn’t referees pick them up before initial publication? Why didn’t Science pick them up? Why didn’t Rosenthal acknowledge and thank Steve for finding them? Why is the correction still wrong, and why didn’t Science check it properly this time, given that it was already a corrigendum? The whole thing is almost unbelievably slovenly.
The very first thing to do in checking a table is to make sure that it is internally consistent. The ocean heat content values should be in direct proportion to the temperature values and it can be seen that the ratio is about 22:1. That is, column 3 should be 22 times column 2, and column 5 should be 22 times column 6. But these two ratios are 54:1 in the bottom row – clearly inconsistent with the rest of the table.
As for the 8.4 going to 6.0 in the third column, bottom row, could it be because the period has been shortened to leave out the change from 1955-65? But in that case, why has Rosenthal still got the same change in observed temperature?
This is not the first time Science corrigenda have proven to be incorrect. Surely it would pay them to have someone with at least some arithmetical and proof-reading skill to go over them and ask simple questions. To have the problems clearly pointed out, but then take 4 months to issue a totally botched correction is just appalling.
The Team has successfully redefined the peer review process.
Re:
This is an obvious appeal to Maxwell’s demon!
So from my calculation, today’s ocean in the new table still has 2.5 times more heat content than the older proxy measurements. In addition the short time window and high frequency response of actual thermometers vs slow responding proxies is ignored as a potential for the difference in heating rate?
Sounds like very good science to me.
Didn’t someone famous once say something about a real scientist would never slap a thermometer record onto a proxy record or something?
The anomaly variables always throw me. What is the reference value from which the anomaly is being calculated in each of these periods? Is it the mean of the period?
The way to answer their question would be a set a running 45 or 55 year periods, right? Basically, all such periods over a span of centuries or millenia. Then we would truly know if the slope here is unprecedented. I assume data of such resolution doesn’t exist?
4 Trackbacks
[…] https://climateaudit.org/2013/11/02/rosenthal-et-al-2013/ […]
[…] that there are reconstructions that counter his claims. Refer also to Steve McIntyre’s post here. To put things in perspective, Steve spliced NODC data onto the end of one of the graphs by […]
[…] that there are reconstructions that counter his claims. Refer also to Steve McIntyre’s post here. To put things in perspective, Steve spliced NODC data onto the end of one of the graphs by […]
[…] year, I wrote a blog post covering Rosenthal et al 2013 – see here. It reported on interesting Mg-Ca ocean cores in the western Pacific from the foraminfera H. […]