In a previous post on PAGES2K Arctic, I pointed out that they had used the Hvitarvatn, Iceland series (PAGES2K version shown below), upside-down to the interpretation of the original authors (Miller et al), who had interpreted thick varves as evidence of the Little Ice Age. A few days ago, Miller and coauthors archived a variety of series from Hvitarvatn, prompting me to review this data.
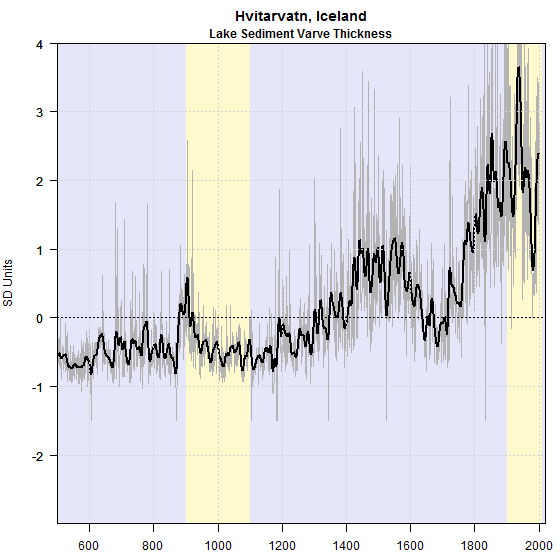
Figure 1. PAGES2K Arctic Hvitarvatn series. PAGES2K implicitly reconstruct a Little Warm Age during the period of glacier advance, the conventional Little Ice Age.
It turns out that Hvitarvatn is a very interesting lake sediment site for a variety of reasons. It is much more securely dated than the Baffin Island sites; it has been carefully described geologically; a variety of proxies have been calculated for the location; some proxies are available through the Holocene, not just the last 1000 years or so; and, there are a variety of other well-dated proxies near Iceland.
In geophysics, specialists work out from high-quality data to lower quality data, rather than throwing all of the data into a jumble (as paleoclimatologists do). In today’s post, I’m going to parse the Hvitarvatn data, which I will later use to parse the Baffin Island and Ellesmere Island varve data, all of which has become widely used since Kaufman et al 2009 (including PAGES2K, Ljungqvist and most recently Shi et al 2013).
Dating
Varve chronologies are determined by simply counting varves – which seems straightforward enough. In Iceland, a series of well-dated volcanic tephra permit a cross-check of varve counting. When reconciled to tephra, one of the varve chronologies was over 100 years short by the medieval period. The possibility of similar errors in varve chronologies in Baffin Island and elsewhere needs to be kept firmly in mind.
Varve Thickness and Glacier Advance
A number of canonical varve sites are from proglacial lakes (e.g. Big Round, Donard and Ayr in Baffin Island; Iceberg Lake in Alaska). Like these other sites, Hvitarvatn is a proglacial lake in the watershed of the Langjökull ice cap. Miller et al observe that varve thickness is controlled by the glacier:
Varve thickness is controlled by the rate of glacial erosion and efficiency of subglacial discharge from the adjacent Langjökull ice cap.
They observe that the Langjokull ice cap had receded during the Holocene optimum and had only advanced to the lake during the last millennium. They dated the start of the Little Ice Age to ~1250AD. They dated a first phase of glacier advance between 1250 and 1500AD, with a second phase commencing ~1750AD and ending only around 1900AD. Miller et al report that, within the entire Holocene, ice-rafted debris occurred only during this second phase, especially during the 19th century.
…The largest perturbation began ca 1250 AD, signaling the onset of the Little Ice Age and the termination of three centuries of relative warmth during Medieval times. Consistent deposition of ice-rafted debris in Hvítárvatn is restricted to the last 250 years, demonstrating that Langjökull only advanced into Hvítárvatn during the coldest centuries of the Little Ice Age, beginning in the mid eighteenth century. This advance represents the glacial maximum for at least the last 3 ka, and likely since regional deglaciation 10 ka.
The two outlet glaciers terminating in Hvitarvatn, Norjurjokull and Suojurjokull, advance slowly into the lake, occupying their maximum lake area in the late 19th century, and retreat comparatively rapidly in the mid- to late 20th century.
we place the start of the LIA in the highlands in the mid-thirteenth century, when Langjökull began a series of two long periods of expansion, with high stands at ca 1500 AD and in the nineteenth century.
This study presents the first continuous record of ice cap extent for the entire Holocene and clearly demonstrates that the LIA contained the most extensive glacial advance of the Neoglacial interval. The strong multi-proxy signal at Hvítárvatn implies that the LIA was the coldest period of the last 8 ka and suggests that is unlikely for any non-surging Iceland glacier to have reached dimensions significantly larger than its LIA maximum at any time during the Holocene.
The figure below shows varve thickness and ice-rafted debris data from Hvitarvatn.
Ice-rafted debris is interpreted as evidence that the glacier had advanced into the lake. It is completely absent from the record through the Holocene Optimum and is rare until the second phase of the Little Ice Age, with maximum intensity in the 19th century with local maxima in 1940 and 1890, before declining rapidly with the 20th century recession of the glacier.
The varve record begins about 3000 BP. Varves thicken quite dramatically commencing about 1250AD, which Miller et al interpret as the start of the Little Ice Age. They interpret 1500-1760AD as a sort of standstill, with, as noted above, thick varves in the second phase (19th century) coinciding with ice-rafted debris. Varves continue to be thick during glacier recession in the 20th century, continuing to be thick into the warm 1930s.
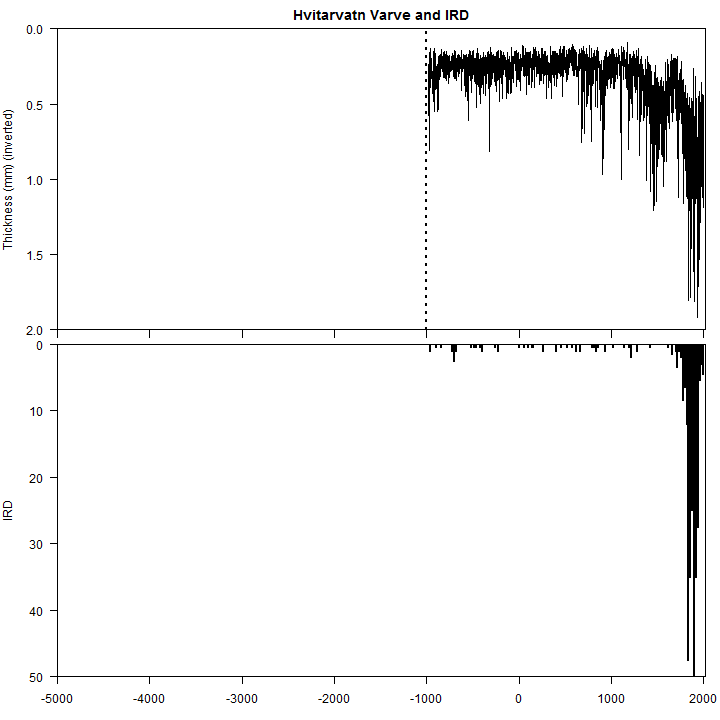
Figure 1. Hvitarvatn varve thickness and ice-rafted debris.
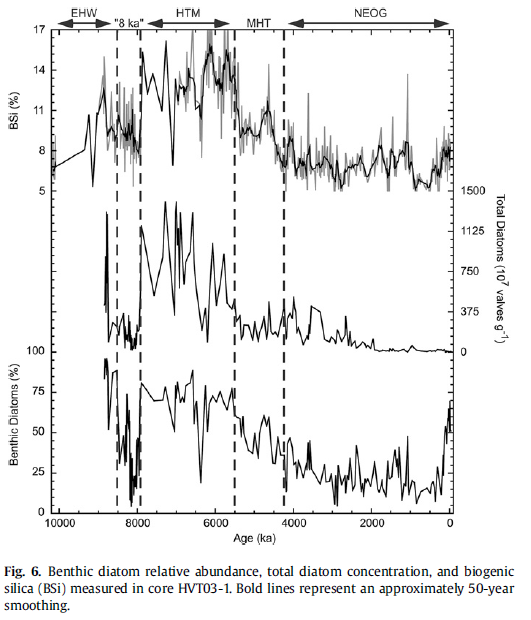
During the Holocene Thermal Maximum (HTM), the recession of the glacier meant that sediments were not varved. Miller et al utilized biogenic silica and information on diatoms to reconstruct HTM warmth, as shown below.
The Hvitarvatn data seems to provide rather secure information glacier advance and retreat, a topic of considerable importance in the older (pre-IPCC) paleoclimate literature (e.g. Matthes 1940).
Bradley and Jones 1993, an article which (rather than Mann et al 1998) did much to initiate the present programme of “multiproxy” studies, referred back to those older literature (Matthes 1940) in its introduction. They argued that records of glacier advance and retreat were compromised by the absence of continuous records and advocated instead reliance only on precisely-dated continuous records (tree rings and ice cores, but, in practice, mostly tree rings). This programme subsequently dominated the field, in part because of IPCC highlighting such studies.
At several sites (Soper Lake and Donard Lake, Baffin Island; Lower Murray Lake, Ellesmere Island), varve thickness has been said to be positively correlated with summer temperature. (Though no significant correlation between varves and temperature has been reported at similar sites: East Lake, Melville Island; Ayr Lake, Baffin Island).
PAGES2K appears to have incorporated Hvitarvatn varve thickness data into their dataset (with thick varves denoting warmth) on the basis of this practice at other Arctic sites. However, the original authors clearly interpreted thick varves as evidencing the Little Ice Age (the existence of which in Iceland is established by numerous indicators.) The PAGES2K version is clearly upside-down to this interpretation.
In an accompanying post, future post, I will compare Hvitarvatn varve thickness to varve thicknesses in the five “standard” varve thickness series used in Shi et al 2013 (and many other recent posts.)


14 Comments
Before Fig 1 there is perhaps a typo where Steve writes: “with maximum intensity in the 19th century with local maxima in 1940 and 1890, before declining rapidly with the 20th century recession of the glacier.”
I think he may have meant 1840 and 1890.
Steve,
It sounds like the varves are thick in the little ice age and thick in the warm 1930’s.
How does this make sense or make it a decent proxy for anything?
Steve: Are there any examples of dubious use of proxies leading to an underestimation of the modern warming?
It should be noted that when varve chronologies from proglacial sediments were originally studied in Sweden around 1900 it was strictly for dating purposes. I. e. the varve profiles could be wiggle-matched (like treerings) to determine the relative dates when the ice melted at each locality, and finally, by locating sites with varves going up to the present, to obtain an absolute date for the end of the ice-age at about 10,000 years age (in 1912!).
It was generally supposed that thick varves meant more melting of the ice and consequently more sediments, though some extremely thick varves found at some sites were recognized as being due to draining of nearby ice-dammed lakes.
It was early found that some varves were often missing at specific sites, so that careful comparison of several nearby sites was necessary to get a full series, and modern revisions of the varve chronology has almost always been upward.
A tremendous amount of work was done on teleconnections, i. e. trying to wiggle-match varves in Scandinavia, New England and Patagonia, but without any lasting success, and when I learned Quaternary Geology back in the seventies teleconnections was only mentioned as a classic case of a failed technique based on wishful thinking.
Who would have thought the old man to have had so much blood in him?
Actually Hvitarvatn is a case where the relation between varve thickness and temperature might not be at all straightforward. While glaciers were near the lake and advancing or receding I would expect the amount of glacial debris to vary inversely to the distance to the lake (but there would be very little IRD). However once a glacier reached the lake all sediment (including IRD) from the ice calved into the lake would be deposited there, so the amount would be more or less proportional to the volume calved. The very high amounts of IRD and sediments from the 1930’s might well be due to the breakup and retreat of a glacier tongue.
It is interesting to note that while one outlet glacier from the Langjökull still reaches the lake, another reaches to about a kilometer and a half from the lake, but the topography (side moraines) strongly suggests that it too reached the lakeshore in the recent past.
Incidentally I guess that the name “White lake” is due to the generally milky color of water with a large amount of fine glacial sediment in it.
Steve: I certainly didn’t suggest that Hvitarvatn had a direct relation between varve thickness and temperature. Surely the opposite. Here’s another statement, this time from Miller et al 2012 GRL: “On interannual timescales warmer (or wetter) summers are more efficient at delivering ice-erosional products to a lake, producing thicker annual laminations (varves [Leeman and Niessen, 1994]). However, on decadal and longer timescales it is glacier power, the amount of work a glacier accomplishes on the landscape, that controls varve thickness. Thus, supra-decadal changes in Hvítárvatn varve thickness track the intensity of Langjökull erosion, and serve as a proxy for ice-cap size [Larsen et al., 2011].”
tty:
How about precipitation? Heavy summer rains will melt ice a lot quicker and cause a lot more sedimentation, even though it might not be especially warm.
Likewise – a lot of Winter precipitation will create a lot of first-year packed snow, which on one hand might melt quicker in summer, but might not carry as much sediment.
Unless there is a 1:1 relationship between seasonal precipitation and temperature, it would be hard to know what you are measuring.
I am just flabbergasted that anyone could think to use a (DOUBLE!!!!) glacial terminal lake to count varves. Wasn’t there a problem with agricultural runoff in some lakes used elsewhere? If agricultural runoff is a problem, then one glacier advancing would be a bull in a china shop. TWO advancing glaciers would be two bull elephants in must, fighting in that same china shop.
This just stupefies me. There is simply no way they could get a reliable continuous record. They may have A record, but wouldn’t there be turbulation of the layers? Wouldn’t there be discontinuities in the record? Wouldn’t the advancing glacier(s) scour the lake bottom? Down to bedrock (hardened lava)?
Also, wouldn’t the runoff from the glaciers make invalid any varve readings? Ala agricultural runoff?
Flummoxed here, just flummoxed…
Actually I think that continuous deposition with annual varves is to be expected in such a lake, except where the glacier has bulldozed the bottom sediments, or if there has been a catastrophic draining of an ice-dammed lake. Deposition is high in summer (light layer) and low in winter (dark layer). Varved periglacial clays are very common in northern Europe.
However varve thickness, while certainly influenced by temperatures are affected by other factors, such as precipitation, glacier advances and retrets and hydrological changes (periglacial drainage systems tend to be immature and unstable).
I forgot to mention that agricultural runoff is not a problem in this area – too desolate.
tty –
Yeah, of course I knew that. No agriculture at the base of a glacier. I was saying that if agricultreal was a factor because of runoff, then how can glacial end not be?
It might help if more long-term thermometer data were available from the vicinity of a varved lake where varve thicknesses have been measured. Researchers at ETH Zürich have sampled modern varves from a number of high-level Swiss lakes which freeze every winter, for instance Oeschinensee at 1578m near Kandersteg in Canton Bern and Silvaplanersee near St Moritz in Canton Graubünden. There might be a climate station at an important long-established tourist resort like St Moritz.
Perhaps also worth bearing in mind that there exist in some lakes varve-like deposits which are not annual and so are not varves, but could be confused with them.
Steve: a number of datasets have been published for varved data from Silvaplana – see NOAA archive ftp://ftp.ncdc.noaa.gov/pub/data/paleo/paleolimnology/europe/switzerland/ – but these are all analyses of chironomids(midges) or mineralogy. Didn’t see anything as mundane as varve thickness. The articles indicate that the LIA was wet in this catchment. There are relatively long instrumental temperatures in this area.
There is this on Silvaplana:CHRISTIAN OHLENDORF,FRANK NIESSEN,HELMUT WEISSERT. 1997. GLACIAL VARVE THICKNESS AND 127 YEARS OF INSTRUMENTAL CLIMATE DATA: A COMPARISON
Climatic Change, July 1997, Volume 36, Issue 3-4, pp 391-411
Was there an adjustment to the varve thickness to allow for compaction due to depth?
Here are some pictures of the lake and glacier, which is right up against the lake
still. The glacier goes up the mountain ridge, melt water necessarily flows into the
lake. There is a smaller lake, Hagavatn, to the south of the glacier. It is reported that a ghost lives in one of the old cabins.
http://photosfromiceland.com/lakes/category/302-hvitarvatn-lake
One Trackback
[…] « More on Hvitarvatn Varves […]