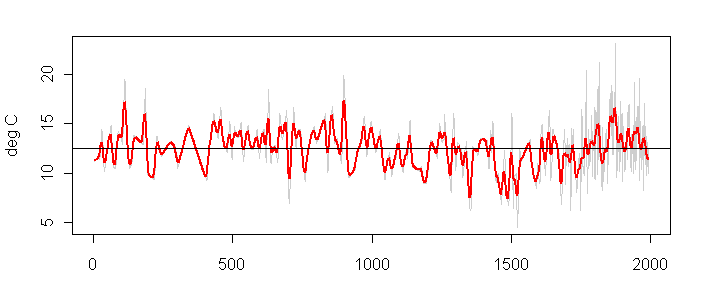
The Chesapeake Bay Mg/Ca proxy goes to late 1995 and is used in both Moberg et al [2005] and Mann and Jones [2003] for the proxy reconstructions up to 1980. Figure 1 below shows that its post-1980 behavior does not show an exceptional response to supposedly unprecedented temperature.

Figure 1. Chesapeake Bay Spring SST. Re-plotted from data at WDCP . See Figure 4 in article.
The Mg/Ca proxy for spring sea surface temperature "relies on the thermodependence of the uptake of magnesium into the calcitic shells of microfossils (Dwyer et al., 1995; Lear et al., 2000). Mg/Ca ratios in ostracode (Crustacea) shells are influenced by the water temperature in which the shell is secreted and the Mg/Ca ratio in the water." [Cronin et al, 2003]. The data goes up to late 1995 and does not include the warm 1998. However, it is evident that there is no unusual response of this proxy. The plot of the 19th and 20th century data looks more volatile, but Cronin et al. [2003] do not discuss whether this is an artifact of sampling. One sees increases in volatility in the modern portion of ice cores, where the change is attributed to isotope migration. One wonders whether a similar phenomenon may be at work here.
Both Moberg et al. [2005] and Mann and Jones [2003] splice CRU surface temperature histories after 1980 to their proxy reconstructions and the post-1980 proxy information is not used in these studies. Jones and Mann [2004] does discuss proxy behavior after 1980, claiming that the proxies from Mann and Jones [2003] also show unprecedented warming after 1980. A simple inspection of this record shows that it is obviously not driving the Jones and Mann [2004] claims. I think that I’ll show a couple more proxies and will make some comments on Mann and Jones [2003] and Jones and Mann [2004] in a few days.
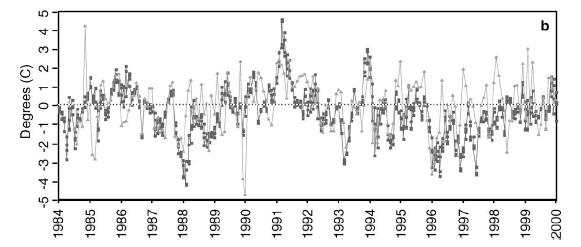
Cronin et al. contains the following interesting short history of temperature in the Chesapeake Bay, comparing local measurements and COADs measurements, with the COADs measurements diverging on the warm side in the later 1990s. I’m not familiar enough with the temperature datasets to comment on this issue, but found it interesting.

Original Caption to Figure 2b in Article: Comparison of Chesapeake Bay (CB station 5.1, >15 m) and COADs (75.7 –76.5jW, 36.5– 37.5jN) monthly temperature anomalies 1984– 1997. Chesapeake Bay temperatures from monitoring stations for the period1984– present (http://www.chesapeakebay.net/data) and for the period 1949– 1984 from M. Olson, Chesapeake Bay Program (http://www.chesapeakebay.net/bayprogram/data/wqual/htm). Comparisons of CB temperatures were also made with oceanic SST anomalies fromCOADs data from 1950– 2000 from the NOAA COADs website (http://www.scd.ucar.edu/dss/coads) and from 1984– 1997 from LamontDoherty Earth Observatory (available at http://www.lido.ldeo.columbia.edu).
Reference: Cronin, T. M., G. S. Dwyer, T. Kamiya, S. Schwede, and D. A. Willard, 2003. Medieval Warm Period, Little Ice Age and 20th Century Temperature Variability from Chesapeake Bay. Global and Planetary Change, 36, 17-29. ftp://ftp.ncdc.noaa.gov/pub/data/paleo/contributions_by_author/cronin2003/cronin2003.txt


7 Comments
One thing that Real Climate mentions about this paper is that the authors consider tree ring data to be useful for short-term fluctuations, but not for long-term trends greater than 80 years. The paper evidently combines longer-term data from sediment cores with shorter-term tree ring data in the graph.
My response to realclimate is: useful for what? Trees, we are told, are not sensitive to local temperature conditions, yet by some strange magic, can be used to measure something called the “global temperature”.
In climatic terms, 80 years is barely significant, let alone useful.
I may have missed the definition somewhere, but what is COADs?
John writes: Ah, those pesky scientists and their acronyms! I think it means “Comprehensive Ocean-Atmosphere Data”. Check out this site for more details.
I was just saying that Moberg, et. al., does not have nearly as much confidence in tree-ring data as did Mann, et.al, since Moberg considers tree-ring data unsuitable for long-term trends.
"The plot of the 19th and 20th century data looks more volatile, but Cronin et al. [2003] do not discuss whether this is an artifact of sampling."
The data at WDCP (Cronin et al, 2003) is composed of 3 different proxy data sets with a total of 450 samples. Almost half the samples are post 1750 as is shown below:
1900 – 1995 Total samples = 130
69 – RD/2209
39 – PTXT-2
22 – PTMC-3
1750 – 1995 Total samples = 223
99 – RD/2209
71 – PTXT-2
53 – PTMC-3
Post 1750 is the only time span that all three proxies contribute significant samples, as is evident from this plot. I think this explains the volatility.
Steve: looks like a logical explanation.
The link in post #5 is broke. The ‘/’ after the ‘.GIF’ has to be removed.
Steve: Fixed.
What is the implication of figure 2b (can’t really read it). Are there two series on here that are moving together? If so, can’t some numeric analysis (covariation?) be made?
Also, where is the feild study proof of the proxy relevance (direct measurement of temp and Mg/Ca) or at least the covariance versus local temp stations in 1900s? Does Steve agree that this proxy “works” in these terms?
One Trackback
[…] discussion of the topic from the early days of CA. Fourth series to enter the MJ03 portfolio is the Chesapeake Bay Mg/Ca proxy, also present in Figure 2. This series has declining temperatures since late 19th century. Finally, […]