The archived information for Wilson et al 2007 contains interesting new information on an unpublished West Siberian series (Putorama, 70 31 N, 92 57E). In this case, I was actually able to obtain a better correlation to gridcell temperature than the one reported by Rob by using a gridcell closer to the actual location. This series has no 20th century trend. Wilson noted a divergence from instrumental records at the end of the record. However, there is a remarkable divergence between the new West Siberian series which is touching lows at its end and the West Siberian series beloved by multiproxy reconstructions (Briffa’s Yamal series), which touches new highs at the end of its record.
Rob reported the following:
This series correlates with mean May–September gridded temperatures at 0.43 (Table 1). The Western Siberia series tracks the gridded temperature series quite well (Figure 3) except for the last two years, where the proxy values are substantially lower than the actual instrumental data. These two years of misfitting are too short to identify whether this is a significant divergence.
The temperature comparison was said to be to two gridcells (62-67N; 82E) over the period 1938-2000. However, there are available gridded values from 1881 on for the gridcell 67N, 87E (derived mainly from Turuhansk 66N 89E), obviously much closer to Putorama than the gricells used in the study. The correlation to the Turuhansk gridcell (over 1881-2000 exccept for a few years) for the May-Sept period specified in Table 1 was 0.54 – better than the reported values.
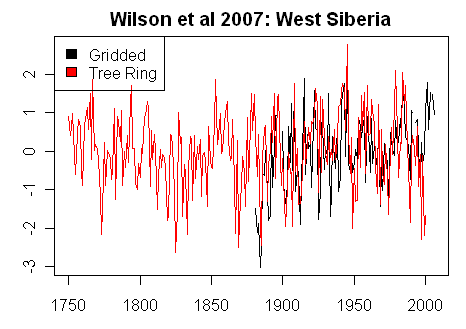
Here is a plot comparing the tree ring and gridded temperature series. While there is a good correlation to temperature, there is also no 1920-2000 trend in the tree ring data (actually slightly negative.)

Figure 1, Both series scaled to SD units.
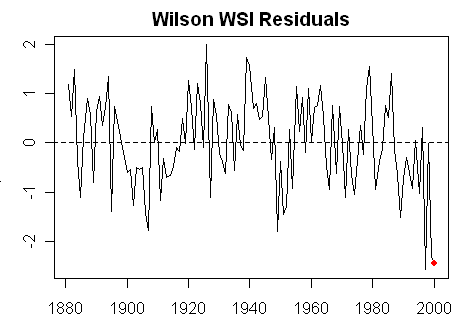
Rob noted that the data tracked well “except for the last two years” where there is a divergence. Visually, it looked to me like the divergence was more than just the last two years. Below is a plot of the residuals from a fit of RW against gridded temperature. While the negative residuals are more pronounced in the past few years, there does appear to be somewhat of a negative divergence trend in the residuals for more than the past two years. The Durbin-Watson statistic using the lmtest package in R was 1.50 – right at the red zone value – and differs substantially from the reported DW value of 1.98. I wonder how Rob calculated his DW statistic.

Figure 2. Residuals from fit to gridded temperature – in SD units.
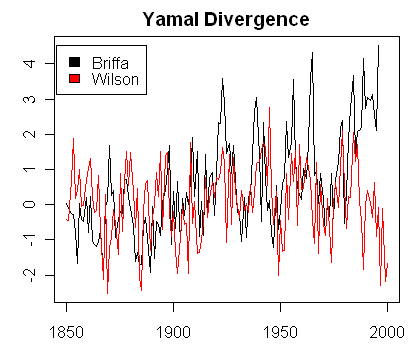
Now for the most interesting divergence. I’ve discussed the Yamal series (Briffa variation) on many occasions. This is a staple of multiproxy studies and is individually shown in the IPCC AR4 spaghetti graph. Although the Yamal chronology is usually attributed to Hantemirov (2002) e.g. by Juckes et al 2007, the staple version was calculated by Briffa, who has only reported the chronology and refused to provide the supporting measurement data. It has a pronounced HS shape with its medieval-modern differential very different from the Polar Urals Update. While the Putorama series is some distance to the east of the Yamal-Urals series, any new light on West Siberian chronologies is welcome.
The figure below compares the Briffa Yamal version with the new Wilson et al chronology. Whereas the Briffa chronology is exploring new highs at its close, the Wilson West Siberian series is exploring new lows. One looks forward to the commentary if and when a study is published on the new West Siberian chronology.


27 Comments
This sort of observation seems ripe for publication in GRL.
Wow, 5-6 standard deviations is truly divergence!
Guess which one they’ll say is wrong…
Hey Steve
Try flipping the sign on the last Yamal Divergence plot, looks like the correlation would be much higher.
🙂
Dennis@4:
Interesting observation, but one would assume somebody did some checking for such a gross error prior to publication.
Maybe the archive has been altered? But still very interesting difference.
Dennis:
I know you mean that in a lighthearted manner, but I’ll bet that the following schema would give good correlation for dates after 1970:
Wilson -> Mannomatic -> Briffa
Dennis Wingo says:
I think you’re right: if there is any sign flipped, it’s probably with the Briffa Yamal series. Unfortunately:
But, hey…
I was told that Mann’s original hockey stick paper in Nature was not peer reviewed. Is this correct and can that be referenced?
8 (Roberto): My understanding is that is was indeed reviewed by Mann’s peers-but nobody bothered to check his work until M&M! But Steve should set you straight here.
9. Will he see my post or is there a way to ask him directly?
Hi Steve,
If you calculate the correlation and DW stats against the gridded data I used (60-70N / 90-95E) I am sure that you will get the same results. However, it is good that you get a higher r value with a different Grid cell.
I just checked my DW result using SPSS and the result is the same so I am sure it is a matter of different target predictand data.
Rob
Re: Rob Wilson (#11),
Bump.
I just noticed this post from last year (I hadn’t attached tags to it.) At the time, Rob and I had different DW statistics – we now know the reason: Rob calculated DW by regressing cause(temperature) against effect (tree rings), while I regressed tree rings against temperature.
The divergence between Briffa’s Yamal and Wilson’s series is very characteristic of Siberian divergence.
Roberto, MBH 98/99 was peer reviewed.
Rob, It looks as if you have access to the archived (and perhaps other) data. I would dearly like to have a look at the numerical values that are being discussed and presented here as graphics.
Could you (or someone) possibly provide an address or details of the publication that might give me a start to collecting the numbers?
Thanks,
Robin
Surprising that a grid cell in Siberia would show zero trend. Or is it?
Good website! Steve, did you get the source code for computing the uncertainties (nesting method) of the reconstruction suggested by Rob Wilson?
Can you emulate these chronologies? I want to know how much of the “divergence” is real & biological vs. manufactured, via differences in standardization method (recalling that the standardization method behaves differently with different population/age-class structures).
Re: bender (#17),
MEasurement data for the series here (Putorama) is not archived. However, there are many archived Schweingruber series in Siberia that show similar “divergence” from Yamal.
As I mentioned before, I’m struck by a parallel here to the Graybill-Ababneh situation: Graybill’s strip bark is “dilated” in the 20th century relative to Ababneh. IMO the strip bark dilation comes from highly non-symmetric growth. The very high ring widths at some Yamal trees are not the result of a normal distribution response to temperature; while there may be a temperature component, the 6 sigma comes from something else: my guess is that the cores in question would be very asymmetric and the “big” cores are on the major axis.
In this regard, the asymmetry is not necessarily homogeneous. Some trees are more circular when young and their ellipticalness may be relevant only with age.
Re: Steve McIntyre (#20),
Radial asymmetry is often seen in trees with root or crown damage. The cambium connected to the damaged portions declines in activity, while the cambium connected to the intact portion picks up in activity (not unlike the bcps). You can’t tell from an external examination which parts of the cambium will be in decline and which will have heightened activity. I’m not sure if this pattern is documented in the literature. I would like to see some of Hantemirov’s sections. I surmised earlier he may have been choosing the fattest diameter with the fatter outer rings in declining trees in order to get the crossdating correct, thus inadvertently biasing the rw chronology.
Re: bender (#21),
This is the concern I expressed earlier. The requirements of the crossdating methodology (non-complacent samples) can have a significant impact on the data we collect.
Re: MrPete (#22),
I recall your comment about cross-dating. It is not really “cross-dating” per se that I am talking about (although I used that term). Rather, I was referring to the absolute dating (anchoring) of the present-day end point. The effect you were describing I imagined more coming into play in terms of correlations in interannual flucatuations through the length of the series. That’s very different from what I;m describing at the endpoint.
Re: Lucy Skywalker (#23),
Again, the radial asymmetry I’m referring to is not a consistent effect throughout the life of the tree. It just comes into effect at the end of the tree’s life. We’re talking fractions of a millimetre over, say, 50 years. Such a small increment it would account for less than 1% of the total radius.
Re: bender (#25), duh! I have to defer to your better knowledge here – though I have seen pics of Yamal trees that have lost the plot and have adapted to new positions.
I wonder if the divergence is associated with root disease: the downticks are sick and the upticks are benefitting from the decline in the sick. Armillaria is not something that would be immediately obvious to a dendrochronologist, working with above-ground stem wood. Any mention of root disease in the Hantemirov dissertation? Similarly, permafrost melting and re-freezing could cause physical breakage of fine roots, leading to decline in some portion of the larch population. This also would not be visible to anyone looking only at above-ground biomass.
Is there as much divergence within sites/chronologies as there is between sites/chronologies? It would be interesting to plot the “corridors” (i.e. max/min values) on each chronology (but focusing on just the 20th century divergence period). I wonder if the corridors overlap.
Radial asymmetry could be a typically Yamal reaction to shifting softish ground and rivers as we know happens there, trees being vertically challenged to remain upright, putting their efforts into asymmetrical growth.
hey, and that could relate to (amplification of) temperature changes.
Sulphur?
The deposition rates have fallen dramaticaly in the UK (EU??) in the last couple of decades and this has been picked up in UK forests (some forests now appear to be bordering on S deficiency ):
Click to access fcin088.pdf
Is it possible that changes in the USSR have altered more local sulphur emissions too? There is some out of date information on Arctic region sulphur in:
Click to access index.cfm